. 2017 Feb 7;9(1):14.
doi: 10.1186/s13073-017-0405-5.

Microbiomic differences in tumor and paired-normal tissue in head and neck squamous cell carcinomas

Affiliations

Microbiomic differences in tumor and paired-normal tissue in head and neck squamous cell carcinomas

Hannah Wang et al. Genome Med. .

Abstract

Background: While the role of the gut microbiome in inflammation and colorectal cancers has received much recent attention, there are few data to support an association between the oral microbiome and head and neck squamous cell carcinomas. Prior investigations have been limited to comparisons of microbiota obtained from surface swabs of the oral cavity. This study aims to identify microbiomic differences in paired tumor and non-tumor tissue samples in a large group of 121 patients with head and neck squamous cell carcinomas and correlate these differences with clinical-pathologic features.

Methods: Total DNA was extracted from paired normal and tumor resection specimens from 169 patients; 242 samples from 121 patients were included in the final analysis. Microbiomic content of each sample was determined using 16S rDNA amplicon sequencing. Bioinformatic analysis was performed using QIIME algorithms. F-testing on cluster strength, Wilcoxon signed-rank testing on differential relative abundances of paired tumor-normal samples, and Wilcoxon rank-sum testing on the association of T-stage with relative abundances were conducted in R.

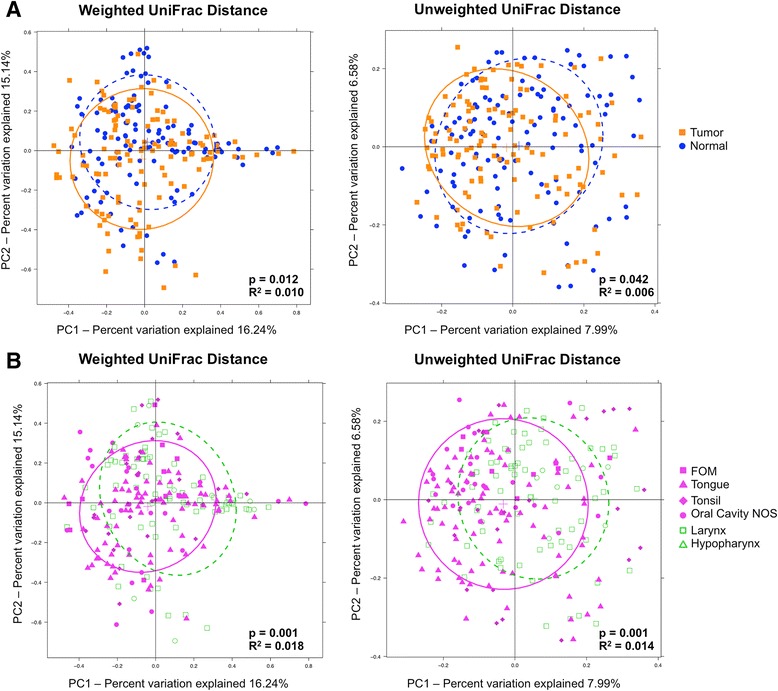
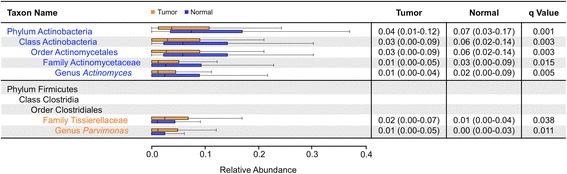
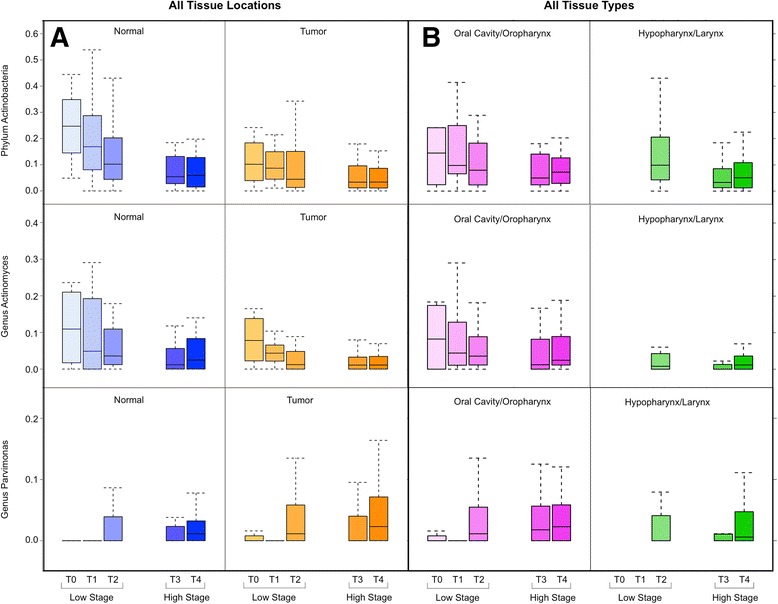
Results: We observed no significant difference in measures of alpha diversity between tumor and normal tissue (Shannon index: p = 0.13, phylogenetic diversity: p = 0.42). Similarly, although we observed statistically significantly differences in both weighted (p = 0.01) and unweighted (p = 0.04) Unifrac distances between tissue types, the tumor/normal grouping explained only a small proportion of the overall variation in the samples (weighted R2 = 0.01, unweighted R2 < 0.01). Notably, however, when comparing the relative abundances of individual taxa between matched pairs of tumor and normal tissue, we observed that Actinomyces and its parent taxa up to the phylum level were significantly depleted in tumor relative to normal tissue (q < 0.01), while Parvimonas was increased in tumor relative to normal tissue (q = 0.01). These differences were more pronounced among patients with more extensive disease as measured by higher T-stage.

Conclusions: Matched pairs analysis of individual tumor-normal pairs revealed significant differences in relative abundance of specific taxa, namely in the genus Actinomyces. These differences were more pronounced among patients with higher T-stage. Our observations suggest further experiments to interrogate potential novel mechanisms relevant to carcinogenesis associated with alterations of the oral microbiome that may have consequences for the human host.

Keywords: Bacteria; Head and neck squamous cell carcinoma (HNSCC); Microbiome.


Figures

Fig. 1
Fig. 1
Relative abundances of major phyla in the human oral microbiome. Bar plot of relative abundances of major phyla in the oral microbiome observed in this study and three previously published series. There were similar relative abundances of the most common phyla among tumor (orange) and adjacent normal (blue) tissue from this study. Additionally, these abundances were similar to previously published series describing the oral microbiome
Fig. 2
Fig. 2
PCoA plots of weighted and unweighted UniFrac distances of tumor and normal samples. Overall oral microbiomic diversity of patient samples as represented by PCoA of weighted and unweighted UniFrac distances. In panel (a), each point represents a single tumor (orange square) or adjacent normal (blue circle) sample, with plus sign and ellipses (orange solid line = tumor, blue dashed line = normal) representing the fitted mean and 68% confidence interval of each group, respectively. Adonis testing revealed statistically significant clustering based on the tumor/normal grouping (weighted p = 0.012, unweighted p = 0.042), but this clustering only explained a small proportion of the overall variation among samples (weighted R2 = 0.010, unweighted R2 = 0.006). In panel (b), each point represents a single oral cavity/oropharyngeal (magenta) or hypopharyngeal/laryngeal (green) sample, with plus sign and ellipses (magenta solid line = oral cavity/oropharynx, green dashed line = hypopharynx/larynx) representing the fitted mean and 68% confidence interval of each group respectively. The different shapes provided by the legend delineate smaller sub-categories of each location. Adonis testing revealed statistically significant clustering of oral cavity/oropharyngeal samples relative to hypopharyngeal/laryngeal samples (weighted p = 0.001, unweighted p = 0.001), but this clustering only explained a small proportion of the overall variation among samples (weighted R2 = 0.018, unweighted R2 = 0.014)
Fig. 3
Fig. 3
Significant taxa by Wilcoxon signed-rank in paired tumor and normal tissue. Box plots representing relative abundances of taxa observed to be significantly different between tumor (orange) and adjacent normal (blue) samples by paired Wilcoxon signed-rank testing after correction for FDR. Dark vertical lines represent the median, with the box representing the first (Q1) and third (Q3) quartiles, and the outer fences 1.5 × interquartile range. Outliers are not plotted. Values are reported as median (Q1–Q3), with q values representing significance of Wilcoxon signed-rank comparing tumor and normal relative abundances for each taxon after FDR correction. Taxa names are colored based on the group in which they are overrepresented
Fig. 4
Fig. 4
Relative abundances of differentially represented taxa stratified by T-stage. Box plots representing relative abundances of phylum Actinobacteria (top), genus Actinomyces (middle), and genus Parvimonas (bottom) stratified by T-stage. Dark horizontal lines represent the median, with the box representing the first (Q1) and third (Q3) quartiles, and the outer fences 1.5 × interquartile range. Outliers are not plotted. a Samples stratified by type (normal = blue, tumor = orange), with darker colors representing higher T-stage. In both normal and tumor samples, the relative abundances of Actinobacteria and Actinomyces decrease, while Parvimonas increases, with increasing T-stage. b Samples stratified by location (oral cavity/oropharynx = magenta, hypopharynx/larynx = green), with darker colors representing higher T-stage. In the oral cavity/oropharynx, the relative abundances of Actinobacteria and Actinomyces decrease, while Parvimonas increases, with increasing T-stage. In hypopharyngeal/laryngeal samples, only Actinobacteria is decreased with increasing T-stage

Similar articles

Cited by

References

    1. Parsonnet J, Friedman GD, Vandersteen DP, Chang Y, Vogelman JH, Orentreich N, et al. Helicobacter pylori infection and the risk of gastric carcinoma. N Engl J Med. 1991;325:1127–31. doi: 10.1056/NEJM199110173251603. - DOI - PubMed
    1. Castellarin M, Warren RL, Freeman JD, Dreolini L, Krzywinski M, Strauss J, et al. Fusobacterium nucleatum infection is prevalent in human colorectal carcinoma. Genome Res. 2012;22:299–306. doi: 10.1101/gr.126516.111. - DOI - PMC - PubMed
    1. Kostic AD, Gevers D, Pedamallu CS, Michaud M, Duke F, Earl AM, et al. Genomic analysis identifies association of Fusobacterium with colorectal carcinoma. Genome Res. 2012;22:292–8. doi: 10.1101/gr.126573.111. - DOI - PMC - PubMed
    1. Rubinstein MR, Wang X, Liu W, Hao Y, Cai G, Han YW. Fusobacterium nucleatum promotes colorectal carcinogenesis by modulating E-Cadherin/??-Catenin signaling via its FadA adhesin. Cell Host Microbe. 2013;14:195–206. doi: 10.1016/j.chom.2013.07.012. - DOI - PMC - PubMed
    1. Kostic AD, Chun E, Robertson L, Glickman JN, Gallini CA, Michaud M, et al. Fusobacterium nucleatum potentiates intestinal tumorigenesis and modulates the tumor-immune microenvironment. Cell Host Microbe. 2013;14:207–15. doi: 10.1016/j.chom.2013.07.007. - DOI - PMC - PubMed

Publication types