. 2017 May;31(5):1903-1915.
doi: 10.1096/fj.201600828R. Epub 2017 Feb 7.

Heparin-binding epidermal growth factor-like growth factor promotes neuroblastoma differentiation

Affiliations

Heparin-binding epidermal growth factor-like growth factor promotes neuroblastoma differentiation

Angela L Gaviglio et al. FASEB J. 2017 May.

Abstract

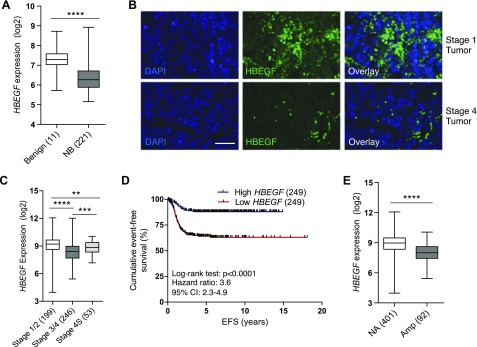
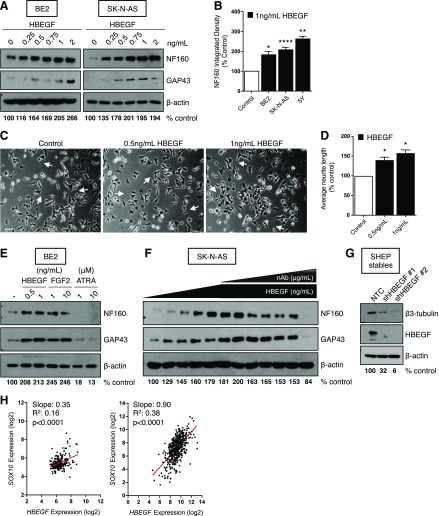
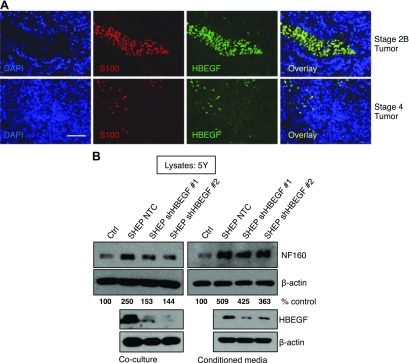
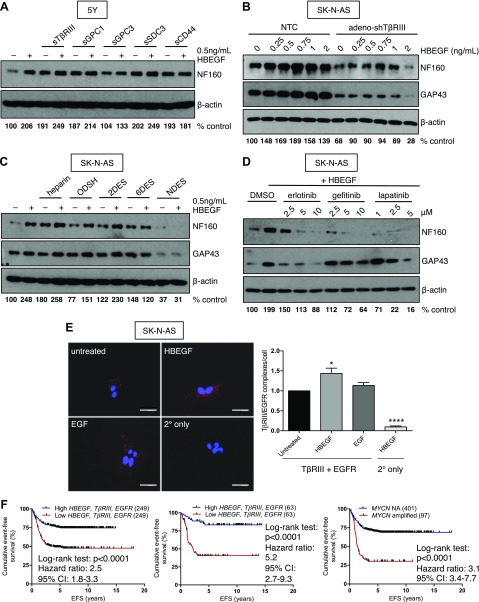
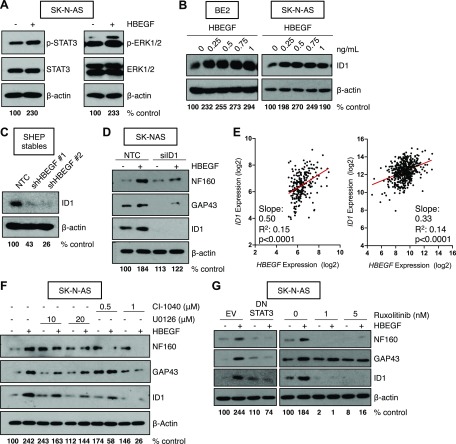
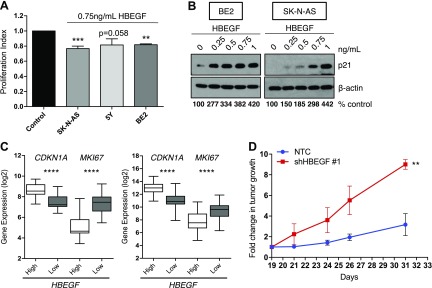
High-risk neuroblastoma is characterized by undifferentiated neuroblasts and low schwannian stroma content. The tumor stroma contributes to the suppression of tumor growth by releasing soluble factors that promote neuroblast differentiation. Here we identify heparin-binding epidermal growth factor-like growth factor (HBEGF) as a potent prodifferentiating factor in neuroblastoma. HBEGF mRNA expression is decreased in human neuroblastoma tumors compared with benign tumors, with loss correlating with decreased survival. HBEGF protein is expressed only in stromal compartments of human neuroblastoma specimens, with tissue from high-stage disease containing very little stroma or HBEGF expression. In 3 human neuroblastoma cell lines (SK-N-AS, SK-N-BE2, and SH-SY5Y), soluble HBEGF is sufficient to promote neuroblast differentiation and decrease proliferation. Heparan sulfate proteoglycans and heparin derivatives further enhance HBEGF-induced differentiation by forming a complex with the epidermal growth factor receptor, leading to activation of the ERK1/2 and STAT3 pathways and up-regulation of the inhibitor of DNA binding transcription factor. These data support a role for loss of HBEGF in the neuroblastoma tumor microenvironment in neuroblastoma pathogenesis.-Gaviglio, A. L., Knelson, E. H., Blobe, G. C. Heparin-binding epidermal growth factor-like growth factor promotes neuroblastoma differentiation.

Keywords: HBEGF; cancer; heparan sulfate; signaling; stroma.


Figures

Figure 1.
Figure 1.
HBEGF is decreased in patients with NB and correlates with survival. A) HBEGF expression in the microarray meta-dataset in benign neuroblastic tumors (ganglioneuroma/ganglioneuroblastoma) or NB tumors. ****P < 0.0001 (Mann-Whitney U test). B) Immunofluorescence in neuroblastoma specimens for HBEGF (green). DAPI nuclear stain in blue. Original magnification, ×40. Scale bar, 50 μM. C) HBEGF expression in patients with NB by stage. P < 0.0001, Kruskal-Wallis test. **P < 0.01, ***P < 0.001, ****P < 0.0001 Mann-Whitney U test for intergroup comparisons. D) Event-free survival (EFS) in patients with NB with low (bottom 50%; red) and high (top 50%; blue) HBEGF expression in the GSE49710 dataset. E) HBEGF expression in the GSE49710 dataset in nonamplified (NA) or MYCN-amplified (Amp) NB tumors. ****P < 0.0001 (Mann-Whitney U test). Box plots are presented as median (horizontal bars) and interquartile range (boxes).
Figure 2.
Figure 2.
HBEGF promotes neuroblast differentiation in NB cells. A) Western blot for differentiation markers after 72 h of HBEGF treatment in BE2 and SK-N-AS. Densitometry for NF160 normalized to β-actin is shown as the percentage of control. B) Quantification of NF160 densitometry normalized to β-actin from 3 independent Western blots (5Y, BE2) or 8 independent Western blots (SK-N-AS) after 72-h treatment with 1 ng/ml HBEGF and presented as means ± sem. P < 0.001 (1-way ANOVA). *P < 0.05, **P < 0.01, ****P < 0.0001, 1-sample Student’s t test. C) Representative phase-contrast images of BE2 cells after 72 h of treatment with HBEGF. Arrows identify long neurites. Original magnification, ×10. Scale bar, 100 μM. D) Quantification of neurite length using NeuronJ after 72 h of treatment with HBEGF from 3 independent experiments. P < 0.01 (1-way ANOVA). *P < 0.05, 1-sample Student’s t test. E) Western blot for differentiation markers after 72 h of HBEGF (0.5 or 1 ng/ml), FGF2 (1 or 10 ng/ml), or ATRA (1 or 10 μM). Densitometry for NF160 normalized to β-actin is shown as the percentage of control. F) Western blot for differentiation markers after 72 h HBEGF (0, 0.25, 0.5, 0.75, 1, 2 ng/ml) and a neutralizing HBEGF antibody (nAb; 0.0075, 0.015, 0.03, 0.05, 0.1, or 0.5 μg/ml). Densitometry for NF160 normalized to β-actin is shown as the percentage of control. G) Western blot for β3-tubulin and HBEGF in SHEP stably expressing an NTC shRNA or shRNA to HBEGF (shHBEGF #1, #2). Densitometry for β3-tubulin normalized to β-actin is shown as the percentage of control. H) Linear regression analyses using the microarray meta-dataset (left) or the GSE49710 dataset (right).
Figure 3.
Figure 3.
Schwannian stroma-derived HBEGF promotes neuroblast differentiation. A) Immunofluorescence in NB specimens using HBEGF (green) and S100 schwannian stroma (red) antibodies. DAPI nuclear stain in blue. Original magnification, ×40. Scale bar, 50 μM. B) Western blot for differentiation markers in 5Y after 72 h of coculture or treatment with conditioned medium from SHEP stably expressing an NTC shRNA construct or shRNA to HBEGF (shHBEGF #1, #2). Densitometry for NF160 normalized to β-actin is shown as the percentage of control.
Figure 4.
Figure 4.
HSPGs and EGFR interact to promote HBEGF-mediated neuroblast differentiation. A) Western blots for differentiation markers after 72-h treatment with 10 ng/ml soluble (s)TβRIII or sCD44 or 100 ng/ml sGPC1, sGPC3, or sSDC3 in the absence or presence of 0.5 ng/ml HBEGF in 5Y cells. B) Densitometry for NF160 normalized to β-actin is shown as the percentage of control, a dosecourse of HBEGF in SK-N-AS after 96-h TβRIII knockdown. C) Densitometry for NF160 normalized to β-actin is shown as the percentage of control, 0.5 μg/ml heparin, ODSH, 2-O desulfated heparin (2DES), 6-O desulfated heparin (6DES), or N desulfated heparin (NDES) in the absence or presence of 0.5 ng/ml HBEGF in SK-N-AS. D) Densitometry for NF160 normalized to β-actin is shown as the percentage of control, EGFR inhibitors for 72 h followed by 48 h of 1 ng/ml HBEGF treatment. Densitometry for NF160 normalized to β-actin is shown as the percentage of control. E) In situ proximity ligation assay in SK-N-AS after 5 min of treatment with 1 ng/ml HBEGF or 1 ng/ml EGF. Original magnification, ×40. Scale bars, 50 μM. Normalized TβRIII/EGFR complexes per cell (75–100 cells/condition) from 6 independent experiments. P < 0.001 (1-way ANOVA). *P < 0.05, ****P < 0.0001, 1-sample Student’s t test. F) Analysis of event-free survival in the GSE49710 dataset stratified by the top and bottom 50% for HBEGF, then TGFBR3, then EGFR expression (left) and analysis of event-free survival stratified by the top and bottom 12.5% for HBEGF, then TGFBR3, then EGFR expression (middle) compared with stratification by MYCN amplification status (right). NA, nonamplified.
Figure 5.
Figure 5.
HBEGF induces neuroblast differentiation via ERK and STAT3 signaling and up-regulation of ID1. A) Western blot in SK-N-AS for phosphorylated and total STAT3 or ERK1/2 after 72 h treatment with 1 ng/ml HBEGF. Densitometry for phosphorylated STAT3 or phosphorylated ERK1/2 normalized to β-actin is shown as the percentage of control. B) Western blot for ID1 in BE2 and SK-N-AS after 72 h treatment with a dosecourse of HBEGF. Densitometry for ID1 normalized to β-actin is shown as the percentage of control. C) Western blot for ID1 in SHEP stably expressing an NTC shRNA or shRNA to HBEGF (shHBEGF #1, #2). Densitometry for ID1 normalized to β-actin is shown as the percentage of control. D) Western blot in SK-N-AS after 96 h ID1 knockdown and 72 h HBEGF treatment. Densitometry for NF160 normalized to β-actin is shown as the percentage of control. E) Linear regression analyses using the microarray meta-dataset (left) or the GSE49710 dataset (right). F) Western blot for differentiation markers and ID1 after 24 h cotreatment with 1 ng/ml HBEGF and the indicated doses of U0126 or CI-1040. Densitometry for NF160 normalized to β-actin is shown as the percentage of control. G) Western blot for differentiation markers after 72 h expression of an empty-vector control (EV) or a dominant negative STAT3 (DN STAT3) construct and 48 h treatment with 1 ng/ml HBEGF or 48 h treatment with ruxolitinib and 24 h treatment with 1 ng/ml HBEGF. Densitometry for NF160 normalized to β-actin is shown as the percentage of control.
Figure 6.
Figure 6.
HBEGF suppresses neuroblast proliferation. A) Proliferation index from 3 (5Y) or 4 (SK-N-AS, BE2) replicates (means ± sem) of thymidine incorporation after HBEGF treatment for 24 h (SK-N-AS), 48 h (5Y), or 72 h (BE2), normalized to untreated control. P < 0.0001 (1-way ANOVA). **P < 0.01, ***P < 0.001 (1-sample Student’s t test). B) Western blot for p21 after 72 h of HBEGF treatment in BE2 and SK-N-AS. Densitometry for p21 normalized to β-actin is shown as the percentage of control. C) Linear regression analyses using the microarray meta-dataset (left) or the GSE49710 dataset (right). D) SK-N-AS NTC and SK-N-AS shHBEGF#1 subcutaneous xenograft. Tumors were measured at d 19 using calipers, and this measurement was used to calculate the fold change in tumor growth after 21, 24, 26, and 31 d. **P < 0.01, Kruskal-Wallis to compare curves.

References

    1. Maris J. M., Hogarty M. D., Bagatell R., Cohn S. L. (2007) Neuroblastoma. Lancet 369, 2106–2120 - PubMed
    1. Maris J. M. (2010) Recent advances in neuroblastoma. N. Engl. J. Med. 362, 2202–2211 - PMC - PubMed
    1. Mullassery D., Dominici C., Jesudason E. C., McDowell H. P., Losty P. D. (2009) Neuroblastoma: contemporary management. Arch. Dis. Child. Educ. Pract. Ed. 94, 177–185 - PubMed
    1. Matthay K. K., Villablanca J. G., Seeger R. C., Stram D. O., Harris R. E., Ramsay N. K., Swift P., Shimada H., Black C. T., Brodeur G. M., Gerbing R. B., Reynolds C. P.; Children’s Cancer Group (1999) Treatment of high-risk neuroblastoma with intensive chemotherapy, radiotherapy, autologous bone marrow transplantation, and 13-cis-retinoic acid. N. Engl. J. Med. 341, 1165–1173 - PubMed
    1. Kwiatkowski J. L., Rutkowski J. L., Yamashiro D. J., Tennekoon G. I., Brodeur G. M. (1998) Schwann cell-conditioned medium promotes neuroblastoma survival and differentiation. Cancer Res. 58, 4602–4606 - PubMed

MeSH terms

Substances