Comparative Study
. 2017 Feb 7;7(2):e012174.
doi: 10.1136/bmjopen-2016-012174.

Comparisons of neurodegeneration over time between healthy ageing and Alzheimer's disease cohorts via Bayesian inference

Affiliations
Comparative Study

Comparisons of neurodegeneration over time between healthy ageing and Alzheimer's disease cohorts via Bayesian inference

Marcela I Cespedes et al. BMJ Open. .

Abstract

Objectives: In recent years, large-scale longitudinal neuroimaging studies have improved our understanding of healthy ageing and pathologies including Alzheimer's disease (AD). A particular focus of these studies is group differences and identification of participants at risk of deteriorating to a worse diagnosis. For this, statistical analysis using linear mixed-effects (LME) models are used to account for correlated observations from individuals measured over time. A Bayesian framework for LME models in AD is introduced in this paper to provide additional insight often not found in current LME volumetric analyses.

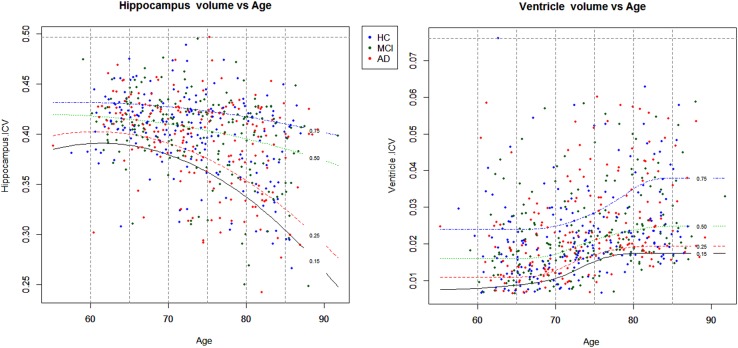
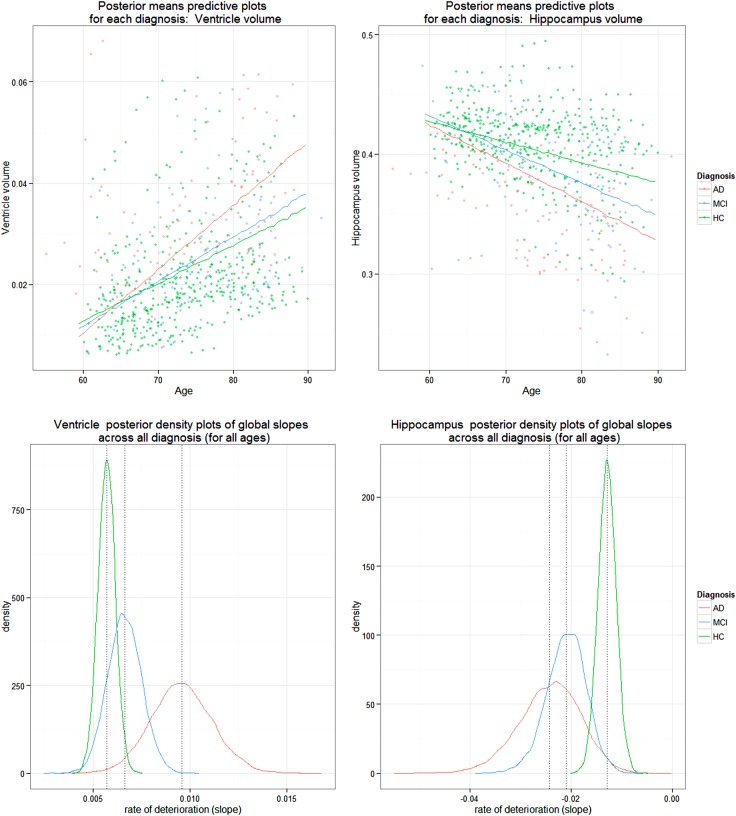
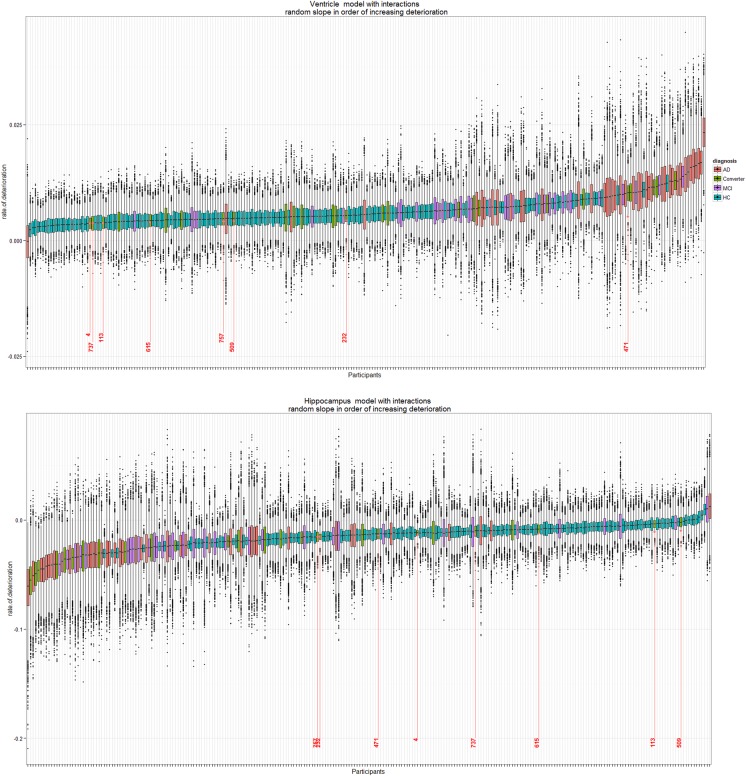
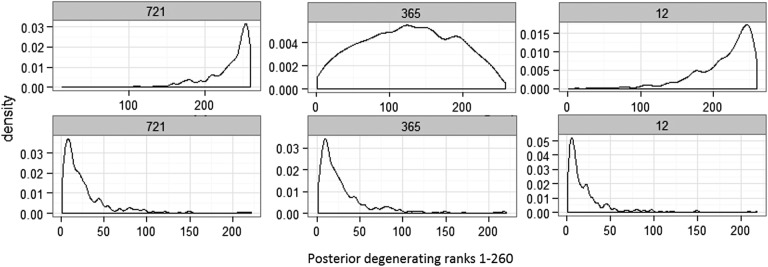
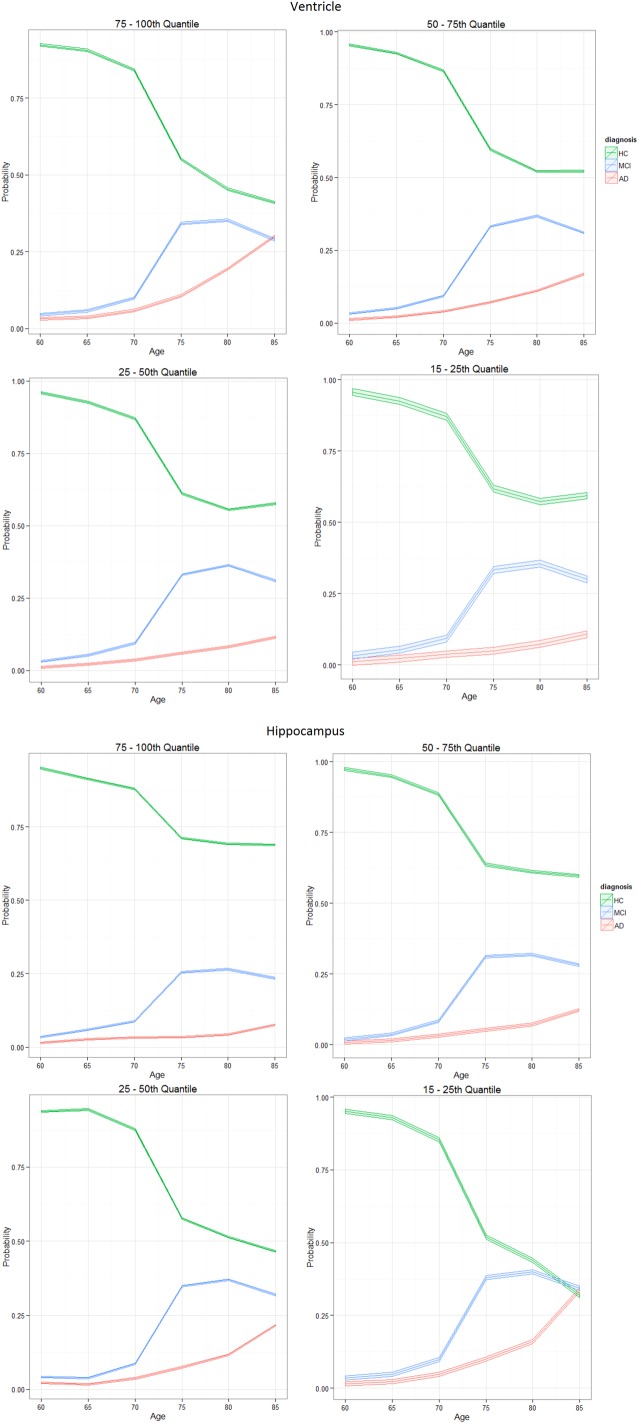
Setting and participants: Longitudinal neuroimaging case study of ageing was analysed in this research on 260 participants diagnosed as either healthy controls (HC), mild cognitive impaired (MCI) or AD. Bayesian LME models for the ventricle and hippocampus regions were used to: (1) estimate how the volumes of these regions change over time by diagnosis, (2) identify high-risk non-AD individuals with AD like degeneration and (3) determine probabilistic trajectories of diagnosis groups over age.

Results: We observed (1) large differences in the average rate of change of volume for the ventricle and hippocampus regions between diagnosis groups, (2) high-risk individuals who had progressed from HC to MCI and displayed similar rates of deterioration as AD counterparts, and (3) critical time points which indicate where deterioration of regions begins to diverge between the diagnosis groups.

Conclusions: To the best of our knowledge, this is the first application of Bayesian LME models to neuroimaging data which provides inference on a population and individual level in the AD field. The application of a Bayesian LME framework allows for additional information to be extracted from longitudinal studies. This provides health professionals with valuable information of neurodegeneration stages, and a potential to provide a better understanding of disease pathology.

Keywords: Alzheimer's disease; Bayesian inference; longitudinal neuroimaging study; mixed effects models; neurodegeneration.


Conflict of interest statement

Conflicts of Interest: None declared.

Figures

Figure 1
Figure 1
Centile ranges of volume across ages 60–85 years, for ventricle (left) and hippocampus (right). Recall region volumes are normalised by the ICV value as they represent a percentage of volume within the intracranial cavity. Ranges up to the 100th centile henceforth denote the empirical maximum volume for that region. Volume centiles; 75–100th from blue (0.75) to top dotted line, 50–75th from green (0.25) to blue (0.75) line, 25–50th from red (0.25) to green (0.50) line and 15–25th from black (0.15) to red (0.25) line. AD, Alzheimer's disease; HC, healthy control; ICV, intracranial volume; MCI, mild cognitive impaired.
Figure 2
Figure 2
Posterior densities of population mean estimates of linear deterioration rate for diagnosis (top plot): HC, MCI and AD, for ventricle (left) and hippocampus volume (right) models. Dotted lines on bottom plots denote the means for each density, whose values are shown in table 1. AD, Alzheimer's disease; HC, healthy control; MCI, mild cognitive impaired.
Figure 3
Figure 3
Box plots of posterior distribution of random-effect values for participants in the AIBL study (N=260) for full data (four time points). Ventricle (top) and hippocampus (bottom) rates of deterioration for each participant in the study. Since there are 157 HC, 34 MCI, 42 AD and 27 converters in this study, there is a higher uncertainty on the rate of deterioration of converters, MCI and AD participants (hence longer box plots) as compared with the HC (narrower box plots). Eight individuals who converted from HC to MCI throughout the study are highlighted in red with corresponding ID numbers. AD, Alzheimer's disease; AIBL, Australian Imaging Biomarker and Lifestyle Study of Ageing; HC, healthy control; MCI, mild cognitive impaired.
Figure 4
Figure 4
Posterior distribution of ranks for MCI to AD converters ID 721, 365 and 12, for ventricle (top) and hippocampus (bottom) ICV volume models. These density rankings were derived with observations from time points 1–3. AD, Alzheimer's disease; ICV, intracranial volume; MCI, mild cognitive impaired.
Figure 5
Figure 5
Probability curves show the posterior probability of HC, MCI or AD diagnosis for the ventricle (top) and hippocampus (bottom) models, while the 95% interval denotes the Monte Carlo error based on several simulations of the BLME models. Total volume is divided into four centile volume ranges, as shown in figure 1. Centiles: 75–100th, 50–75th, 25–50th and 15–25th. AD, Alzheimer's disease; BLME, Bayesian linear mixed-effects; HC, healthy control; MCI, mild cognitive impaired.

References

    1. Villemagne VL, Burnham S, Bourgeat P et al. . Amyloid β deposition, neurodegeneration and cognitive decline in sporadic Alzheimer's disease. Lancet Neurol 2013;12:357–67. 10.1016/S1474-4422(13)70044-9 - DOI - PubMed
    1. Stoessl AJ. Neuroimaging in the early diagnosis of neurodegenerative disease. Transl Neurodegener 2012;1:5 10.1186/2047-9158-1-5 - DOI - PMC - PubMed
    1. Adaszewski A, Dukart J, Kherif F et al. . How early can we predict Alzheimer's disease using computational anatomy. Neurobiol Aging 2013;34:2815–26. 10.1016/j.neurobiolaging.2013.06.015 - DOI - PubMed
    1. Mattila J, Koikalainen J, Virkki A et al. . A disease state fingerprint for evaluation of Alzheimer's disease. J Alzheimers Dis 2011;27:163–76. 10.3233/JAD-2011-110365 - DOI - PubMed
    1. Weiner MW, Veitch DP, Aisen PS et al. . The Alzheimer's Disease Neuroimaging Initiative: a review of papers published since its inception. Alzheimers Dement 2013;9:e111–94. 10.1016/j.jalz.2013.05.1769 - DOI - PMC - PubMed

Publication types

MeSH terms

LinkOut - more resources