

Quantifying antiviral activity optimizes drug combinations against hepatitis C virus infection
- PMID: 28174263
- PMCID: PMC5338374
- DOI: 10.1073/pnas.1610197114
Quantifying antiviral activity optimizes drug combinations against hepatitis C virus infection
Erratum in
-
Correction for Koizumi et al., Quantifying antiviral activity optimizes drug combinations against hepatitis C virus infection.Proc Natl Acad Sci U S A. 2017 Mar 21;114(12):E2540-E2541. doi: 10.1073/pnas.1702625114. Epub 2017 Mar 6. Proc Natl Acad Sci U S A. 2017. PMID: 28265074 Free PMC article. No abstract available.
Abstract
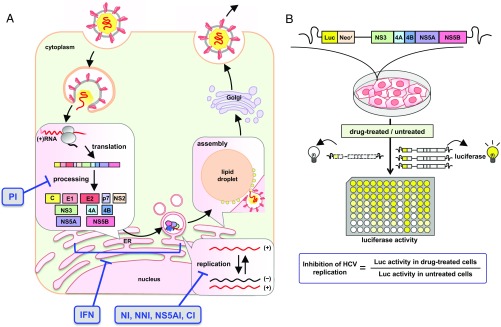
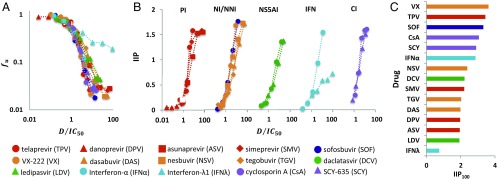
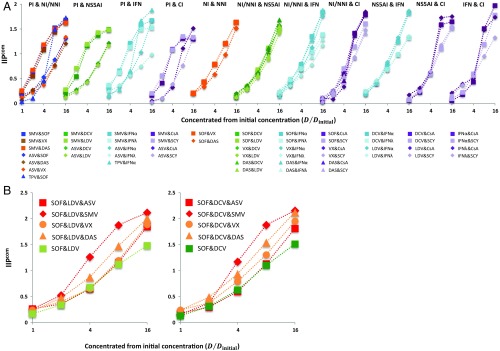
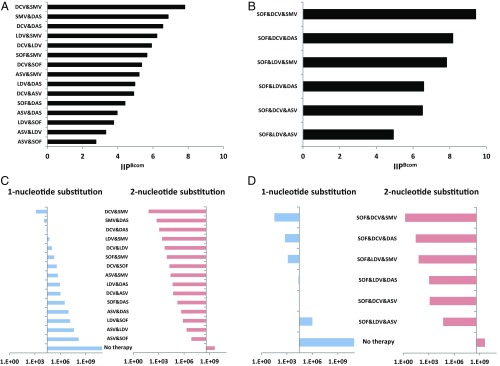
With the introduction of direct-acting antivirals (DAAs), treatment against hepatitis C virus (HCV) has significantly improved. To manage and control this worldwide infectious disease better, the "best" multidrug treatment is demanded based on scientific evidence. However, there is no method available that systematically quantifies and compares the antiviral efficacy and drug-resistance profiles of drug combinations. Based on experimental anti-HCV profiles in a cell culture system, we quantified the instantaneous inhibitory potential (IIP), which is the logarithm of the reduction in viral replication events, for both single drugs and multiple-drug combinations. From the calculated IIP of 15 anti-HCV drugs from different classes [telaprevir, danoprevir, asunaprevir, simeprevir, sofosbuvir (SOF), VX-222, dasabuvir, nesbuvir, tegobuvir, daclatasvir, ledipasvir, IFN-α, IFN-λ1, cyclosporin A, and SCY-635], we found that the nucleoside polymerase inhibitor SOF had one of the largest potentials to inhibit viral replication events. We also compared intrinsic antiviral activities of a panel of drug combinations. Our quantification analysis clearly indicated an advantage of triple-DAA treatments over double-DAA treatments, with triple-DAA treatments showing enhanced antiviral activity and a significantly lower probability for drug resistance to emerge at clinically relevant drug concentrations. Our framework provides quantitative information to consider in designing multidrug strategies before costly clinical trials.
Keywords: HCV; antiviral; instantaneous inhibitory potential; mathematical model; replicon.
Conflict of interest statement
The authors declare no conflict of interest.
Figures
Comment in
-
Reply to Padmanabhan and Dixit: Hepatitis C virus entry inhibitors for optimally boosting direct-acting antiviral-based treatments.Proc Natl Acad Sci U S A. 2017 Jun 6;114(23):E4527-E4529. doi: 10.1073/pnas.1705234114. Epub 2017 May 16. Proc Natl Acad Sci U S A. 2017. PMID: 28512226 Free PMC article. No abstract available.
-
Inhibitors of hepatitis C virus entry may be potent ingredients of optimal drug combinations.Proc Natl Acad Sci U S A. 2017 Jun 6;114(23):E4524-E4526. doi: 10.1073/pnas.1704531114. Epub 2017 May 16. Proc Natl Acad Sci U S A. 2017. PMID: 28512229 Free PMC article. No abstract available.
References
-
- Bartenschlager R, Lohmann V, Penin F. The molecular and structural basis of advanced antiviral therapy for hepatitis C virus infection. Nat Rev Microbiol. 2013;11(7):482–496. - PubMed
-
- Pawlotsky JM. Hepatitis C treatment: The data flood goes on-an update from the liver meeting 2014. Gastroenterology. 2015;148(3):468–479. - PubMed
-
- Cheng R, Tu T, Shackel N, McCaughan GW. Advances in and the future of treatments for hepatitis C. Expert Rev Gastroenterol Hepatol. 2014;8(6):633–647. - PubMed
Publication types
MeSH terms
Substances
Grants and funding
LinkOut - more resources
Full Text Sources
Other Literature Sources
Medical
