. 2017 Feb 1:5:2.
doi: 10.1186/s40462-016-0092-7. eCollection 2017.

Movement patterns of a keystone waterbird species are highly predictable from landscape configuration

Affiliations

Movement patterns of a keystone waterbird species are highly predictable from landscape configuration

Erik Kleyheeg et al. Mov Ecol. .

Abstract

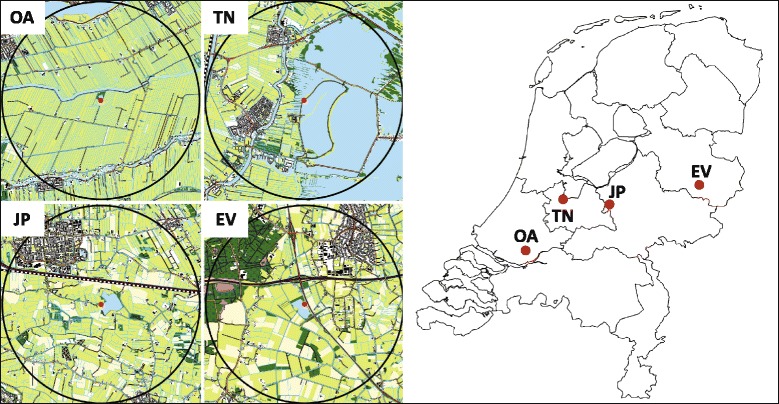
Background: Movement behaviour is fundamental to the ecology of animals and their interactions with other organisms, and as such contributes to ecosystem dynamics. Waterfowl are key players in ecological processes in wetlands and surrounding habitats through predator-prey interactions and their transportation of nutrients and other organisms. Understanding the drivers of their movement behaviour is crucial to predict how environmental changes affect their role in ecosystem functioning. Mallards (Anas platyrhynchos) are the most abundant duck species worldwide and important dispersers of aquatic invertebrates, plants and pathogens like avian influenza viruses. By GPS tracking of 97 mallards in four landscape types along a gradient of wetland availability, we identified patterns in their daily movement behaviour and quantified potential effects of weather conditions and water availability on the spatial scale of their movements.

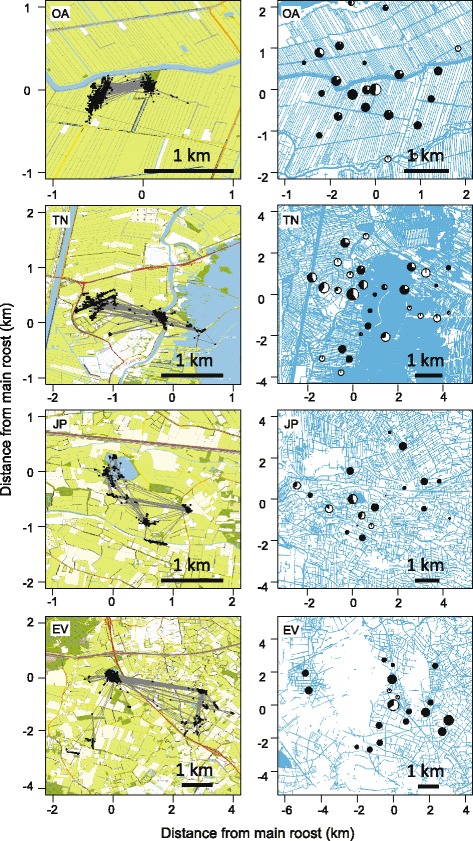
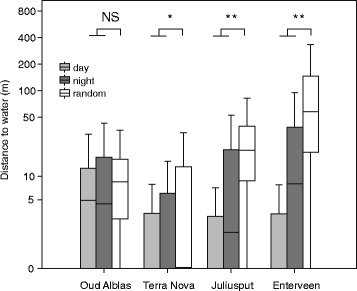
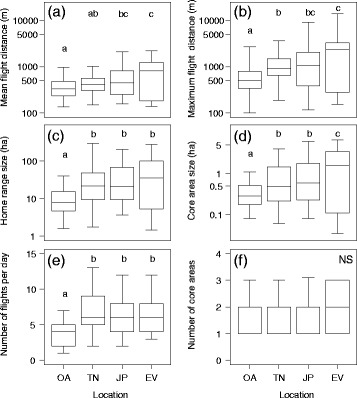
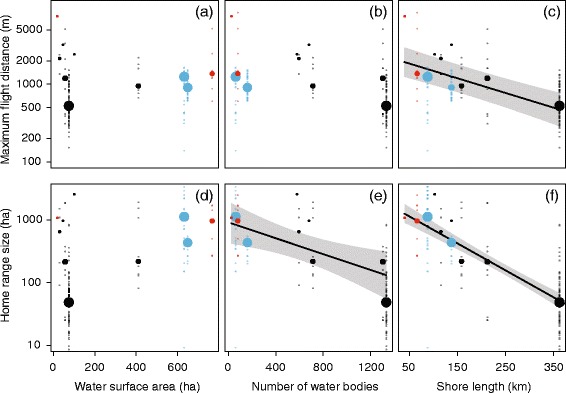
Results: We demonstrate that mallard movement patterns were highly predictable, with regular commuting flights at dusk and dawn between a fixed day roost and one or several fixed nocturnal foraging sites, linked strongly to surface water. Wind and precipitation hardly affected movement, but flight distances and home range sizes increased when temperatures dropped towards zero. Flight distances and home range sizes increased exponentially with decreasing availability of freshwater habitat. Total shoreline length and the number of water bodies in the landscape surrounding the roost were the best predictors of the spatial scale of daily mallard movements.

Conclusions: Our results show how mallards may flexibly adjust the spatial scale of their movements to wetland availability in the landscape. This implies that mallards moving between discrete habitat patches continue to preserve biotic connectivity in increasingly fragmented landscapes. The high predictability of mallard movement behaviour in relation to landscape features makes them reliable dispersal vectors for organisms to adapt to, and allows prediction of their ecological role in other landscapes.

Keywords: Anas platyrhynchos; Connectivity; Dabbling ducks; Dispersal; Habitat fragmentation; Home range; Land use change; Mallard; Movement ecology; Telemetry.


Figures

Fig. 1
Fig. 1
Topography and location of the four study sites in the Netherlands (OA = Oud Alblas, TN = Terra Nova, JP = Juliusput, EV = Enterveen). The vast majority (>96%) of observed mallard movements occurred within the black circles depicting the 2.5 km radius circle around the primary roost within which the landscape metrics have been calculated. The topographic maps show water (light blue), arable land (yellow), pastures (light green), forest (dark green), roads (dark lines) and buildings (black dots)
Fig. 2
Fig. 2
Example of representative tracks of a single mallard per study landscape (left; ca. 15 days per track) and the use of core areas in the landscapes of all tracked individuals separated between day (light parts in pie charts) and night (dark parts; right panels). The size of the pie charts is scaled to the relative number of GPS fixes recorded in the core areas. OA = Oud Alblas, TN = Terra Nova, JP = Juliusput, EV = Enterveen. Note the differences in scale: mallards at Oud Alblas use a much smaller part of the landscape around the main roost than do mallards at Enterveen. Left panels are zoomed in on the individual tracks. The maps show water (light blue), arable land (yellow), pastures (light green), forest (dark green), roads (dark lines) and buildings (black dots)
Fig. 3
Fig. 3
Distance to water in different landscapes during daytime and night time compared to 1000 random points in the same landscape. The boxplots show the median with 25th and 75th percentiles and error bars represent the range of 95% of all positions. Significance levels of differences between GPS positions and random points are depicted (* p < 0.05; ** p < 0.01). Note the log scale of the y-axis
Fig. 4
Fig. 4
The spatial scale of mallard movements at the four study sites in the Netherlands (OA = Oud Alblas, TN = Terra Nova, JP = Juliusput, EV = Enterveen) in the order of high to low freshwater habitat availability. Graphs represent a the mean flight distance per day, b the maximum flight distance per day, c the total home range size (100% MCP), d the core area size (50% KUD), e the number of flights per day, and f the number of core areas visited per day. The boxes indicate the median between 25th and 75th percentiles with whiskers depicting the 5th and 95th percentiles. Letters denote statistical differences (p < 0.05) based on HSD Tukey post-hoc tests following linear mixed-effects models (Table 2)
Fig. 5
Fig. 5
Relations between the movement parameters flight distance between roost and foraging site (a-c) and home range size (d-f) with the landscape metrics water surface area (a, d), total number of water bodies (b, e) and total shore length (c, f) within a 2.5 km radius around the primary roost. Data from study areas in the Netherlands (black), Switzerland (red), and France (blue) are shown. Solid points depict median values per landscape (with sizes proportional to the logarithm of corresponding sample size), transparent points represent original data, and lines and shaded areas depict the fitted line with 95% confidence intervals for the landscape metrics significantly contributing to log-transformed movement parameters (Table 3). Note the log-scale of the y-axis

References

    1. Bauer S, Hoye BJ. Migratory animals couple biodiversity and ecosystem functioning worldwide. Science. 2014;344:1242552. doi: 10.1126/science.1242552. - DOI - PubMed
    1. Nathan R, Getz WM, Revilla E, Holyoak M, Kadmon R, Saltz D, Smouse PE. A movement ecology paradigm for unifying organismal movement research. Proc Natl Acad Sci U S A. 2008;105:19052–9. doi: 10.1073/pnas.0800375105. - DOI - PMC - PubMed
    1. Haig SM, Mehlman DW, Oring LW. Avian movement and wetland connectivity in landscape conservation. Conserv Biol. 1998;12:749–58. doi: 10.1046/j.1523-1739.1998.97102.x. - DOI
    1. Green AJ, Elmberg J. Ecosystem services provided by waterbirds. Biol Rev. 2014;89:105–22. doi: 10.1111/brv.12045. - DOI - PubMed
    1. Brochet AL, Guillemain M, Herve F, Gauthier-Clerc M, Green AJ. The role of migratory ducks in the long-distance dispersal of native plants and the spread of exotic plants in Europe. Ecography. 2009;32:919–28.

LinkOut - more resources