

Mammalian Comparative Genomics Reveals Genetic and Epigenetic Features Associated with Genome Reshuffling in Rodentia
- PMID: 28175287
- PMCID: PMC5521730
- DOI: 10.1093/gbe/evw276
Mammalian Comparative Genomics Reveals Genetic and Epigenetic Features Associated with Genome Reshuffling in Rodentia
Abstract
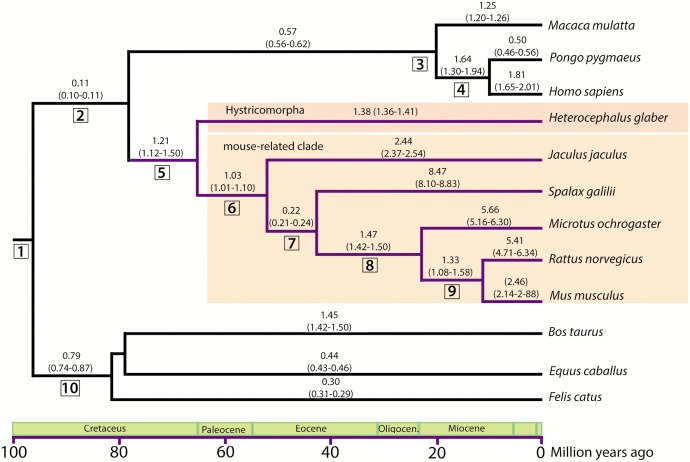
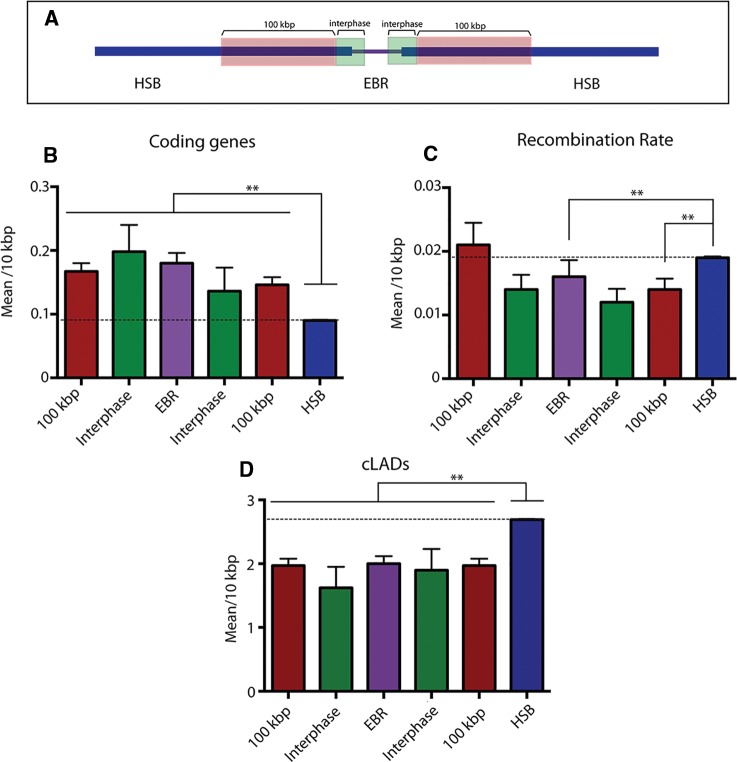
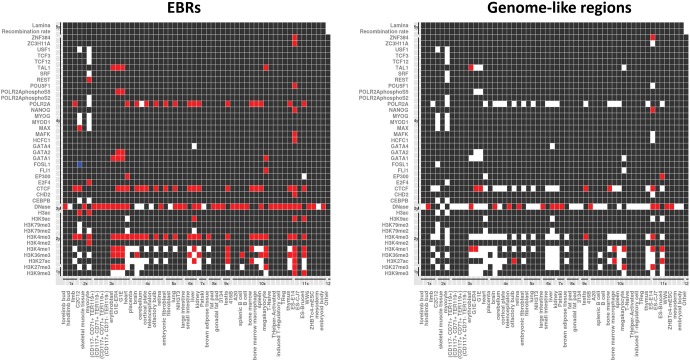
Understanding how mammalian genomes have been reshuffled through structural changes is fundamental to the dynamics of its composition, evolutionary relationships between species and, in the long run, speciation. In this work, we reveal the evolutionary genomic landscape in Rodentia, the most diverse and speciose mammalian order, by whole-genome comparisons of six rodent species and six representative outgroup mammalian species. The reconstruction of the evolutionary breakpoint regions across rodent phylogeny shows an increased rate of genome reshuffling that is approximately two orders of magnitude greater than in other mammalian species here considered. We identified novel lineage and clade-specific breakpoint regions within Rodentia and analyzed their gene content, recombination rates and their relationship with constitutive lamina genomic associated domains, DNase I hypersensitivity sites and chromatin modifications. We detected an accumulation of protein-coding genes in evolutionary breakpoint regions, especially genes implicated in reproduction and pheromone detection and mating. Moreover, we found an association of the evolutionary breakpoint regions with active chromatin state landscapes, most probably related to gene enrichment. Our results have two important implications for understanding the mechanisms that govern and constrain mammalian genome evolution. The first is that the presence of genes related to species-specific phenotypes in evolutionary breakpoint regions reinforces the adaptive value of genome reshuffling. Second, that chromatin conformation, an aspect that has been often overlooked in comparative genomic studies, might play a role in modeling the genomic distribution of evolutionary breakpoints.
Keywords: rodents; evolutionary breakpoints; recombination; KRAB genes; epigenome; lamina associated domains.
Figures
Similar articles
-
Unraveling the effect of genomic structural changes in the rhesus macaque - implications for the adaptive role of inversions.BMC Genomics. 2014 Jun 26;15(1):530. doi: 10.1186/1471-2164-15-530. BMC Genomics. 2014. PMID: 24969235 Free PMC article.
-
Why mice have lost genes for COL21A1, STK17A, GPR145 and AHRI: evidence for gene deletion at evolutionary breakpoints in the rodent lineage.Trends Genet. 2004 Sep;20(9):408-12. doi: 10.1016/j.tig.2004.07.002. Trends Genet. 2004. PMID: 15313548
-
A High-Resolution Comparative Chromosome Map of Cricetus cricetus and Peromyscus eremicus Reveals the Involvement of Constitutive Heterochromatin in Breakpoint Regions.Cytogenet Genome Res. 2015;145(1):59-67. doi: 10.1159/000381840. Epub 2015 May 13. Cytogenet Genome Res. 2015. PMID: 25999143
-
The promise of comparative genomics in mammals.Science. 1999 Oct 15;286(5439):458-62, 479-81. doi: 10.1126/science.286.5439.458. Science. 1999. PMID: 10521336 Review.
-
Non-Sciuromorph rodent karyotypes in evolution.Cytogenet Genome Res. 2012;137(2-4):233-45. doi: 10.1159/000339294. Epub 2012 Jun 12. Cytogenet Genome Res. 2012. PMID: 22699115 Review.
Cited by
-
Chromosome Changes in Soma and Germ Line: Heritability and Evolutionary Outcome.Genes (Basel). 2022 Mar 28;13(4):602. doi: 10.3390/genes13040602. Genes (Basel). 2022. PMID: 35456408 Free PMC article. Review.
-
Recurrent erosion of COA1/MITRAC15 exemplifies conditional gene dispensability in oxidative phosphorylation.Sci Rep. 2021 Dec 24;11(1):24437. doi: 10.1038/s41598-021-04077-y. Sci Rep. 2021. PMID: 34952909 Free PMC article.
-
Large-Scale Chromosomal Changes Lead to Genome-Level Expression Alterations, Environmental Adaptation, and Speciation in the Gayal (Bos frontalis).Mol Biol Evol. 2023 Jan 4;40(1):msad006. doi: 10.1093/molbev/msad006. Mol Biol Evol. 2023. PMID: 36625089 Free PMC article.
-
Chromosomics: Bridging the Gap between Genomes and Chromosomes.Genes (Basel). 2019 Aug 20;10(8):627. doi: 10.3390/genes10080627. Genes (Basel). 2019. PMID: 31434289 Free PMC article. Review.
-
Multiple and independent rearrangements revealed by comparative cytogenetic mapping in the dysploid Leptostachyus group (Phaseolus L., Leguminosae).Chromosome Res. 2020 Dec;28(3-4):395-405. doi: 10.1007/s10577-020-09644-z. Epub 2020 Nov 16. Chromosome Res. 2020. PMID: 33191473
References
-
- Bailey JA, Eichler EE. 2006. Primate segmental duplications: crucibles of evolution, diversity and disease. Nat Rev Genet. 7:552–564. - PubMed
Publication types
MeSH terms
LinkOut - more resources
Full Text Sources
Other Literature Sources
