

Natural antisense transcripts are significantly involved in regulation of drought stress in maize
- PMID: 28175341
- PMCID: PMC5435991
- DOI: 10.1093/nar/gkx085
Natural antisense transcripts are significantly involved in regulation of drought stress in maize
Abstract
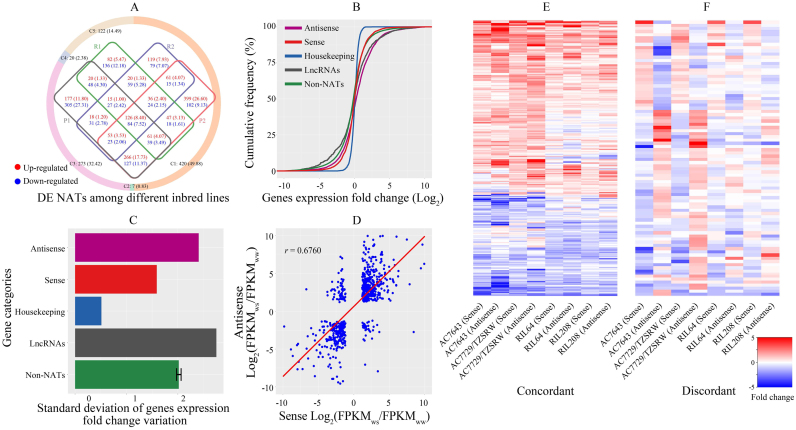
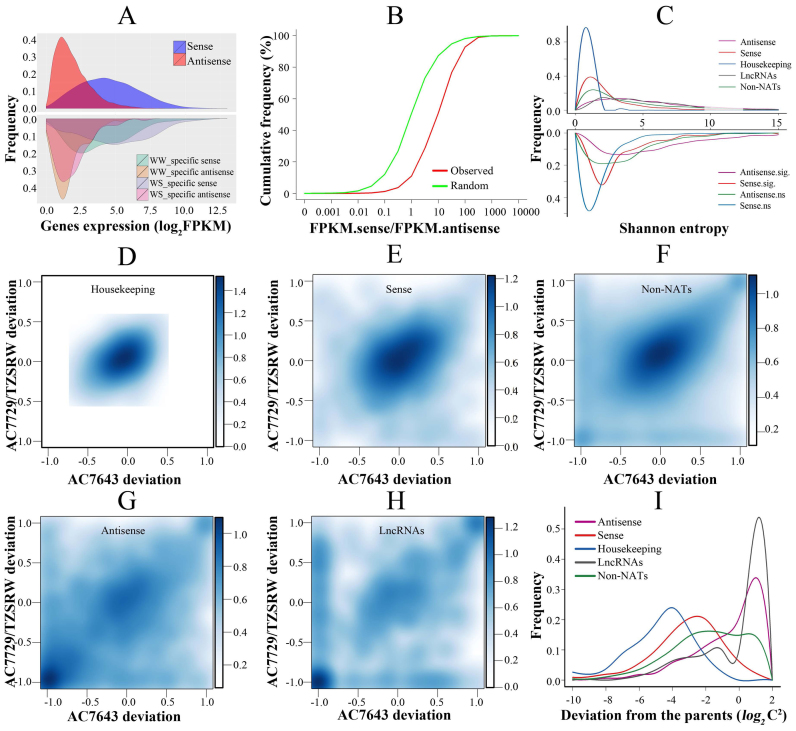
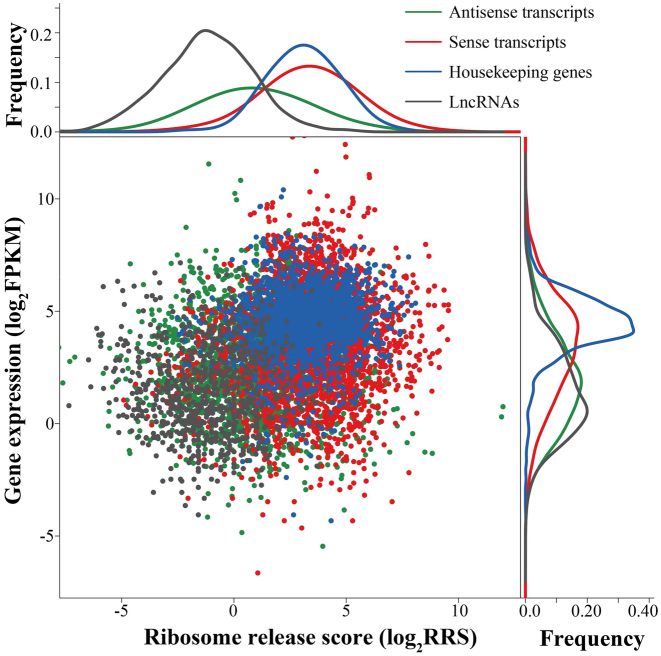
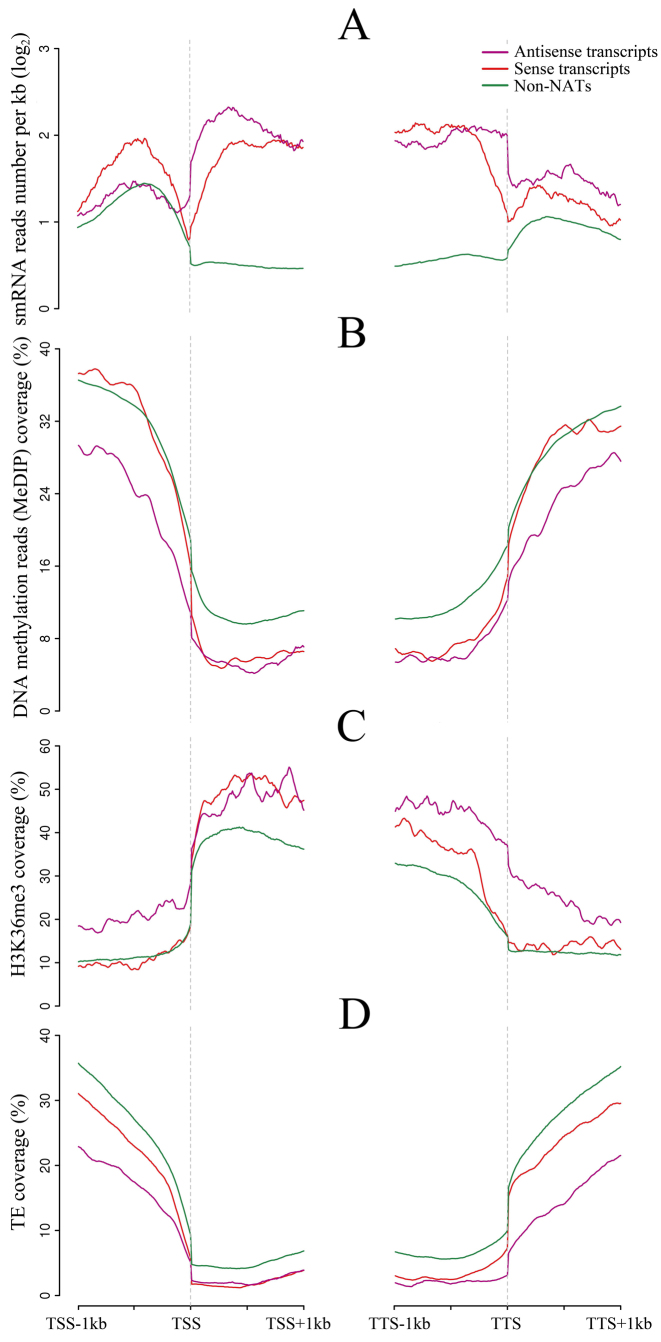
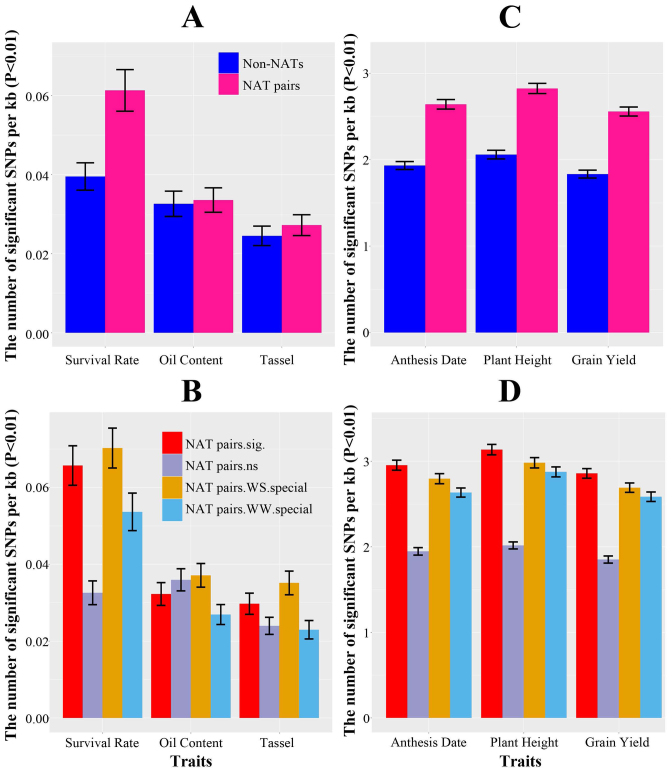
Natural antisense transcripts (NATs) are a prominent and complex class of regulatory RNAs. Using strand-specific RNA sequencing, we identified 1769 sense and antisense transcript pairs (NAT pairs) in two maize inbreds with different sensitivity to drought, as well as in two derivative recombination inbred lines (RILs). A significantly higher proportion of NATs relative to non-NATs are specifically expressed under water stress (WS). Surprisingly, expression of sense and antisense transcripts produced by NAT pairs is significantly correlated, particularly under WS. We found an unexpected large proportion of NATs with protein coding potential, as estimated by ribosome release scores. Small RNAs significantly accumulate within NAT pairs, with 21 nt smRNA particularly enriched in overlapping regions of these pairs of genes. The abundance of these smRNAs is significantly altered in the leafbladeless1 mutant, suggesting that these genes may be regulated by the tasiRNA pathway. Further, NATs are significantly hypomethylated and include fewer transposable element sequences relative to non-NAT genes. NAT gene regions also exhibit higher levels of H3K36me3, H3K9ac, and H3K4me3, but lower levels of H3K27me3, indicating that NAT gene pairs generally exhibit an open chromatin configuration. Finally, NAT pairs in 368 diverse maize inbreds and 19 segregating populations were specifically enriched for polymorphisms associated with drought tolerance. Taken together, the data highlight the potential impact of that small RNAs and histone modifications have in regulation of NAT expression, and the significance of NATs in response to WS.
© The Author(s) 2017. Published by Oxford University Press on behalf of Nucleic Acids Research.
Figures
Similar articles
-
Small RNAs and the regulation of cis-natural antisense transcripts in Arabidopsis.BMC Mol Biol. 2008 Jan 14;9:6. doi: 10.1186/1471-2199-9-6. BMC Mol Biol. 2008. PMID: 18194570 Free PMC article.
-
A natural antisense transcript acts as a negative regulator for the maize drought stress response gene ZmNAC48.J Exp Bot. 2021 Mar 29;72(7):2790-2806. doi: 10.1093/jxb/erab023. J Exp Bot. 2021. PMID: 33481006
-
Genome-wide view of natural antisense transcripts in Arabidopsis thaliana.DNA Res. 2015 Jun;22(3):233-43. doi: 10.1093/dnares/dsv008. Epub 2015 Apr 28. DNA Res. 2015. PMID: 25922535 Free PMC article.
-
Mechanisms of small RNA generation from cis-NATs in response to environmental and developmental cues.Mol Plant. 2013 May;6(3):704-15. doi: 10.1093/mp/sst051. Epub 2013 Mar 15. Mol Plant. 2013. PMID: 23505223 Free PMC article. Review.
-
Natural antisense transcripts regulate gene expression in an epigenetic manner.Biochem Biophys Res Commun. 2010 May 28;396(2):177-81. doi: 10.1016/j.bbrc.2010.04.147. Epub 2010 May 8. Biochem Biophys Res Commun. 2010. PMID: 20438699 Review.
Cited by
-
Coding and long non-coding RNAs provide evidence of distinct transcriptional reprogramming for two ecotypes of the extremophile plant Eutrema salsugineum undergoing water deficit stress.BMC Genomics. 2020 Jun 8;21(1):396. doi: 10.1186/s12864-020-06793-7. BMC Genomics. 2020. PMID: 32513102 Free PMC article.
-
NATpare: a pipeline for high-throughput prediction and functional analysis of nat-siRNAs.Nucleic Acids Res. 2020 Jul 9;48(12):6481-6490. doi: 10.1093/nar/gkaa448. Nucleic Acids Res. 2020. PMID: 32463462 Free PMC article.
-
Maize DNA Methylation in Response to Drought Stress Is Involved in Target Gene Expression and Alternative Splicing.Int J Mol Sci. 2021 Jul 31;22(15):8285. doi: 10.3390/ijms22158285. Int J Mol Sci. 2021. PMID: 34361051 Free PMC article.
-
Desiccation and supra-zero temperature storage of cat germinal vesicles lead to less structural damage and similar epigenetic alterations compared to cryopreservation.Mol Reprod Dev. 2019 Dec;86(12):1822-1831. doi: 10.1002/mrd.23276. Epub 2019 Sep 23. Mol Reprod Dev. 2019. PMID: 31549479 Free PMC article.
-
Identification and Functional Analysis of Drought-Responsive Long Noncoding RNAs in Maize Roots.Int J Mol Sci. 2023 Oct 10;24(20):15039. doi: 10.3390/ijms242015039. Int J Mol Sci. 2023. PMID: 37894720 Free PMC article.
References
MeSH terms
Substances
LinkOut - more resources
Full Text Sources
Other Literature Sources
Research Materials
