. 2017 Jun;188(3):394-411.
doi: 10.1111/cei.12940. Epub 2017 Mar 20.

Low-dose interleukin-2 promotes STAT-5 phosphorylation, Treg survival and CTLA-4-dependent function in autoimmune liver diseases

Affiliations

Low-dose interleukin-2 promotes STAT-5 phosphorylation, Treg survival and CTLA-4-dependent function in autoimmune liver diseases

H C Jeffery et al. Clin Exp Immunol. 2017 Jun.

Abstract

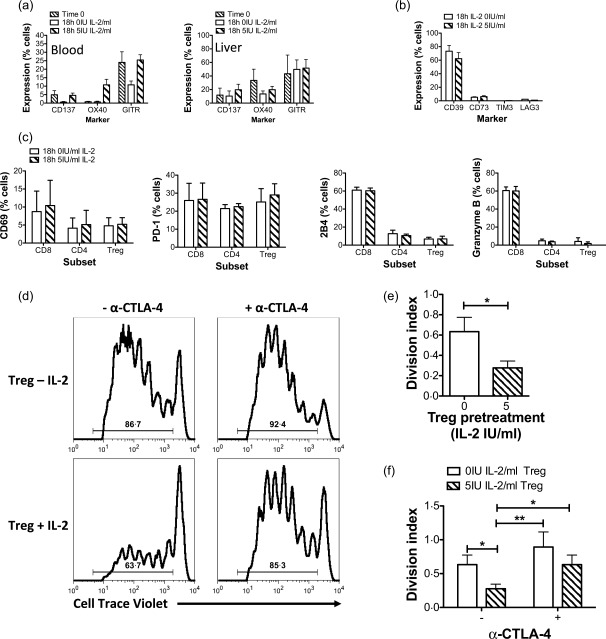
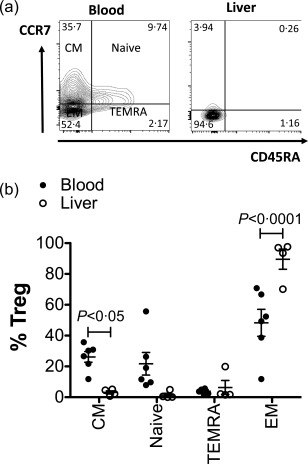
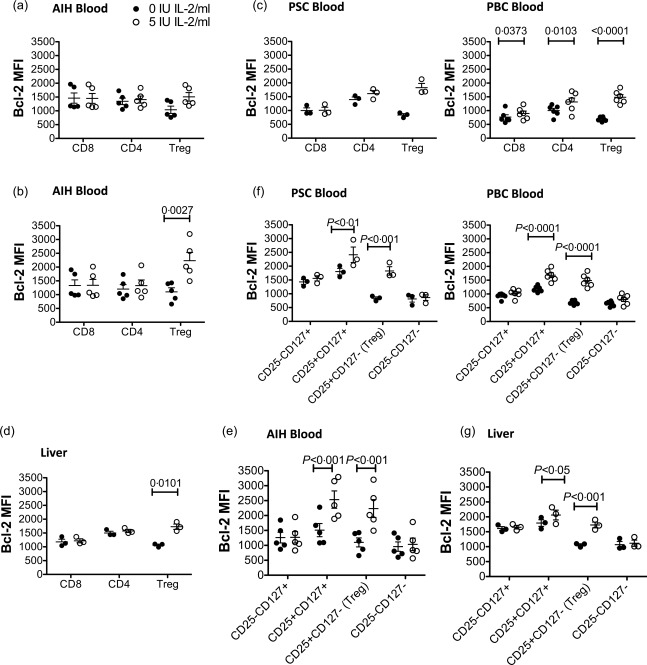
CD4+ CD25high CD127low forkhead box protein 3 (FoxP3+ ) regulatory T cells (Treg ) are essential for the maintenance of peripheral tolerance. Impaired Treg function and an imbalance between effector and Tregs contribute to the pathogenesis of autoimmune diseases. We reported recently that the hepatic microenvironment is deficient in interleukin (IL)-2, a cytokine essential for Treg survival and function. Consequently, few liver-infiltrating Treg demonstrate signal transducer and activator of transcription-5 (STAT-5) phosphorylation. To establish the potential of IL-2 to enhance Treg therapy, we investigated the effects of very low dose Proleukin (VLDP) on the phosphorylation of STAT-5 and the subsequent survival and function of Treg and T effector cells from the blood and livers of patients with autoimmune liver diseases. VLDP, at less than 5 IU/ml, resulted in selective phosphorylation of STAT-5 in Treg but not effector T cells or natural killer cells and associated with increased expression of cytotoxic T lymphocyte antigen-4 (CTLA-4), FoxP3 and CD25 and the anti-apoptotic protein Bcl-2 in Treg with the greatest enhancement of regulatory phenotype in the effector memory Treg population. VLDP also maintained expression of the liver-homing chemokine receptor CXCR3. VLDP enhanced Treg function in a CTLA-4-dependent manner. These findings open new avenues for future VLDP cytokine therapy alone or in combination with clinical grade Treg in autoimmune liver diseases, as VLDP could not only enhance regulatory phenotype and functional property but also the survival of intrahepatic Treg .

Keywords: Bcl-2; CTLA-4; STAT-5; autoimmune liver disease; interleukin-2; regulatory T cells.


Figures

Figure 1
Figure 1
Very low dose interleukin (IL)−2 up‐regulates phosphorylated signal transducer and activator of transcription‐5 (pSTAT‐5) selectively in peripheral and liver‐infiltrating regulatory T cells (Treg) from patients with autoimmune liver disease. Peripheral blood mononuclear cells (PBMCs) from control bloods (a, n = 3) or autoimmune liver disease patient bloods [b, autoimmune hepatitis (AIH) remission, n = 5; AIH relapse, = 4; primary biliary cholangitis (PBC), n = 3; and primary sclerosing cholangitis (PSC), n = 3] and liver‐infiltrating lymphocytes from explanted livers of patients with autoimmune liver disease (c, n = 4) were stimulated for 10 min with IL‐2 (Proleukin) at doses in the range 0–1000 IU/ml and the expression of p(Y694) STAT‐5 determined by flow cytometry for each leucocyte population. Graphs summarize pSTAT‐5 expression, quoted as percentage of positive cells or median fluorescence intensity (MFI). Data are mean ± standard error of the mean (s.e.m.).
Figure 2
Figure 2
Effect of very low dose interleukin (IL)−2 on expression of IL‐2‐regulated regulatory T cells (Treg) functional markers CD25, cytotoxic T lymphocyte antigen‐4 (CTLA‐4) and forkhead box protein 3 (FoxP3) by Treg cells from blood and liver. Peripheral blood mononuclear cells (PBMCs) from patients with autoimmune hepatitis (AIH) (n = 5), primary sclerosing cholangitis (PSC), (n = 3) and primary biliary cholangitis (PBC), n = 6) and liver‐infiltrating leucocytes from autoimmune liver diseases (AILD) livers were exposed to 0 or 5 IU/ml IL‐2 (Proleukin) for 18 h and the median fluorescence intensity of CD25, CTLA‐4 and FoxP3 examined by flow cytometry for (a) CD4, CD8 and Treg cells and (b) CD4 subsets defined by CD25 versus CD127 expression. Data are mean ± standard error of the mean (s.e.m.). Significant effects of IL‐2 analysed by paired t‐tests (a) and two‐way analysis of variance (anova) with Bonferroni's post‐hoc test (b) are shown.
Figure 3
Figure 3
(a–c) Effect of very low dose interleukin (IL)−2 on regulatory T cells (Treg) and T effector functional and activation phenotypes. Peripheral blood mononuclear cells (PBMCs) from patients with autoimmune hepatitis (AIH) and liver infiltrating leucocytes from autoimmune liver diseases (AILD) livers were exposed to 0 or 5 IU/ml IL‐2 (Proleukin) for 18 h and the expression of functional and activation markers by T cell subsets analysed by flow cytometry. (a) Expression of tumour necrosis factor (TNF) receptor superfamily members by blood and liver Treg. (b) Expression of CD39, CD73, T cell immunoglobulin and mucin domain‐containing‐3 (TIM3) and lymphocyte‐activation gene 3 (LAG3) by blood Treg. (C) Expression of CD69, programed death 1 (PD‐1), 2B4 and granzyme B by blood CD4, CD8 and Treg. Data are mean ± standard error of the mean (s.e.m.) for 2–6 donors. (d–f) Very low dose IL‐2 increases Treg suppressive ability in a mechanism involving cytotoxic T lymphocyte antigen‐4 (CTLA‐4). CD4+CD25+CD127 Treg and autologous CD4+CD25 T responder cells were isolated from PBMC of control individuals. T responders were labelled with cell trace violet and following overnight exposure of Treg to 0 or 5 IU/ml Proleukin were co‐cultured with the Treg in the presence of anti‐CD3 and dendritic cells, with or without CTLA‐4 blockade. Cell trace violet dilution indicating T responder cell division was analysed by flow cytometry at 5 days. (d) Representative flow cytometry histograms of T responder division showing percentage division. (e) Division index summary data (n = 3) of T responders in the presence of Treg pretreated with 0 or 5 IU/ml Proleukin. (f) Division index summary data (n = 3) of T responders in the presence of Treg pretreated with 0 or 5 IU/ml Proleukin with or without anti‐CTLA‐4. Data are mean ± standard error of the mean (s.e.m.). Significant effects of IL‐2 and CTLA‐4 blockade analysed by paired t‐tests (e) and one‐way analysis of variance (anova) with Bonferroni post‐hoc test (f) are shown.
Figure 4
Figure 4
Very low dose interleukin (IL)−2 does not down‐regulate liver‐homing CXCR3 receptor on regulatory T cells (Treg). (a) Peripheral blood mononuclear cells (PBMCs) were isolated from controls and autoimmune hepatitis (AIH) patients and Treg phenotyped for CXCR3 by flow cytometry ex vivo. (b,c) CXCR3 expression was measured in PBMC Treg from patients with AIH, primary sclerosing cholangitis (PSC) or primary biliary cholangitis (PBC) ex vivo and after culture for 18 h and/or 3 days in 5 IU/ml IL‐2 (Proleukin). Expression of CXCR3 by CD4+CD25+CD127 Treg of one representative donor from each disease cohort is shown in (b) and expression summarized for AIH, PSC donors and PBC donors in (c). Data are mean ± standard error of the mean (s.e.m.).
Figure 5
Figure 5
Low dose Proleukin treatment increases total regulatory T cell (Treg) frequencies and promotes the strongest Treg phenotype in the CD45RaCCR7 effector memory population of Treg. (a) Peripheral blood mononuclear cells (PBMCs) from controls, autoimmune hepatitis (AIH), primary sclerosing cholangitis (PSC) and primary biliary cholangitis (PBC) patients were exposed to 0 or 5 IU/ml IL‐2 (Proleukin) for 3 days and the frequency of CD4+CD25+CD127forkhead box protein 3 (FoxP3)+ Treg assessed by flow cytometry. Significant effects of IL‐2 were analysed by two‐way analysis of variance (anova) with Bonferroni's post‐hoc analysis. Frequencies of memory and naive subsets of CD4+CD25+CD127FoxP3+ Treg as defined by CD45Ra and CCR7 expression were also determined at 3 days by flow cytometry. (b) Representative flow cytometry density plot of CCR7 versus CD45Ra for one PSC donor after 3 days of culture in 0 or 5 IU/ml Proleukin and summary data for all donors (c). Significant effects of IL‐2 on the frequencies of the different memory/naive subsets were compared by two‐way anova with Bonferroni's post‐hoc analysis, but no significant differences were identified. (D) Expression of cytotoxic T lymphocyte antigen‐4 (CTLA‐4), CD25 and FoxP3 by each memory or naive subset of Treg. Data are mean ± standard error of the mean (s.e.m.) (control (n = 3), AIH (n = 4), PSC (n = 3) and PBC (n = 6), central memory (CM) (CD45RaCCR7+); naive (CD45Ra+CCR7+); terminally differentiated effector memory (TEMRA) (CD45Ra+CCR7); effector memory (EM) (CD45RaCCR7). Effects of 5 IU/ml Proleukin on the expression of these markers by each subset were analysed by two‐way anova with Bonferroni's post‐hoc tests. Stars indicate where there was a significant effect of IL‐2 upon the expression of the marker by the subset (*P < 0·05; **P < 0·01; ***P < 0·001; ****P < 0·0001). Braces with stated P‐values indicate significant differences in expression by the subsets under 5 IU/ml Proleukin conditions. With the exception of CTLA‐4 expression by naive versus EM cells in PSC patients, or of FoxP3 expression by CN versus naive, CM versus TEMRA or TEMRA versus effector memory in PBC patients, there were no significant differences between the subsets for expression of any marker in the absence of IL‐2 treatment.
Figure 6
Figure 6
Comparison of the frequencies of memory and naive regulatory T cell (Treg) populations in blood and liver. (a) Frequencies of memory and naive subsets of CD4+CD25+CD127 Treg as defined by CD45Ra and CCR7 expression were determined by flow cytometry for peripheral blood mononuclear cells (PBMCs) and liver infiltrating lymphocytes from patients with autoimmune liver diseases (AILD). (a) Representative flow cytometry density plot for expression of CD45Ra and CCR7 by blood and liver infiltrating Treg showing the four subsets including: central memory (CM) (CD45RaCCR7+); naive (CD45Ra+CCR7+); terminally differentiated effector memory (TEMRA) (CD45Ra+CCR7); effector memory (EM) (CD45RaCCR7). (b) Summary frequencies for each memory and naive subset in blood [n = 6 donors with autoimmune hepatitis (AIH)] and liver [n = 4 donors with AILDs including primary sclerosing cholangitis (PSC) and primary biliary cholangitis (PBC)]. Data are mean ± standard error of the mean (s.e.m.). Significance was tested by non‐matched two‐way analysis of variance (anova) and showed significant interaction for subset versus tissue P < 0·0001. Bonferroni's post‐hoc tests identified significant differences between blood and liver in the frequencies of CM and EM cells, as indicated. There was no significant effect of tissue on subset distribution but there was a significant effect of subset P < 0·0001.
Figure 7
Figure 7
Very low dose interleukin (IL)‐2 up‐regulates Bcl‐2 expression in regulatory T cells (Treg) from blood and liver. Peripheral blood mononuclear cells (PBMCs) from autoimmune hepatitis (AIH) patients (a,b,e), primary sclerosing cholangitis (PSC) patients (c,f), primary biliary cholangitis (PBC) patients (c,f) and liver‐infiltrating lymphocytes from autoimmune liver diseases (AILD) livers (d,g) were exposed to 0 or 5 IU/ml IL‐2 (Proleukin) for 18 h (a) or 3 days (b–g) and the median fluorescence intensity (MFI) of Bcl‐2 on CD4, CD8 and Treg examined by flow cytometry (a–d). (E–G) Day 3 Bcl‐2 expression by blood (e,f) and liver (g) CD4+ T cell subsets defined by CD25 versus CD127 expression. Data are mean ± standard error of the mean (s.e.m.). Significant effects of IL‐2 were assessed by paired t‐tests (a–d) and two‐way analysis of variance (anova) (e–g).

Similar articles

Cited by

References

    1. Sakaguchi S, Sakaguchi N, Asano M, Itoh M, Toda M. Immunologic self‐tolerance maintained by activated T cells expressing IL‐2 receptor alpha‐chains (CD25). Breakdown of a single mechanism of self‐tolerance causes various autoimmune diseases. J Immunol 1995; 155:1151–64. - PubMed
    1. Liu W, Putnam AL, Xu‐Yu Z et al CD127 expression inversely correlates with FoxP3 and suppressive function of human CD4+ Treg cells. J Exp Med 2006; 203:1701–11. - PMC - PubMed
    1. Sebode M, Peiseler M, Franke B et al Reduced FOXP3(+) regulatory T cells in patients with primary sclerosing cholangitis are associated with IL2RA gene polymorphisms. J Hepatol 2014; 60:1010–6. - PubMed
    1. Chen YY, Jeffery HC, Hunter S et al Human intrahepatic Tregs are functional, require IL‐2 from effector cells for survival and are susceptible to Fas ligand mediated apoptosis. Hepatology 2016; 64:138–50. - PMC - PubMed
    1. Lan RY, Cheng C, Lian ZX et al Liver‐targeted and peripheral blood alterations of regulatory T cells in primary biliary cirrhosis. Hepatology 2006; 43:729–37. - PubMed

Publication types

MeSH terms