Morphological and Microstructural Changes of the Hippocampus in Early MCI: A Study Utilizing the Alzheimer's Disease Neuroimaging Initiative Database
- PMID: 28176504
- PMCID: PMC5392456
- DOI: 10.3988/jcn.2017.13.2.144
Morphological and Microstructural Changes of the Hippocampus in Early MCI: A Study Utilizing the Alzheimer's Disease Neuroimaging Initiative Database
Abstract
Background and purpose: With the aim of facilitating the early detection of Alzheimer's disease, the Alzheimer's Disease Neuroimaging Initiative proposed two stages based on the memory performance: early mild cognitive impairment (EMCI) and late mild cognitive impairment (LMCI). The current study was designed to investigate structural differences in terms of surface atrophy and microstructural changes of the hippocampus in EMCI and LMCI.
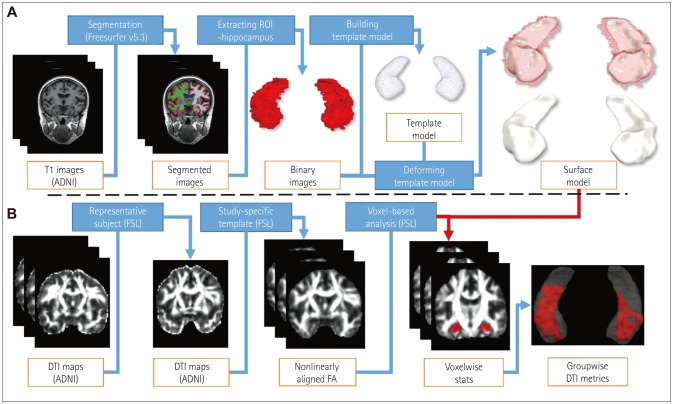
Methods: Hippocampal shape modeling based on progressive template surface deformation was performed on T1-weighted MRI images obtained from 20 cognitive normal (CN) subjects, 17 EMCI patients, and 20 LMCI patients. A template surface in CN was used as a region of interest for diffusion-tensor imaging (DTI) voxel-based morphometry (VBM) analysis. Cluster-wise group comparison was performed based on DTI indices within the hippocampus. Linear regression was performed to identify correlations between DTI metrics and clinical scores.
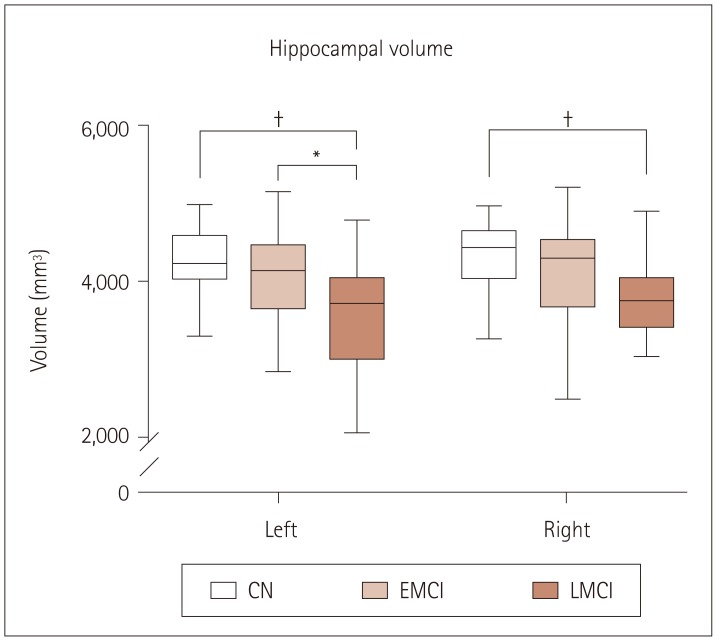
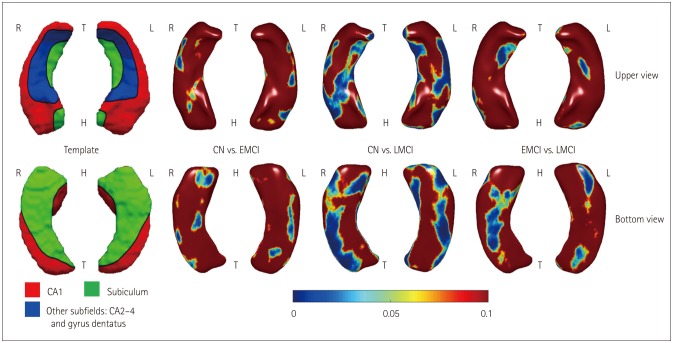
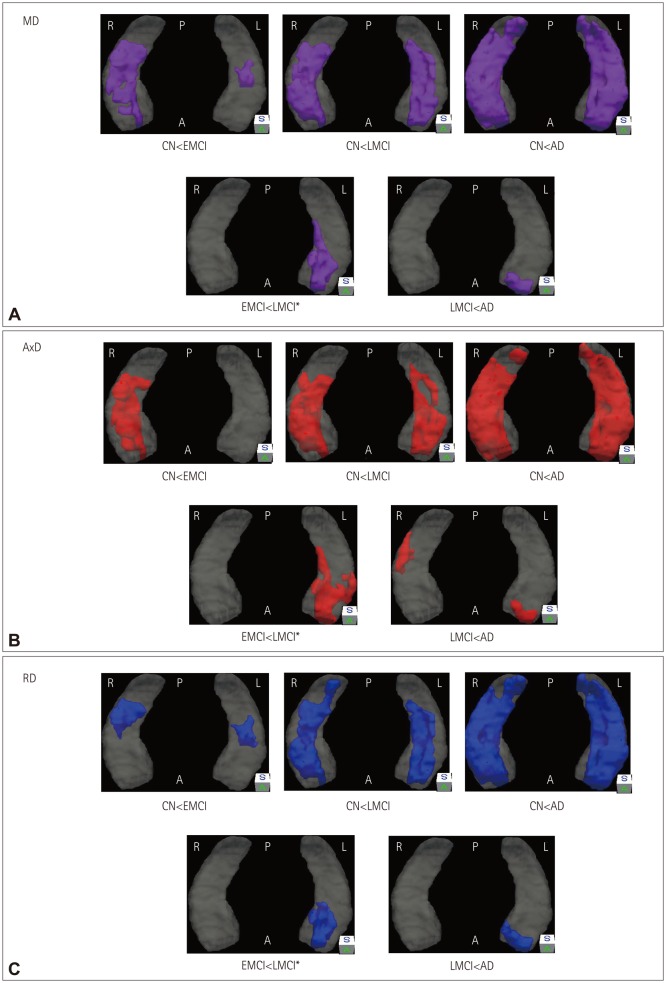
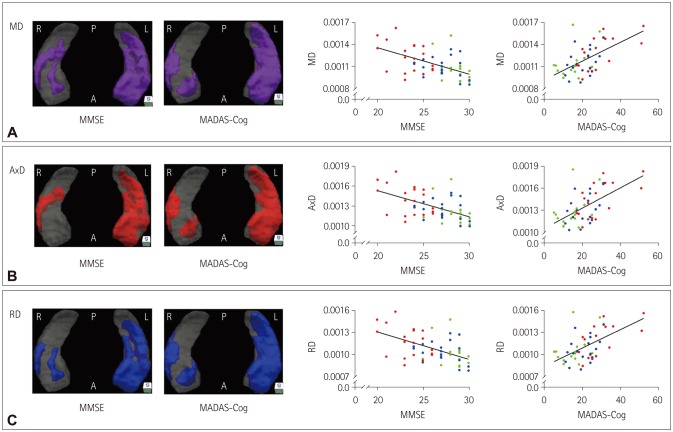
Results: The hippocampal surface analysis showed significant atrophies in bilateral CA1 regions and the right ventral subiculum in EMCI, in contrast to widespread atrophy in LMCI. DTI VBM analysis showed increased diffusivity in the CA2-CA4 regions in EMCI and additionally in the subiculum region in LMCI. Hippocampal diffusivity was significantly correlated with scores both for the Mini Mental State Examination and on the Modified Alzheimer Disease Assessment Scale cognitive subscale. However, the hippocampal diffusivity did not vary significantly with the fractional anisotropy.
Conclusions: EMCI showed hippocampal surface changes mainly in the CA1 region and ventral subiculum. Diffusivity increased mainly in the CA2-CA4 regions in EMCI, while it decreased throughout the hippocampus in LMCI. Although axial diffusivity showed prominent changes in the right hippocampus in EMCI, future studies need to confirm the presence of this laterality difference. In addition, diffusivity is strongly correlated with the cognitive performance, indicating the possibility of using diffusivity as a biomarker for disease progression.
Keywords: Alzheimer's disease; biomarkers; diffusion-tensor imaging; hippocampus; magnetic resonance imaging; mild cognitive impairment.
Copyright © 2017 Korean Neurological Association
Conflict of interest statement
The authors have no financial conflicts of interest.
Figures
Similar articles
-
Altered amplitude of low-frequency fluctuations in early and late mild cognitive impairment and Alzheimer's disease.Curr Alzheimer Res. 2014 May;11(4):389-98. doi: 10.2174/1567205011666140331225335. Curr Alzheimer Res. 2014. PMID: 24720892
-
The structural MRI markers and cognitive decline in prodromal Alzheimer's disease: a 2-year longitudinal study.Quant Imaging Med Surg. 2018 Nov;8(10):1004-1019. doi: 10.21037/qims.2018.10.08. Quant Imaging Med Surg. 2018. PMID: 30598878 Free PMC article.
-
Distinguishing Early from Late Mild Cognitive Impairment Using Magnetic Resonance Free-Water Diffusion Tensor Imaging.NeuroSci. 2025 Jan 18;6(1):8. doi: 10.3390/neurosci6010008. NeuroSci. 2025. PMID: 39846567 Free PMC article.
-
Diffusion tensor imaging of the hippocampus in MCI and early Alzheimer's disease.J Alzheimers Dis. 2011;26 Suppl 3:257-62. doi: 10.3233/JAD-2011-0001. J Alzheimers Dis. 2011. PMID: 21971465 Review.
-
The role of diffusion tensor imaging and fractional anisotropy in the evaluation of patients with idiopathic normal pressure hydrocephalus: a literature review.Neurosurg Focus. 2016 Sep;41(3):E12. doi: 10.3171/2016.6.FOCUS16192. Neurosurg Focus. 2016. PMID: 27581308 Review.
Cited by
-
A probabilistic atlas of locus coeruleus pathways to transentorhinal cortex for connectome imaging in Alzheimer's disease.Neuroimage. 2020 Dec;223:117301. doi: 10.1016/j.neuroimage.2020.117301. Epub 2020 Aug 28. Neuroimage. 2020. PMID: 32861791 Free PMC article.
-
Anisotropy of Anomalous Diffusion Improves the Accuracy of Differentiating and Grading Alzheimer's Disease Using Novel Fractional Motion Model.Front Aging Neurosci. 2020 Nov 19;12:602510. doi: 10.3389/fnagi.2020.602510. eCollection 2020. Front Aging Neurosci. 2020. PMID: 33328977 Free PMC article.
-
Enhancing the early detection of Alzheimer's disease using an integrated CNN-LSTM framework: A robust approach for fMRI-based multi-stage classification.PLoS One. 2025 Aug 26;20(8):e0317968. doi: 10.1371/journal.pone.0317968. eCollection 2025. PLoS One. 2025. PMID: 40857304 Free PMC article.
-
MRI Asymmetry Index of Hippocampal Subfields Increases Through the Continuum From the Mild Cognitive Impairment to the Alzheimer's Disease.Front Neurosci. 2018 Aug 21;12:576. doi: 10.3389/fnins.2018.00576. eCollection 2018. Front Neurosci. 2018. PMID: 30186103 Free PMC article.
-
Systems modeling of white matter microstructural abnormalities in Alzheimer's disease.Neuroimage Clin. 2020;26:102203. doi: 10.1016/j.nicl.2020.102203. Epub 2020 Feb 4. Neuroimage Clin. 2020. PMID: 32062565 Free PMC article.
References
Grants and funding
LinkOut - more resources
Full Text Sources
Other Literature Sources
Miscellaneous