. 2017 Feb 8:8:14419.
doi: 10.1038/ncomms14419.

Foxn1-β5t transcriptional axis controls CD8+ T-cell production in the thymus

Affiliations

Foxn1-β5t transcriptional axis controls CD8+ T-cell production in the thymus

Muhammad Myn Uddin et al. Nat Commun. .

Abstract

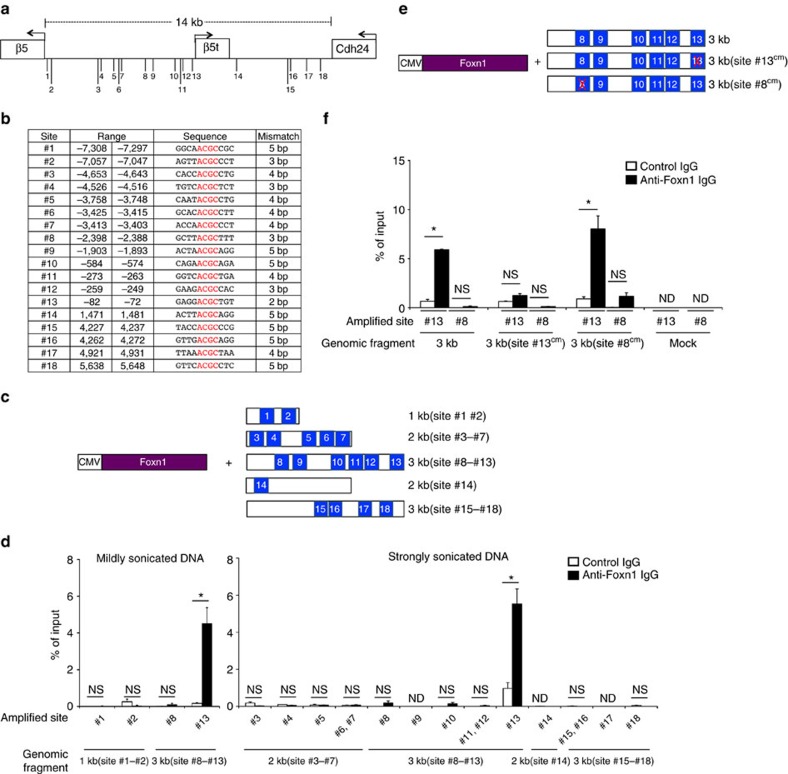
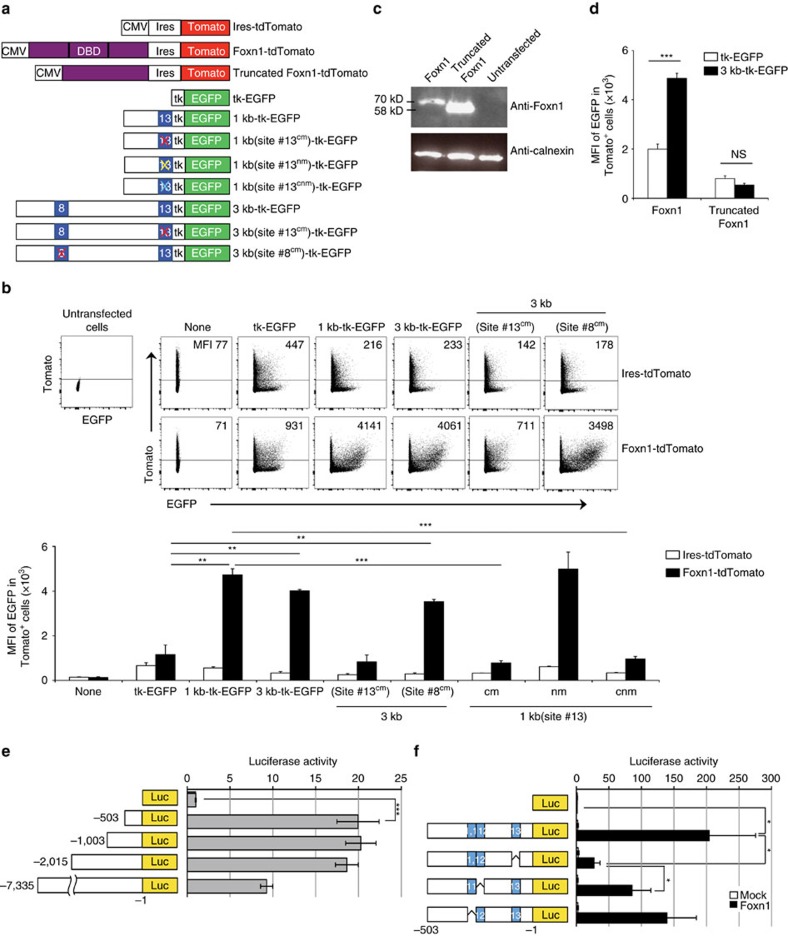
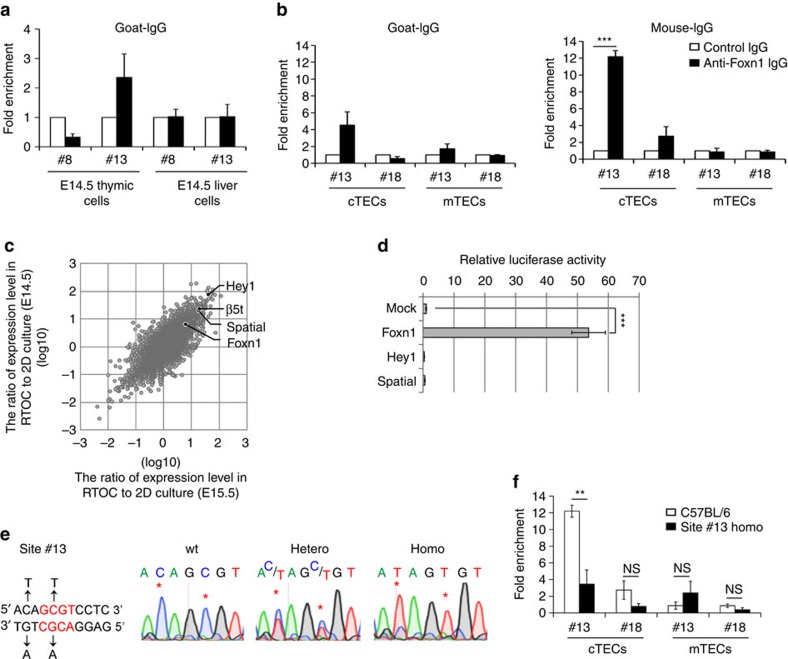
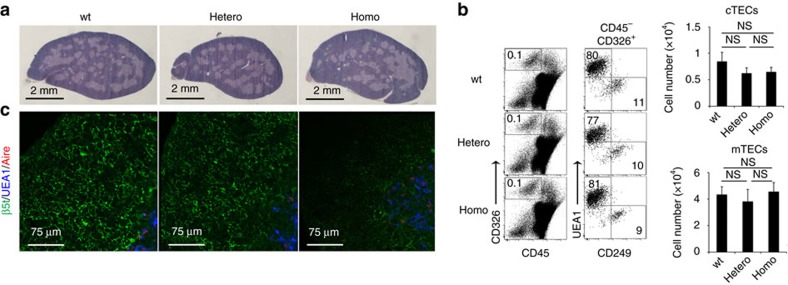
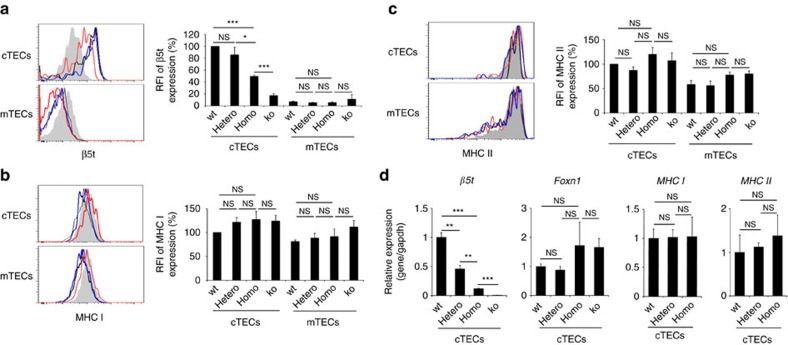
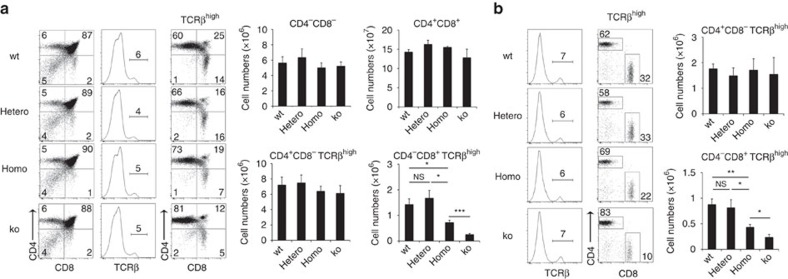
The thymus is an organ that produces functionally competent T cells that protect us from pathogens and malignancies. Foxn1 is a transcription factor that is essential for thymus organogenesis; however, the direct target for Foxn1 to actuate thymic T-cell production is unknown. Here we show that a Foxn1-binding cis-regulatory element promotes the transcription of β5t, which has an essential role in cortical thymic epithelial cells to induce positive selection of functionally competent CD8+ T cells. A point mutation in this genome element results in a defect in β5t expression and CD8+ T-cell production in mice. The results reveal a Foxn1-β5t transcriptional axis that governs CD8+ T-cell production in the thymus.


Conflict of interest statement

The authors declare no competing financial interests.

Figures

Figure 1
Figure 1. Foxn1 binds to β5t-proximal site #13.
(a) Schematic diagram of the locations of 18 sites that contain the Foxn1-binding invariant core ACGC tetranucleotide within the 14-kb region proximal to β5t-encoding gene between two neighbouring genes in the mouse genome. Arrows indicate the orientation of the transcription. (b) Distances of the 18 sites from β5t translation initiation site are listed. The nucleotide sequences of those sites and their mismatches from the Foxn1-binding consensus 11-bp sequence previously reported are also listed. (c,d) HEK293T cells were transfected with a vector that expressed Foxn1 and a plasmid that contained mouse genomic DNA fragment proximal to β5t-encoding gene, as illustrated schematically (c). Forty-eight hours after the transfection, formaldehyde-fixed cell lysates that contained protein–DNA complexes were immunoprecipitated with either goat anti-Foxn1 antibody (filled bars) or control IgG (open bars) and PCR-amplified for the indicated candidate sites of the Foxn1-binding sequences. Graphs show the frequency of immunoprecipitated DNA in input DNA (mean±s.e.m., n=5), which was sonicated at mild or strong amplitude (d). *P<0.05; NS, not significant; ND, not detectable. (e,f) A plasmid that contained the 3 kb DNA fragment upstream of β5t-encoding gene or its variants mutating at the indicated site was used for immunoprecipitation (e). A control plasmid that contained no genomic DNA fragment was used where indicated (mock). Graphs show the frequency of immunoprecipitated DNA in input DNA (mean±s.e.m., n=3) (f). *P<0.05; NS, not significant; ND, not detectable. All statistical analyses were performed by student's t-test.
Figure 2
Figure 2. Foxn1 binding to site #13 enhances transcription of proximal gene.
(a) HEK293T cells were transfected with a plasmid that co-expressed Foxn1 protein and tdTomato red fluorescence protein and a plasmid that contained the EGFP green fluorescence protein reporter sequence attached to the herpes simplex virus thymidine kinase gene promoter (HSV-tk) and a variety of the mouse genomic sequence 5′ to β5t-encoding gene as indicated. Site #13 cm, a point mutation in the core sequence of site #13; site #13 nm, a point mutation in the non-core sequence of site #13; site #13 cnm, a mutation in both core and non-core sequence of site #13. (b) Dot plots show the expression of Tomato and EGFP in propidium iodide (PI)-negative viable HEK293T cells co-transfected with indicated EGFP reporter vectors and ires-tdTomato-expressing plasmid (upper profiles) or Foxn1-ires-tdTomato plasmid (lower profiles). Numbers in dot plots indicate mean fluorescence intensity (MFI) of EGFP expression in tdTomato+ PI- cells. Bar graphs show MFI (means±s.e.m., n=3) of EGFP expression in Tomato+ PI- cells. **P<0.01; ***P<0.001. See also Supplementary Fig. 2a. (c) Immunoblot analysis of Foxn1 protein or mutant Foxn1 protein without the DNA-binding domain (DBD). Calnexin was examined as the loading control. (d) HEK293T cells were co-transfected with indicated plasmids. EGFP reporter expression was measured as in b. ***P<0.005; n.s., not significant. (e) HEK293T cells were transfected with a series of luciferase reporter constructs that contained indicated lengths of the β5t 5′ genomic region, together with a Foxn1-encoding plasmid. Histograms represent relative luciferase activity, where the activity without genomic sequences was set as 1. Means±s.d. (n=3) are shown. ***P<0.005. (f) Luciferase reporter constructs that lacked site #11, #12 or #13 were tested. Means±s.d. (n=3) are shown. *P<0.05. All statistical analyses were performed by student's t-test.
Figure 3
Figure 3. Generation of site #13 mutant mice.
(a) Thymuses and livers isolated from E14.5 embryos were liberase-digested. Protein–DNA complexes were immunoprecipitated with goat anti-Foxn1 antibody (filled bars) or control IgG (open bars) and PCR-amplified for site #8 or site #13. Graph shows fold enrichment (means±s.e.m., n=9) of anti-Foxn1-precipitated signals normalized to the signals by control IgG. (b) CD45CD326+UEA1CD249+ cTECs and CD45CD326+UEA1+CD249 mTECs were isolated from 2-week-old C57BL/6 mice. Protein–DNA complexes were immunoprecipitated with anti-Foxn1 antibody (filled bars) or control IgG (open bars) and PCR-amplified for site #13 or site #18. Graph shows fold enrichment (means±s.e.m., n=3) of anti-Foxn1-precipitated signals normalized to the signals by control IgG. ***P<0.001. (c) Comparison of gene expression profiles between RTOC and 2D culture of thymic stromal cells from E14.5 and E15.5 mice by microarray analysis. Grey dots represent ratios (log scale) of gene expression levels (33,749 transcripts) in the two culture conditions. Longitudinal and horizontal axes show the ratios in E14.5 and E15.5 thymic stromal cells, respectively. (d) A plasmid encoding Foxn1, Hey1 or Spatial was transfected into HEK293T cells together with a firefly luciferase that contained the 7-kb β5t 5′-flanking region and a control plasmid encoding Renilla luciferase. Intensities of firefly and Renilla luciferase activities were measured 48 h after transfection. Histograms represent relative luciferase activity, where the activity in mock transfection was set as 1. All data are shown as means±s.d. (n=3). ***P<0.005. (e) Mutant mice carrying the mutation in site #13 proximal to β5t-encoding gene were generated by the CRISPR/Cas9-mediated genome editing technology. The 2-bp mutation at site #13 (left) was confirmed in wild-type (wt), heterozygous, and homozygous mutant mice (right). (f) cTECs and mTECs were isolated from 2-week-old site #13 homozygous mutant mice. Graph shows fold enrichment (means±s.e.m., n=3) of mouse monoclonal anti-Foxn1-precipitated signals normalized to the signals by control IgG (filled bars) and comparison to the value in TECs isolated from C57BL/6 mice (open bars) as shown in b. **P<0.01; NS, not significant. All statistical analyses were performed by student's t-test.
Figure 4
Figure 4. Diminished β5t expression in thymus of site #13 mutant mice.
(a) Haematoxylin and eosin staining of thymic sections from 2-week-old mice. Representative data from three independent experiments are shown. Scale bar, 2 mm. (b) Flow cytometric analysis of liberase-digested thymic cells isolated from 2-week-old mice. Dot plots show CD326 and CD45 expression in total thymic cells (left), and UEA-1 reactivity and CD249 expression in CD45CD326+-gated epithelial cells (middle). Bar graphs show cell number (means±s.e.m., n=4) of CD45CD326+UEA1CD249+ cTECs and CD45CD326+UEA1+ CD249 mTECs. NS, not significant. Statistical analyses were performed by student's t-test. (c) Immunofluorescence analysis of β5t (green), Aire (red) and UEA-1-binding molecules (blue) in thymic sections from 2-week-old mice. Representative data from three independent experiments are shown. Scale bar, 75 μm.
Figure 5
Figure 5. Diminished β5t expression in cTECs of site #13 mutant mice.
(ac) Histograms show the expression of β5t (a), MHC class I (b) and MHC class II (c) in cTECs and mTECs of wild-type (black lines), heterozygous mutant (blue lines), homozygous mutant (red lines) and β5t-deficient (grey shades) mice at 2 weeks old. Bar graphs show the relative fluorescence intensity (RFI, n=4) of β5t (a), MHC class I (b), and MHC class II (c) expression normalized to the mean fluorescence intensity measured in wild-type cells. *P<0.05; ***P<0.001; NS, not significant. See also Supplementary Fig. 2b. (d) Relative mRNA levels (means±s.e.m., n=3) of β5t, Foxn1, MHC I and MHC II in cTECs isolated from 2-week-old mice were measured by quantitative reverse transcription–PCR. mRNA levels were normalized to those of Gapdh mRNA levels and are shown relative to the levels in wild-type cTECs. **P<0.01; ***P<0.001. All statistical analyses were performed by student's t-test.
Figure 6
Figure 6. Defective CD8+ T cell production in site #13 mutant mice.
(a) Flow cytometric analysis of thymocytes from 2-week-old mice. Shown are dot plots for CD8 and CD4 expression (left) and TCRβ expression (middle) in PI- viable cells and dot plots for CD8 and CD4 expression in PI- TCRβhigh cells (right). Bar graphs show cell numbers (means±s.e.m., n=4–6) of indicated thymocyte populations. (b) Flow cytometric analysis of splenocytes from 2-week-old mice. Histograms show TCRβ expression in PI- viable cells. Dot plots show CD8 and CD4 expression in PI- TCRβhigh cells. Bar graphs show numbers (means±s.e.m., n=4–6) of CD4+CD8TCRβhigh T cells and CD4CD8+TCRβhigh T cells. Numbers in dot plots and histograms indicate frequency of cells within indicated area. *P<0.05; **P<0.01; ***P<0.001; NS, not significant. Statistical analyses were performed by student's t-test. See also Supplementary Fig. 2c,d.

References

    1. Doherty P. C. & Christensen J. P. Accessing complexity: the dynamics of virus-specific T cell responses. Annu. Rev. Immunol. 18, 561–592 (2000). - PubMed
    1. Wong P. & Pamer E. G. CD8 T cell responses to infectious pathogens. Annu. Rev. Immunol. 21, 29–70 (2003). - PubMed
    1. Appay V., Douek D. C. & Price D. A. CD8+ T cell efficacy in vaccination and disease. Nat. Med. 14, 623–628 (2008). - PubMed
    1. Fink P. J. & Bevan M. J. Positive selection of thymocytes. Adv. Immunol. 59, 99–133 (1995). - PubMed
    1. Klein L., Kyewski B., Allen P. M. & Hogquist K. A. Positive and negative selection of the T cell repertoire: what thymocytes see (and don't see). Nat. Rev. Immunol. 14, 377–391 (2014). - PMC - PubMed

Publication types

MeSH terms

Substances

LinkOut - more resources