

Soil networks become more connected and take up more carbon as nature restoration progresses
- PMID: 28176768
- PMCID: PMC5309817
- DOI: 10.1038/ncomms14349
Soil networks become more connected and take up more carbon as nature restoration progresses
Abstract
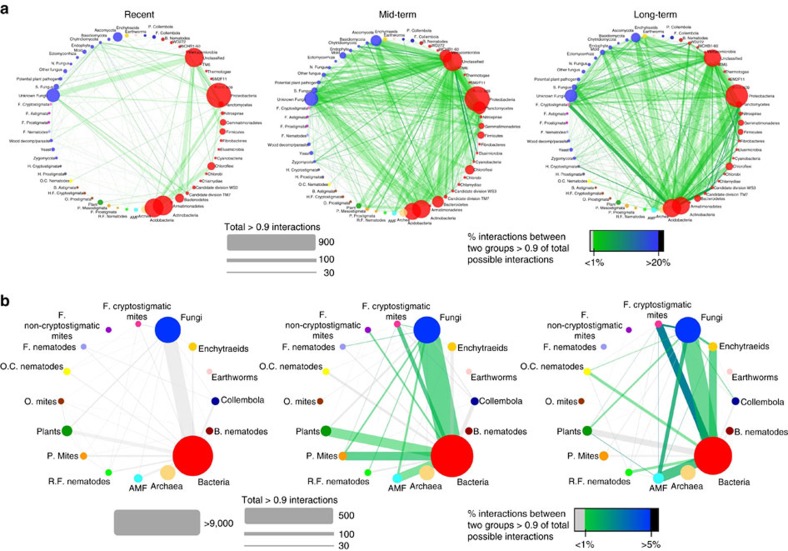
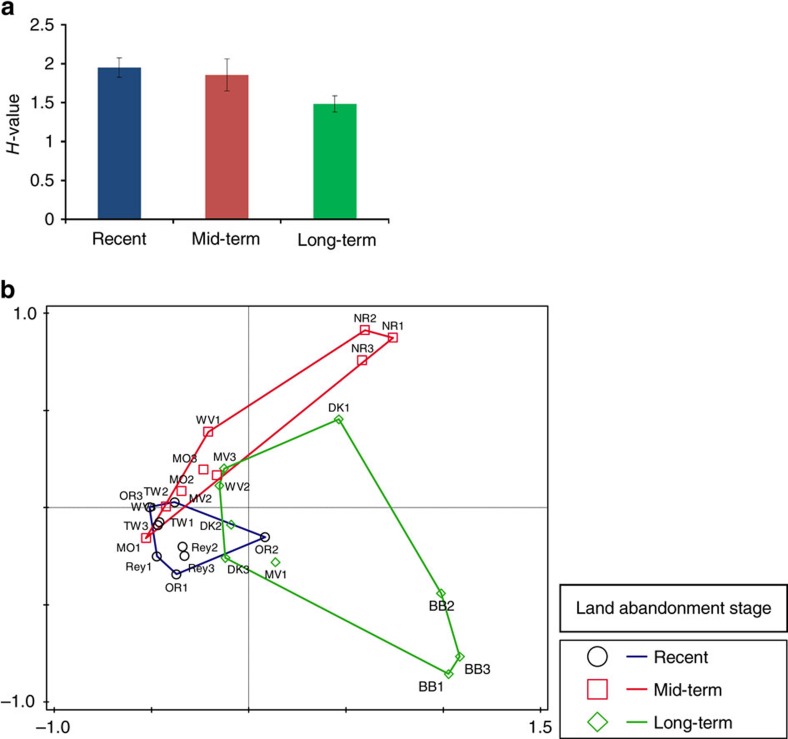
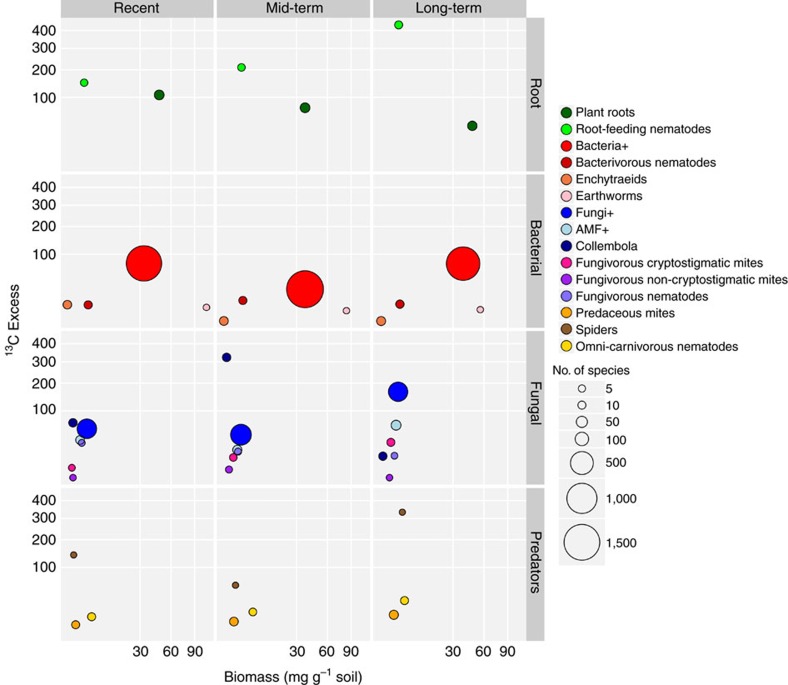
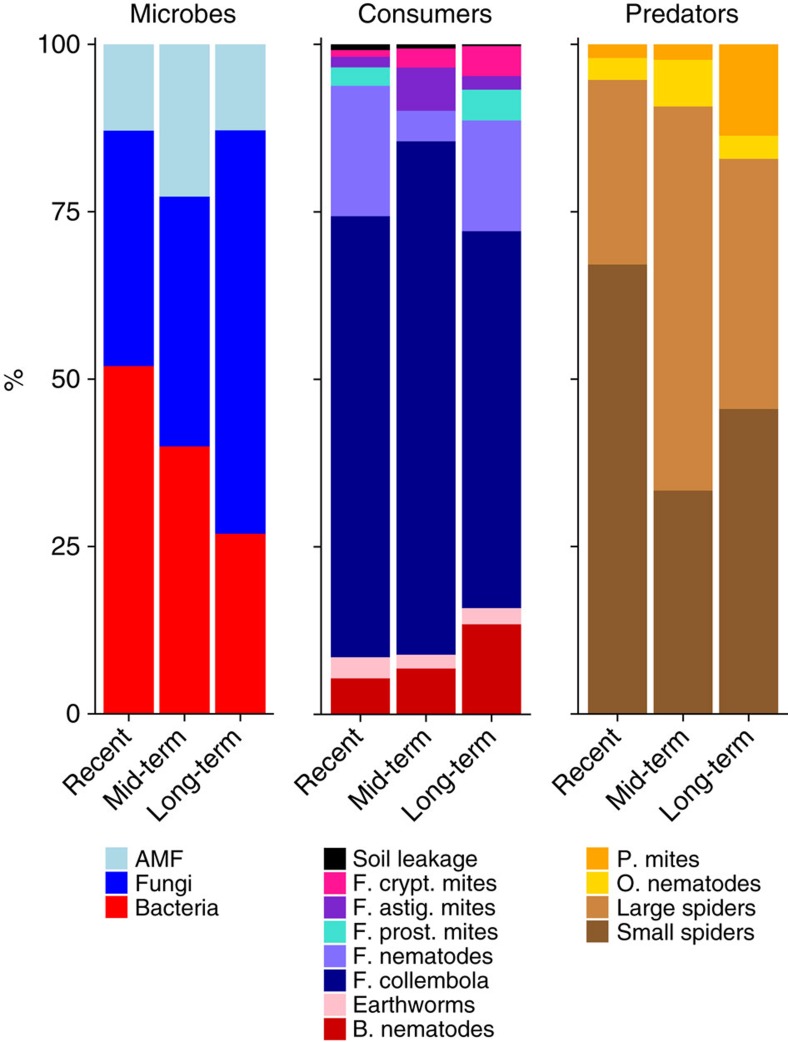
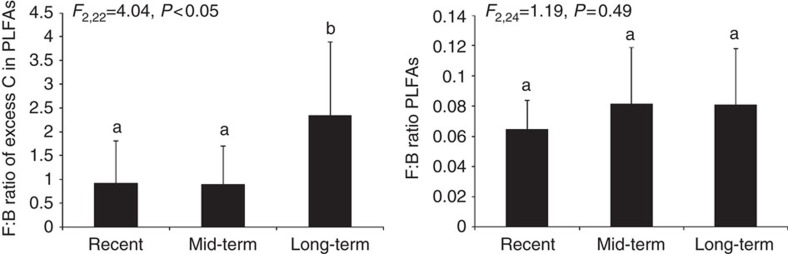
Soil organisms have an important role in aboveground community dynamics and ecosystem functioning in terrestrial ecosystems. However, most studies have considered soil biota as a black box or focussed on specific groups, whereas little is known about entire soil networks. Here we show that during the course of nature restoration on abandoned arable land a compositional shift in soil biota, preceded by tightening of the belowground networks, corresponds with enhanced efficiency of carbon uptake. In mid- and long-term abandoned field soil, carbon uptake by fungi increases without an increase in fungal biomass or shift in bacterial-to-fungal ratio. The implication of our findings is that during nature restoration the efficiency of nutrient cycling and carbon uptake can increase by a shift in fungal composition and/or fungal activity. Therefore, we propose that relationships between soil food web structure and carbon cycling in soils need to be reconsidered.
Conflict of interest statement
The authors declare no competing financial interests.
Figures
Similar articles
-
The soil biota composition along a progressive succession of secondary vegetation in a karst area.PLoS One. 2014 Nov 7;9(11):e112436. doi: 10.1371/journal.pone.0112436. eCollection 2014. PLoS One. 2014. PMID: 25379741 Free PMC article.
-
Impacts of altered precipitation regimes on soil communities and biogeochemistry in arid and semi-arid ecosystems.Glob Chang Biol. 2015 Apr;21(4):1407-21. doi: 10.1111/gcb.12789. Epub 2014 Dec 5. Glob Chang Biol. 2015. PMID: 25363193 Review.
-
Community diversity, structure and carbon footprint of nematode food web following reforestation on degraded Karst soil.Sci Rep. 2016 Jun 17;6:28138. doi: 10.1038/srep28138. Sci Rep. 2016. PMID: 27311984 Free PMC article.
-
Dynamics of soil biota and nutrients at varied depths in a Tamarix ramosissima-dominated natural desert ecosystem: Implications for nutrient cycling and desertification management.J Environ Manage. 2024 Mar;354:120217. doi: 10.1016/j.jenvman.2024.120217. Epub 2024 Feb 9. J Environ Manage. 2024. PMID: 38340666
-
Forest Soil Bacteria: Diversity, Involvement in Ecosystem Processes, and Response to Global Change.Microbiol Mol Biol Rev. 2017 Apr 12;81(2):e00063-16. doi: 10.1128/MMBR.00063-16. Print 2017 Jun. Microbiol Mol Biol Rev. 2017. PMID: 28404790 Free PMC article. Review.
Cited by
-
Comparison of assembly process and co-occurrence pattern between planktonic and benthic microbial communities in the Bohai Sea.Front Microbiol. 2022 Sep 29;13:1003623. doi: 10.3389/fmicb.2022.1003623. eCollection 2022. Front Microbiol. 2022. PMID: 36386657 Free PMC article.
-
Soil Fungal Community Structure in Boreal Pine Forests: From Southern to Subarctic Areas of Finland.Front Microbiol. 2021 May 26;12:653896. doi: 10.3389/fmicb.2021.653896. eCollection 2021. Front Microbiol. 2021. PMID: 34122368 Free PMC article.
-
Functional Associations and Resilience in Microbial Communities.Microorganisms. 2020 Jun 24;8(6):951. doi: 10.3390/microorganisms8060951. Microorganisms. 2020. PMID: 32599781 Free PMC article.
-
Experimental Testing of Dispersal Limitation in Soil Bacterial Communities with a Propagule Addition Approach.Microb Ecol. 2019 May;77(4):905-912. doi: 10.1007/s00248-018-1284-z. Epub 2018 Nov 12. Microb Ecol. 2019. PMID: 30417222
-
Consistent Plant and Microbe Nutrient Limitation Patterns During Natural Vegetation Restoration.Front Plant Sci. 2022 May 19;13:885984. doi: 10.3389/fpls.2022.885984. eCollection 2022. Front Plant Sci. 2022. PMID: 35665177 Free PMC article.
References
-
- Vitousek P. M., Mooney H. A., Lubchenco J. & Melillo J. M. Human domination of Earth's ecosystems. Science 277, 494–499 (1997).
-
- Tilman D., Cassman K. G., Matson P. A., Naylor R. & Polasky S. Agricultural sustainability and intensive production practices. Nature 418, 671–677 (2002). - PubMed
-
- Rockstrom J. et al.. A safe operating space for humanity. Nature 461, 472–475 (2009). - PubMed
-
- Hooper D. U. et al.. Effects of biodiversity on ecosystem functioning: a consensus of current knowledge. Ecol. Monogr. 75, 3–35 (2005).
-
- Bardgett R. D. & van der Putten W. H. Belowground biodiversity and ecosystem functioning. Nature 515, 505–511 (2014). - PubMed
Publication types
MeSH terms
Substances
LinkOut - more resources
Full Text Sources
Other Literature Sources
