. 2017 Feb 8:7:42222.
doi: 10.1038/srep42222.

Genotoxic Effects of Culture Media on Human Pluripotent Stem Cells

Affiliations

Genotoxic Effects of Culture Media on Human Pluripotent Stem Cells

Megha Prakash Bangalore et al. Sci Rep. .

Abstract

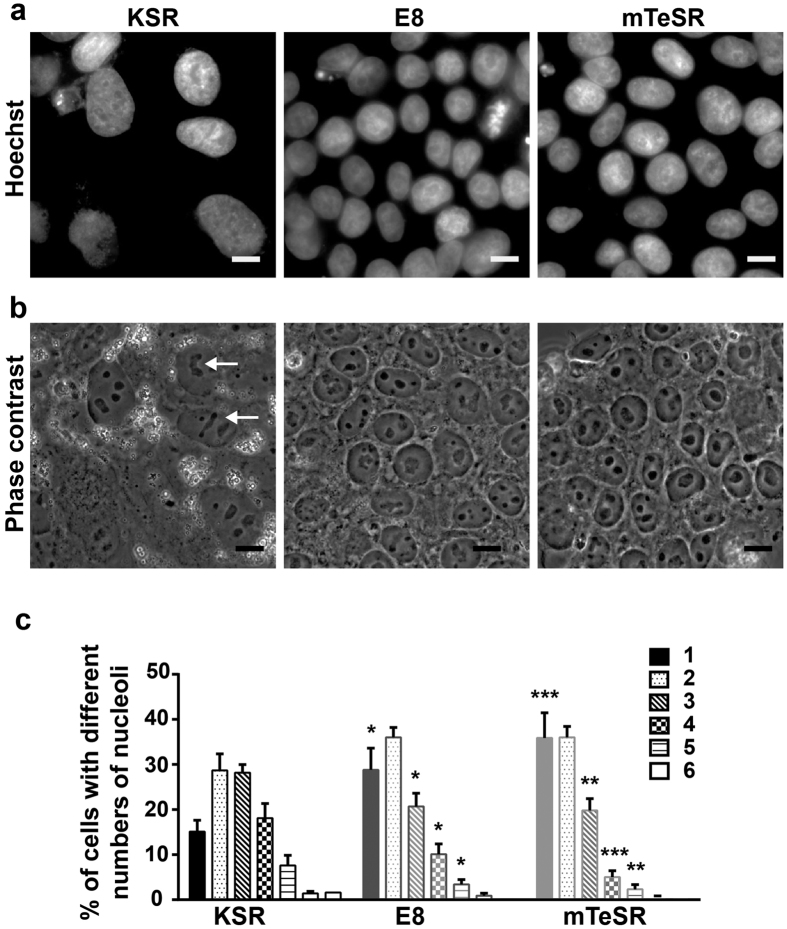
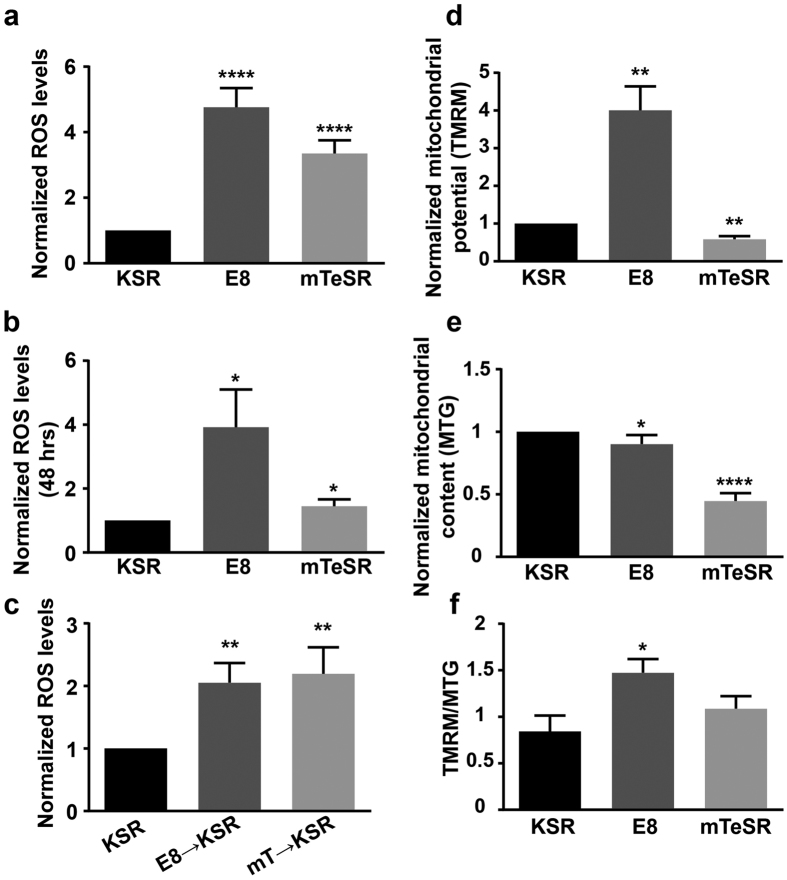
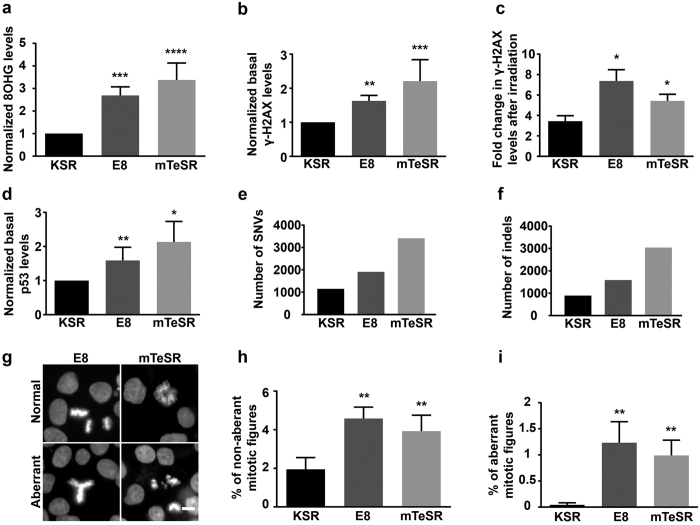
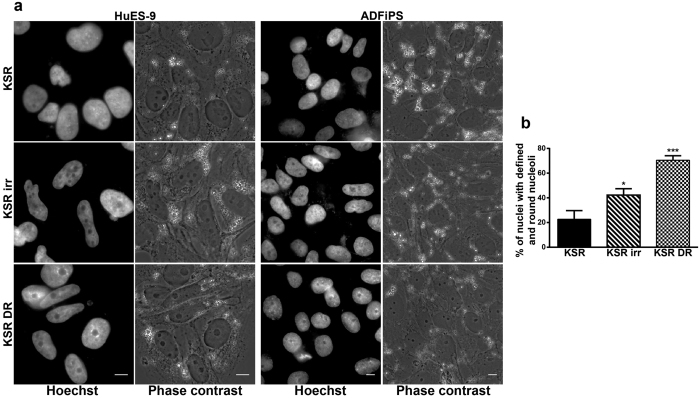
Culture conditions play an important role in regulating the genomic integrity of Human Pluripotent Stem Cells (HPSCs). We report that HPSCs cultured in Essential 8 (E8) and mTeSR, two widely used media for feeder-free culturing of HPSCs, had many fold higher levels of ROS and higher mitochondrial potential than cells cultured in Knockout Serum Replacement containing media (KSR). HPSCs also exhibited increased levels of 8-hydroxyguanosine, phospho-histone-H2a.X and p53, as well as increased sensitivity to γ-irradiation in these two media. HPSCs in E8 and mTeSR had increased incidence of changes in their DNA sequence, indicating genotoxic stress, in addition to changes in nucleolar morphology and number. Addition of antioxidants to E8 and mTeSR provided only partial rescue. Our results suggest that it is essential to determine cellular ROS levels in addition to currently used criteria i.e. pluripotency markers, differentiation into all three germ layers and normal karyotype through multiple passages, in designing culture media.


Conflict of interest statement

The authors declare no competing financial interests.

Figures

Figure 1
Figure 1. Nuclear and nucleolar morphologies of HPSCs cultured in KSR, E8 and mTeSR media are different.
(a) Hoechst 33342 staining of ADFiPS showing larger nuclei in KSR compared to E8 and mTeSR media. (b) Bright field images of ADFiPS corresponding to their respective Hoechst images in (a) showing reticulate & multiple nucleoli per nucleus in KSR, fewer reticulate nucleoli and higher numbers of single nucleoli per nucleus in E8; large and round, mostly single nucleolus per nucleus in mTeSR. (c) Quantification of the percentage of nuclei with different number of nucleoli for HPSCs in the three media. 1–6 refers to the number of nucleoli per nucleus. All the scale bars represent 10 μm. Pooled data from all the four cell lines represented as mean ± SEM. Unpaired t-test with Welch’s correction. ****p < 0.0001, ***p < 0.001, **p < 0.01, *p < 0.05. n ≥ 10 for all quantitative data and each ‘n’ represents a sample of at least 50 nuclei.
Figure 2
Figure 2. ROS levels and mitochondrial potential of HPSCs in E8 and mTeSR media are higher than in KSR.
Quantification of DCFDA fluorescence values (ROS levels) of HPSCs cultured in the three media for (a) ≥3 passages (b) 48 hours and (c) in KSR media for 5–8 days after three passages in E8 and mTeSR; n ≥ 10, n = 3 and n = 6, respectively. Quantification of mitochondrial potential expressed as (d) TMRM fluorescence/cell and (f) TMRM/MTG fluorescence; n ≥ 5 and n = 4 respectively. (e) Quantification of mitochondrial content - MTG fluorescence; n = 7. Normalized data represent values normalized with respect to KSR. Pooled data from all the four cell lines represented as mean ± SEM. Unpaired t-test with Welch’s correction. ****p < 0.0001, ***p < 0.001, **p < 0.01, *p < 0.05.
Figure 3
Figure 3. HPSCs in E8 and mTeSR media show higher nuclei acid damage when compared to KSR.
Quantification of (a) normalized nuclear 8-hydroxyguanosine levels; n = 9, (b) normalized basal γ-H2AX levels – DSBs; n ≥ 5, (c) fold increase in DSBs after γ-irradiation; n ≥ 3, (d) normalized basal p53 levels; n ≥ 4, of HPSCs in the three media. (e) Total number of SNVs (f) insertions and deletions seen in HuES9 cells cultured in the three media for three passages. (g) Representative images of normal and aberrant mitotic figures seen in E8 and mTeSR. Quantification of percentage of (h) total mitotic figures and (i) aberrant mitotic figures seen in HPSCs in the three media; n = 12. Normalized data represent values normalized with respect to KSR. All the scale bars represent 10 μm. Pooled data from all the four cell lines represented as mean ± SEM. Unpaired t-test with Welch’s correction. ****p < 0.0001, ***p < 0.001, **p < 0.01, *p < 0.05.
Figure 4
Figure 4. Vitamin-C and glutathione (GSH) partially reduce the effects of E8 and mTeSR media on HPSCs.
Quantification of (a) normalized ROS levels; n ≥ 10, (b) normalized mitochondrial potential; n = 4, (c) normalized nuclear 8OHG levels; n = 6, (d) normalized basal DSBs (γ-H2AX); n ≥ 5 (e) fold increase in DSBs after γ-irradiation; n = 4 and (f) normalized p53 levels; n ≥ 4 for HPSCs cultured in the three media. Normalized data represent values normalized with respect to KSR. V: Vitamin-C, G: Glutathione. Pooled data from all the four cell lines represented as mean ± SEM. Unpaired t-test with Welch’s correction. ****p < 0.0001, ***p < 0.001, **p < 0.01, *p < 0.05. $Represent p-values with respect to their untreated controls.
Figure 5
Figure 5. Nucleolar morphology can act as “stress reporter” in HPSCs.
(a) Representative Hoechst-stained and corresponding phase contrast images of two HPSC lines cultured in KSR media and treated with genotoxic stress – i.e., irradiation (irr) and doxorubicin (DR) showing clear, distinct and rounded nucleoli in KSR treated with γ-irradiation and doxorubicin while reticulate and less defined nucleoli in untreated KSR. (b) Quantification of percentage of clear and distinct nucleoli in untreated KSR and KSR with genotoxic treatments; n = 6. All scale bars represent 10 μm. Pooled data from all the four cell lines and represented as mean ± SEM. Unpaired t-test with Welch’s correction. ***p < 0.001, *p < 0.05.

References

    1. Cho Y. M. et al.. Dynamic changes in mitochondrial biogenesis and antioxidant enzymes during the spontaneous differentiation of human embryonic stem cells. Biochem. Biophys. Res. Commun. 348, 1472–8 (2006). - PubMed
    1. Saretzki G. et al.. Downregulation of multiple stress defense mechanisms during differentiation of human embryonic stem cells. Stem Cells 26, 455–64 (2008). - PubMed
    1. Armstrong L. et al.. Human induced pluripotent stem cell lines show stress defense mechanisms and mitochondrial regulation similar to those of human embryonic stem cells. Stem Cells 28, 661–73 (2010). - PubMed
    1. Maynard S. et al.. Human embryonic stem cells have enhanced repair of multiple forms of DNA damage. Stem Cells 26, 2266–74 (2008). - PMC - PubMed
    1. Filion T. M. et al.. Survival responses of human embryonic stem cells to DNA damage. J. Cell. Physiol. 220, 586–592 (2009). - PMC - PubMed

Publication types