Polder maps: improving OMIT maps by excluding bulk solvent
- PMID: 28177311
- PMCID: PMC5297918
- DOI: 10.1107/S2059798316018210
Polder maps: improving OMIT maps by excluding bulk solvent
Abstract
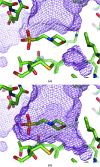
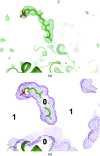
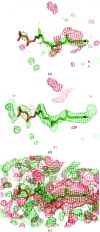
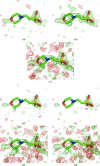
The crystallographic maps that are routinely used during the structure-solution workflow are almost always model-biased because model information is used for their calculation. As these maps are also used to validate the atomic models that result from model building and refinement, this constitutes an immediate problem: anything added to the model will manifest itself in the map and thus hinder the validation. OMIT maps are a common tool to verify the presence of atoms in the model. The simplest way to compute an OMIT map is to exclude the atoms in question from the structure, update the corresponding structure factors and compute a residual map. It is then expected that if these atoms are present in the crystal structure, the electron density for the omitted atoms will be seen as positive features in this map. This, however, is complicated by the flat bulk-solvent model which is almost universally used in modern crystallographic refinement programs. This model postulates constant electron density at any voxel of the unit-cell volume that is not occupied by the atomic model. Consequently, if the density arising from the omitted atoms is weak then the bulk-solvent model may obscure it further. A possible solution to this problem is to prevent bulk solvent from entering the selected OMIT regions, which may improve the interpretative power of residual maps. This approach is called a polder (OMIT) map. Polder OMIT maps can be particularly useful for displaying weak densities of ligands, solvent molecules, side chains, alternative conformations and residues both in terminal regions and in loops. The tools described in this manuscript have been implemented and are available in PHENIX.
Keywords: OMIT maps; PHENIX; bulk solvent; ligand validation; polder maps; residual (difference) Fourier synthesis; weak density.
Figures



Similar articles
-
Prediction of models for ordered solvent in macromolecular structures by a classifier based upon resolution-independent projections of local feature data.Acta Crystallogr D Struct Biol. 2019 Aug 1;75(Pt 8):696-717. doi: 10.1107/S2059798319008933. Epub 2019 Jul 30. Acta Crystallogr D Struct Biol. 2019. PMID: 31373570 Free PMC article.
-
Application of maximum-entropy maps in the accurate refinement of a putative acylphosphatase using 1.3 A X-ray diffraction data.Acta Crystallogr D Biol Crystallogr. 2008 Mar;64(Pt 3):237-47. doi: 10.1107/S0907444907065663. Epub 2008 Feb 20. Acta Crystallogr D Biol Crystallogr. 2008. PMID: 18323618
-
Accounting for nonuniformity of bulk-solvent: A mosaic model.Protein Sci. 2024 Mar;33(3):e4909. doi: 10.1002/pro.4909. Protein Sci. 2024. PMID: 38358136 Free PMC article.
-
The solvent component of macromolecular crystals.Acta Crystallogr D Biol Crystallogr. 2015 May;71(Pt 5):1023-38. doi: 10.1107/S1399004715006045. Epub 2015 Apr 30. Acta Crystallogr D Biol Crystallogr. 2015. PMID: 25945568 Free PMC article. Review.
-
You are lost without a map: Navigating the sea of protein structures.Biochim Biophys Acta. 2015 Apr;1854(4):258-68. doi: 10.1016/j.bbapap.2014.12.021. Epub 2014 Dec 29. Biochim Biophys Acta. 2015. PMID: 25554228 Free PMC article. Review.
Cited by
-
Glycolytic flux control by drugging phosphoglycolate phosphatase.Nat Commun. 2022 Nov 11;13(1):6845. doi: 10.1038/s41467-022-34228-2. Nat Commun. 2022. PMID: 36369173 Free PMC article.
-
Identification of a BAZ2A Bromodomain Hit Compound by Fragment Joining.ACS Bio Med Chem Au. 2021 Dec 15;1(1):5-10. doi: 10.1021/acsbiomedchemau.1c00016. Epub 2021 Jul 7. ACS Bio Med Chem Au. 2021. PMID: 36147311 Free PMC article.
-
Large Stokes shift fluorescence activation in an RNA aptamer by intermolecular proton transfer to guanine.Nat Commun. 2021 Jun 10;12(1):3549. doi: 10.1038/s41467-021-23932-0. Nat Commun. 2021. PMID: 34112799 Free PMC article.
-
Crystal Structure of the Native Chromoprotein from Pleurotus salmoneostramineus Provides Insights into the Pigmentation Mechanism.J Agric Food Chem. 2024 Aug 7;72(31):17626-17632. doi: 10.1021/acs.jafc.4c02951. Epub 2024 Jul 29. J Agric Food Chem. 2024. PMID: 39073883 Free PMC article.
-
Automatically Fixing Errors in Glycoprotein Structures with Rosetta.Structure. 2019 Jan 2;27(1):134-139.e3. doi: 10.1016/j.str.2018.09.006. Epub 2018 Oct 18. Structure. 2019. PMID: 30344107 Free PMC article.
References
Publication types
MeSH terms
Substances
Grants and funding
LinkOut - more resources
Full Text Sources
Other Literature Sources
Research Materials

