

Identifying relations between imaging phenotypes and molecular subtypes of breast cancer: Model discovery and external validation
- PMID: 28177554
- PMCID: PMC5548657
- DOI: 10.1002/jmri.25661
Identifying relations between imaging phenotypes and molecular subtypes of breast cancer: Model discovery and external validation
Abstract
Purpose: To determine whether dynamic contrast enhancement magnetic resonance imaging (DCE-MRI) characteristics of the breast tumor and background parenchyma can distinguish molecular subtypes (ie, luminal A/B or basal) of breast cancer.
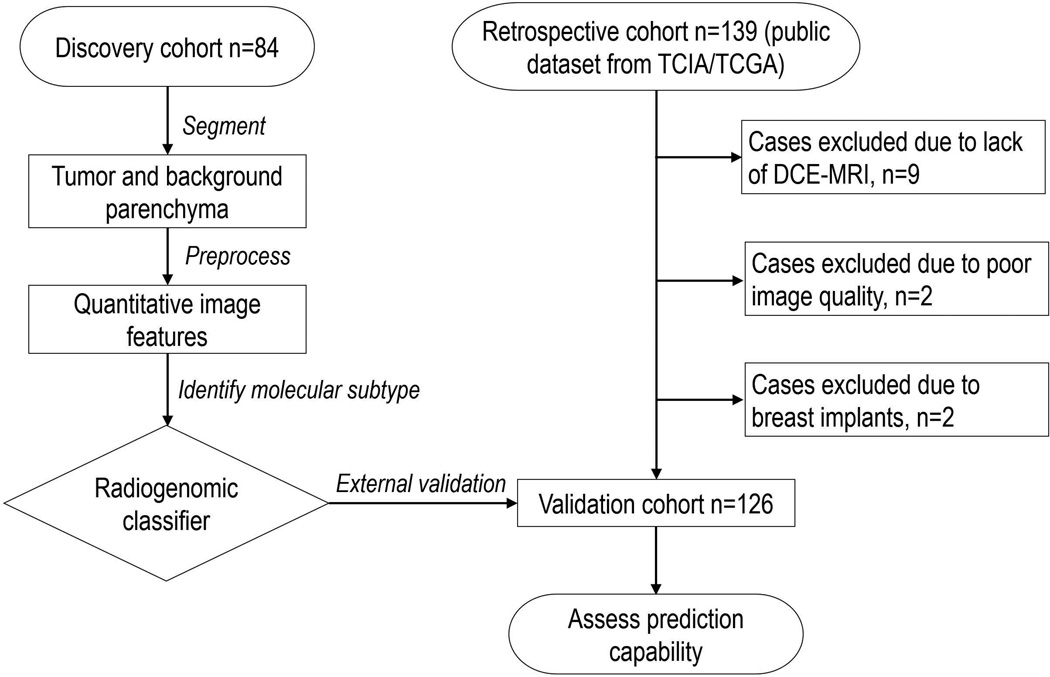
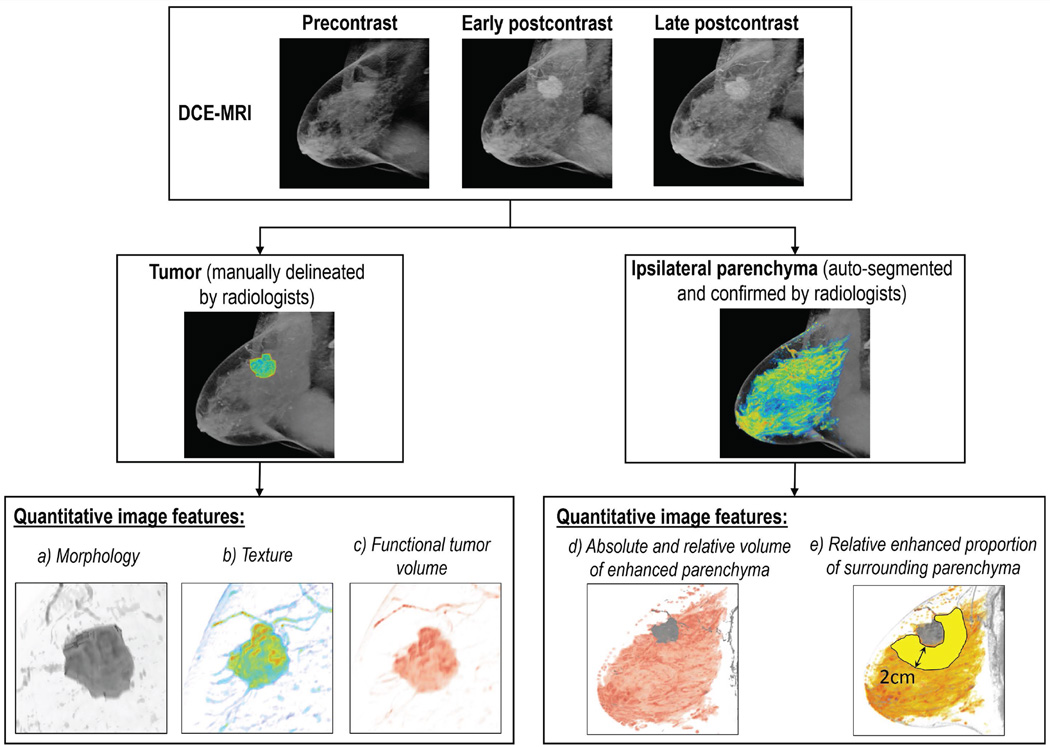
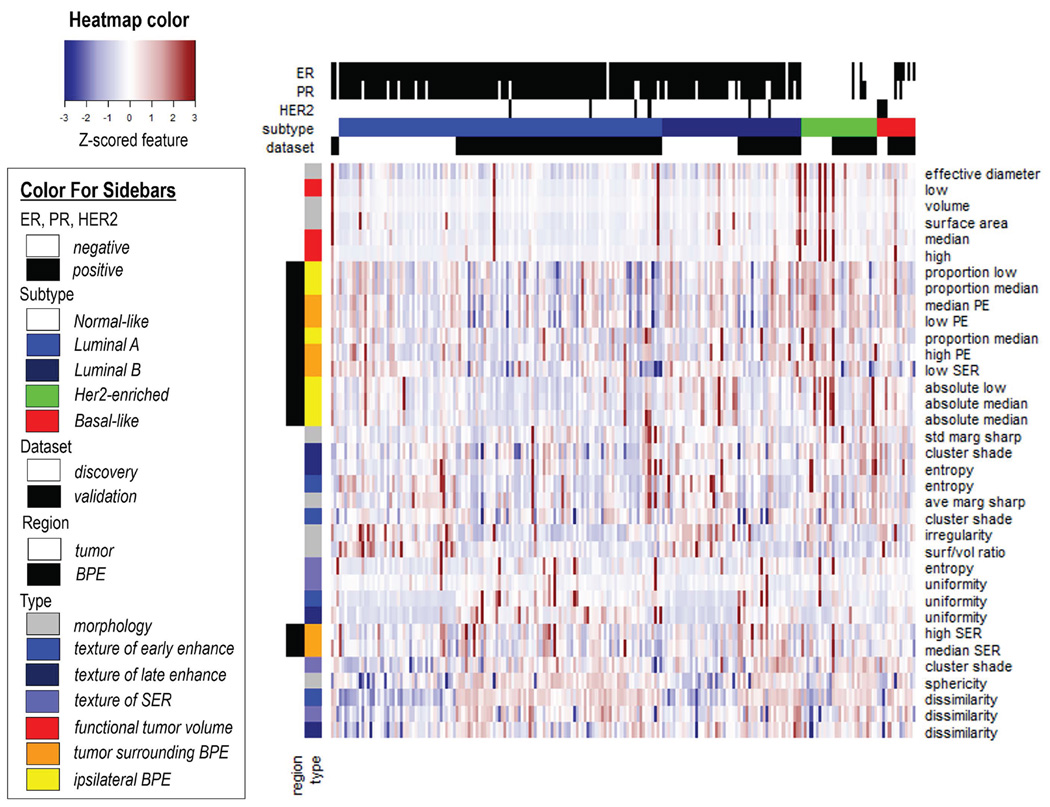
Materials and methods: In all, 84 patients from one institution and 126 patients from The Cancer Genome Atlas (TCGA) were used for discovery and external validation, respectively. Thirty-five quantitative image features were extracted from DCE-MRI (1.5 or 3T) including morphology, texture, and volumetric features, which capture both tumor and background parenchymal enhancement (BPE) characteristics. Multiple testing was corrected using the Benjamini-Hochberg method to control the false-discovery rate (FDR). Sparse logistic regression models were built using the discovery cohort to distinguish each of the three studied molecular subtypes versus the rest, and the models were evaluated in the validation cohort.
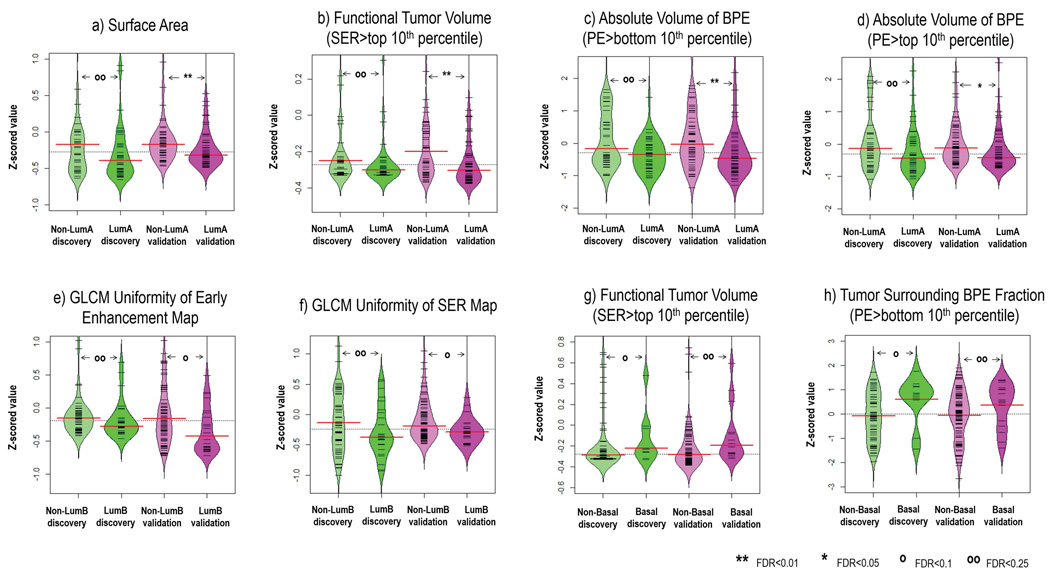
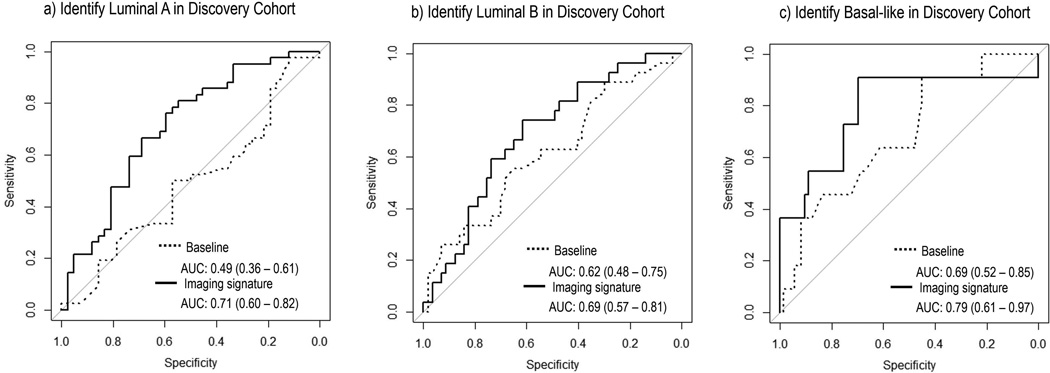
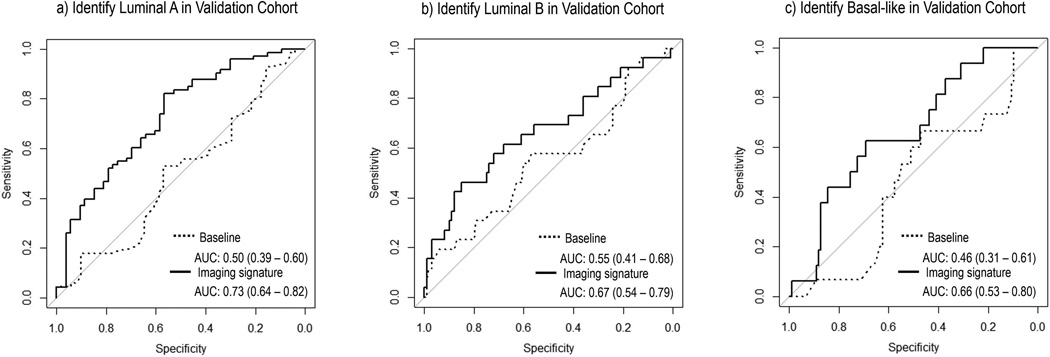
Results: On univariate analysis in discovery and validation cohorts, two features characterizing tumor and two characterizing BPE were statistically significant in separating luminal A versus nonluminal A cancers; two features characterizing tumor were statistically significant for separating luminal B; one feature characterizing tumor and one characterizing BPE reached statistical significance for distinguishing basal (Wilcoxon P < 0.05, FDR < 0.25). In discovery and validation cohorts, multivariate logistic regression models achieved an area under the receiver operator characteristic curve (AUC) of 0.71 and 0.73 for luminal A cancer, 0.67 and 0.69 for luminal B cancer, and 0.66 and 0.79 for basal cancer, respectively.
Conclusion: DCE-MRI characteristics of breast cancer and BPE may potentially be used to distinguish among molecular subtypes of breast cancer.
Level of evidence: 3 Technical Efficacy: Stage 3 J. Magn. Reson. Imaging 2017;46:1017-1027.
Keywords: breast cancer; classification; dynamic contrast enhanced MRI; imaging genomics; molecular subtype.
© 2017 International Society for Magnetic Resonance in Medicine.
Figures
References
-
- Perou CM, Sorlie T, Eisen MB, et al. Molecular portraits of human breast tumours. Nature. 2000;406(6797):747–752. - PubMed
-
- Schnitt SJ. Classification and prognosis of invasive breast cancer: from morphology to molecular taxonomy. Modern Pathology. 2010;23:S60–S64. - PubMed
-
- Loi S, Haibe-Kains B, Desmedt C, et al. Definition of clinically distinct molecular subtypes in estrogen receptor-positive breast carcinomas through genomic grade. J Clin Oncol. 2007;25(10):1239–1246. - PubMed
-
- Guiu S, Michiels S, Andre F, et al. Molecular subclasses of breast cancer: how do we define them? The IMPAKT 2012 Working Group Statement. Annals of oncology. 2012;23(12):2997–3006. - PubMed
Publication types
MeSH terms
Substances
Grants and funding
LinkOut - more resources
Full Text Sources
Other Literature Sources
Medical
