. 2017 Feb 7;18(2):347.
doi: 10.3390/ijms18020347.

Anti-Inflammatory Activity of Sanghuangporus sanghuang Mycelium

Affiliations

Anti-Inflammatory Activity of Sanghuangporus sanghuang Mycelium

Wang-Ching Lin et al. Int J Mol Sci. .

Abstract

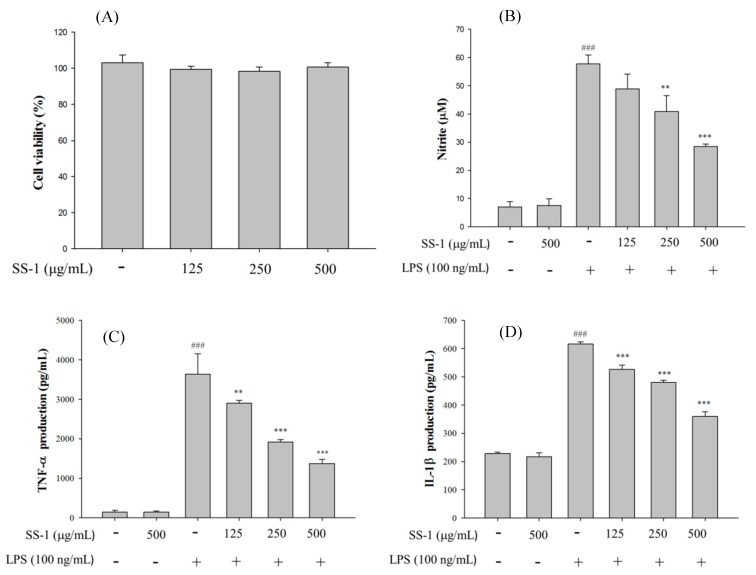
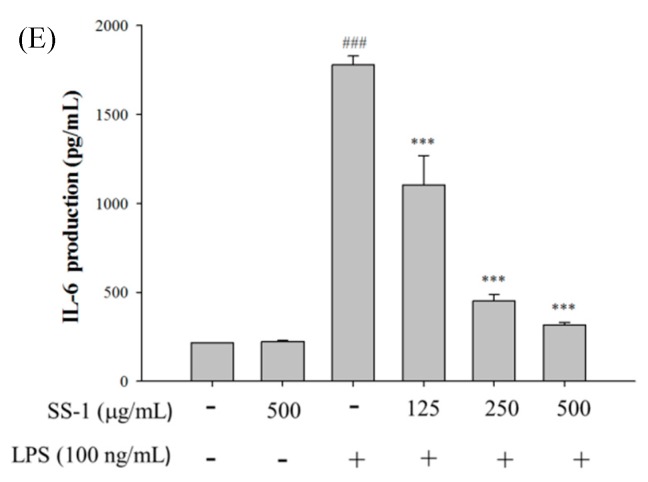
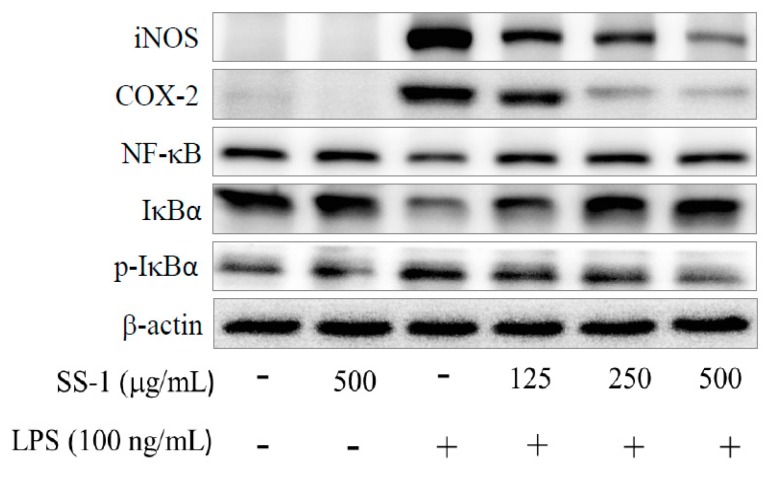
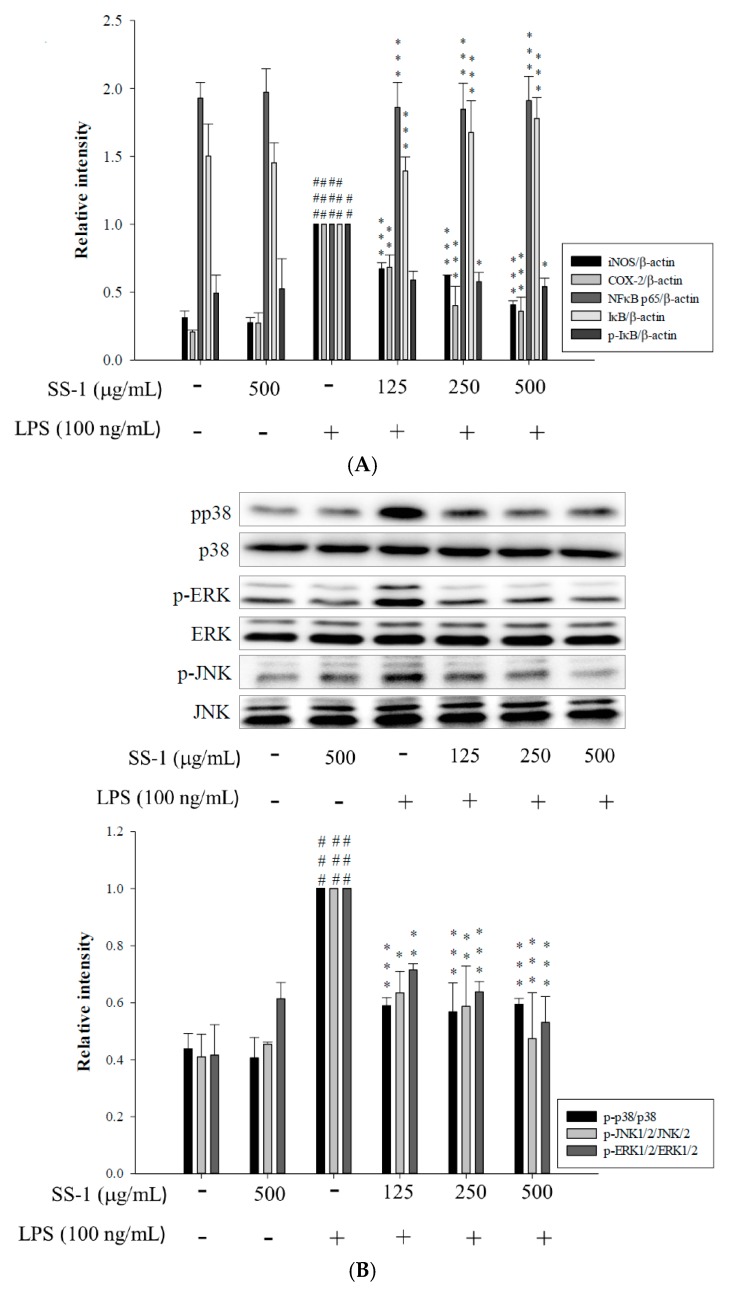
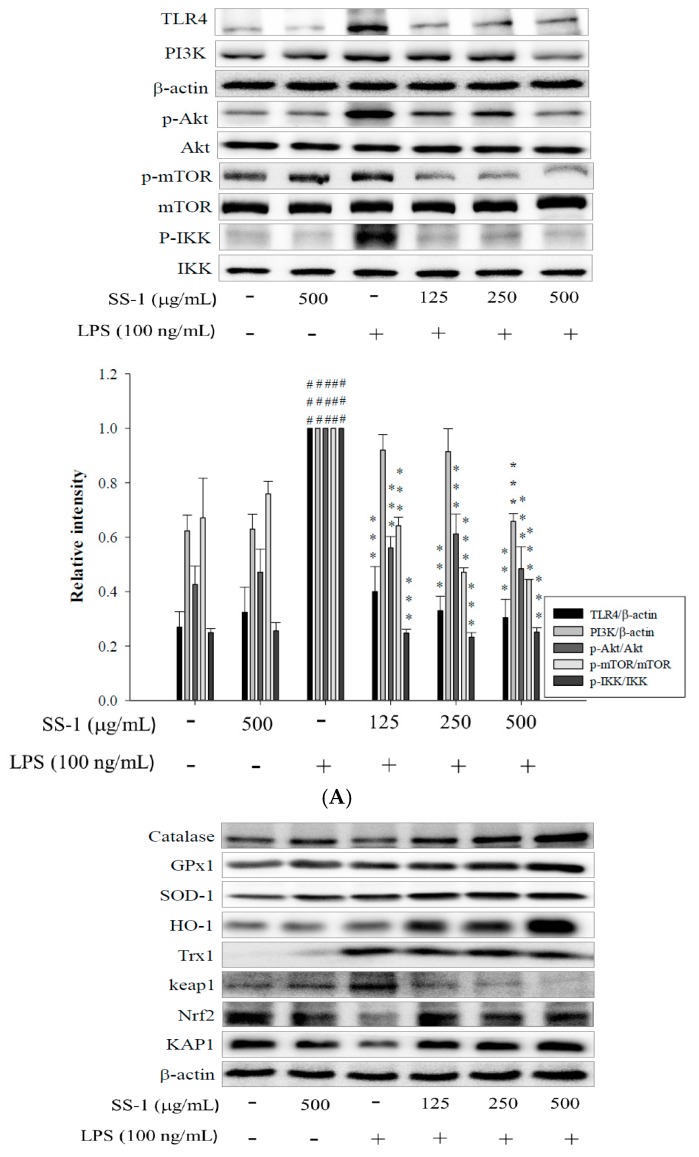
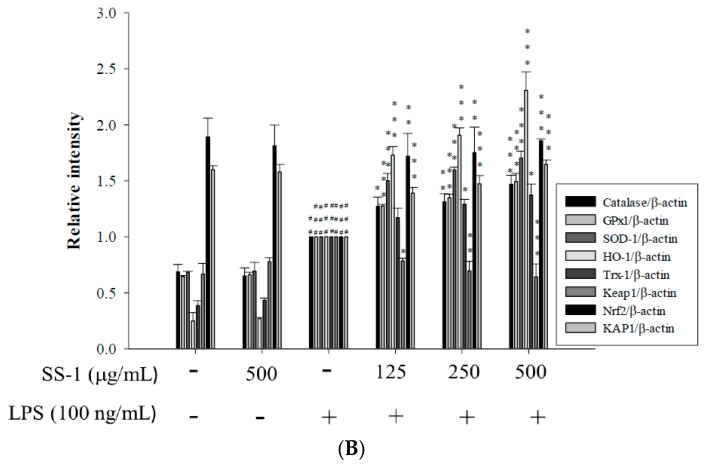
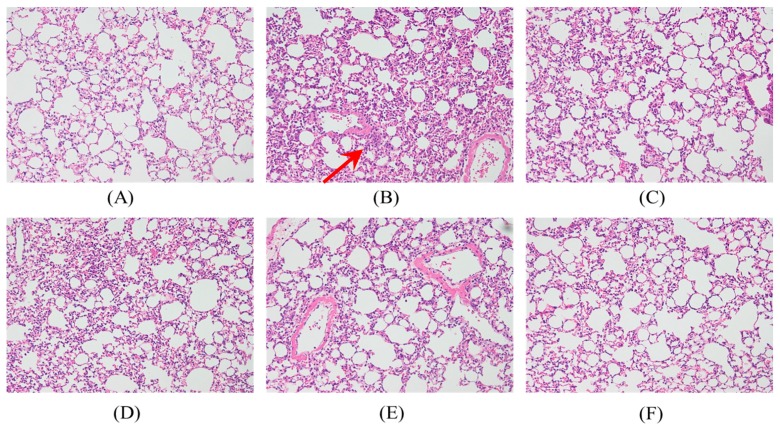
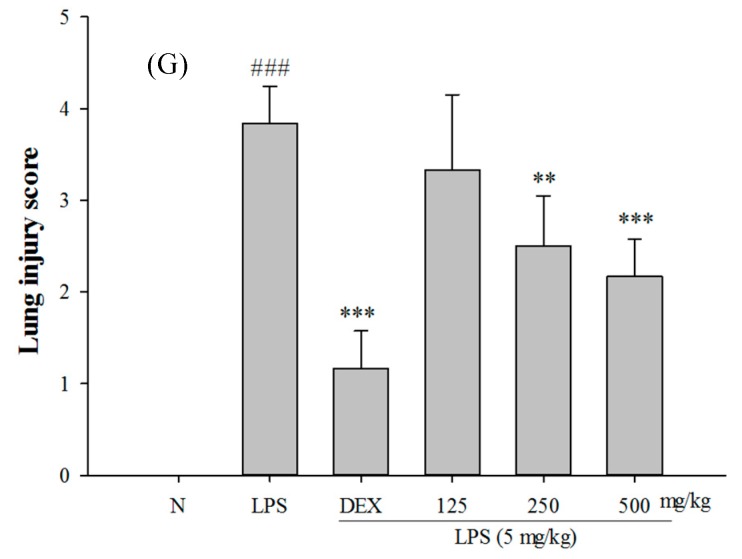
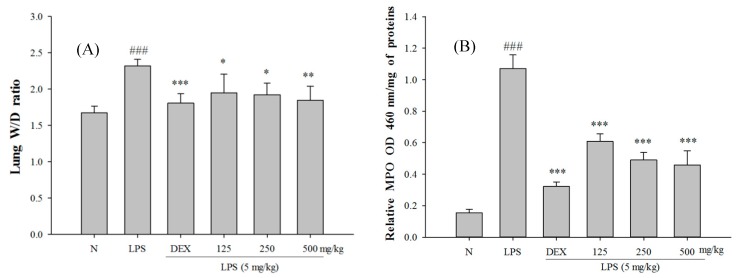
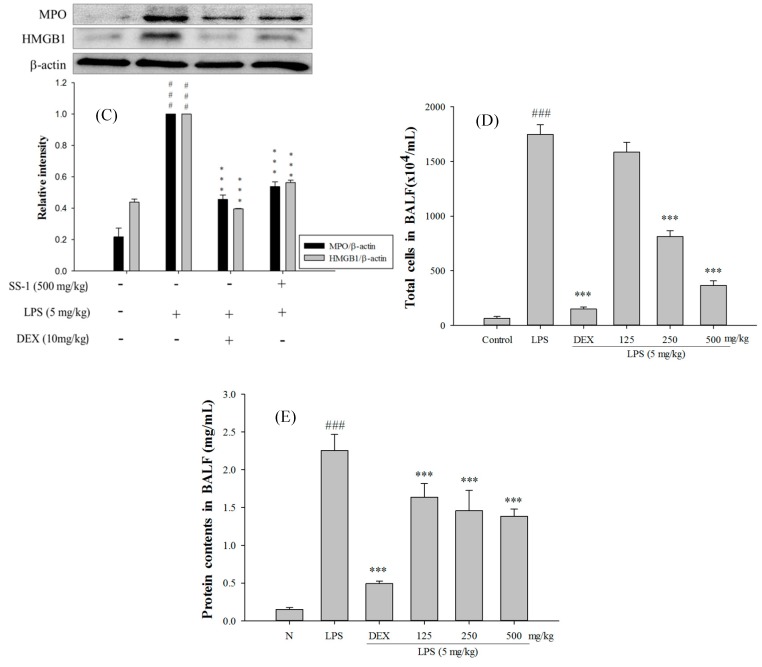
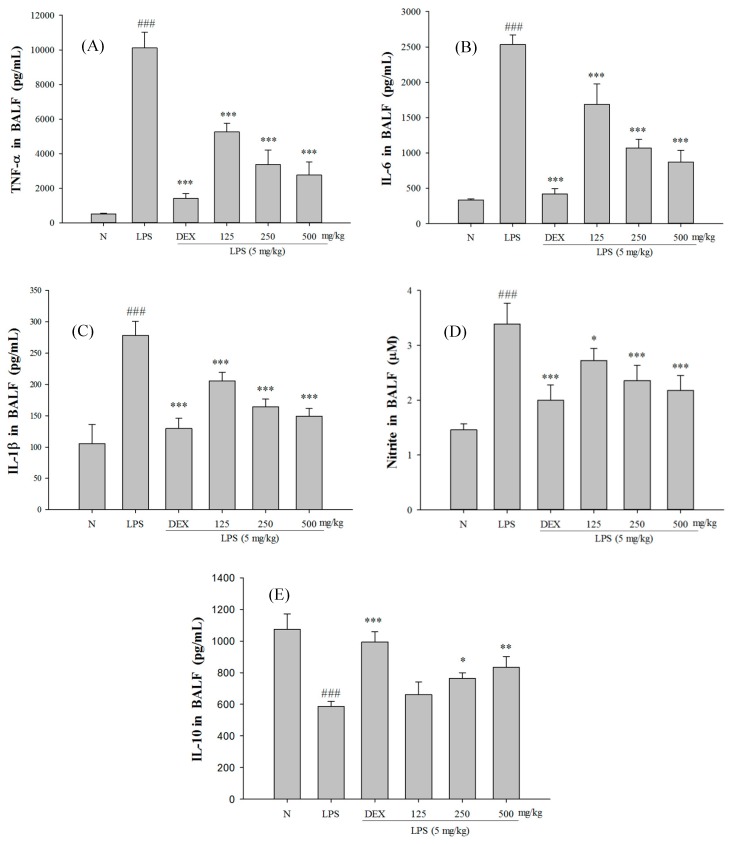
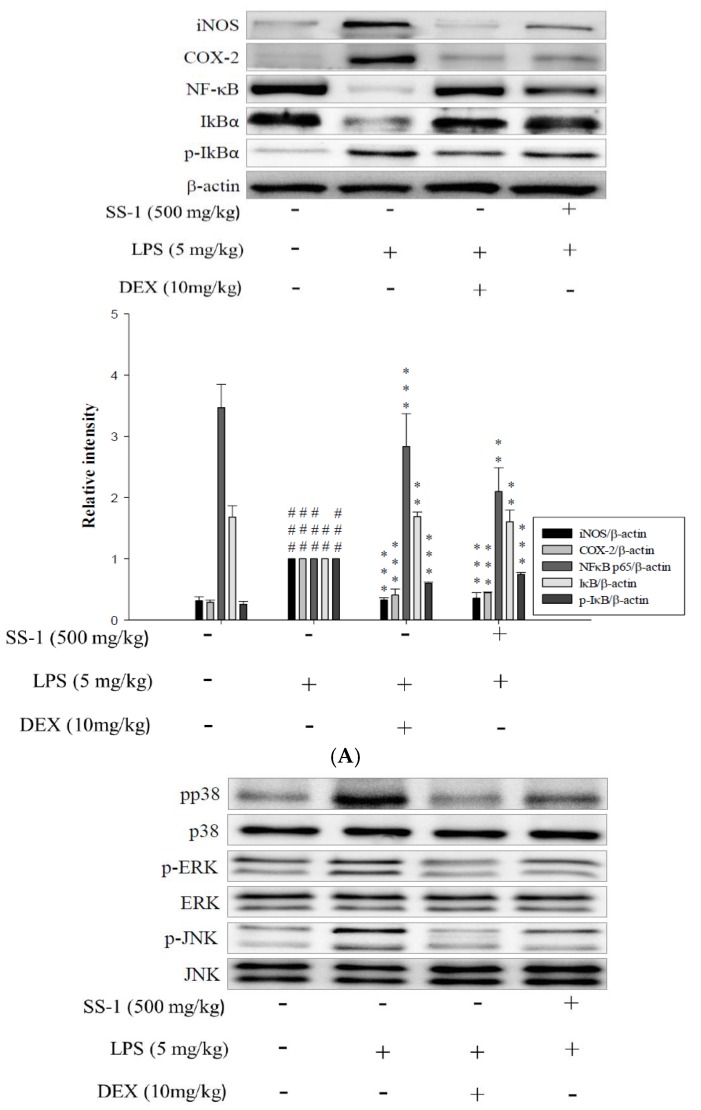
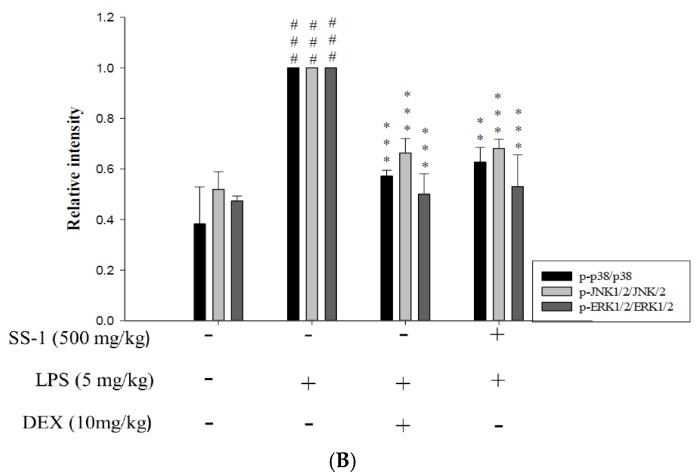
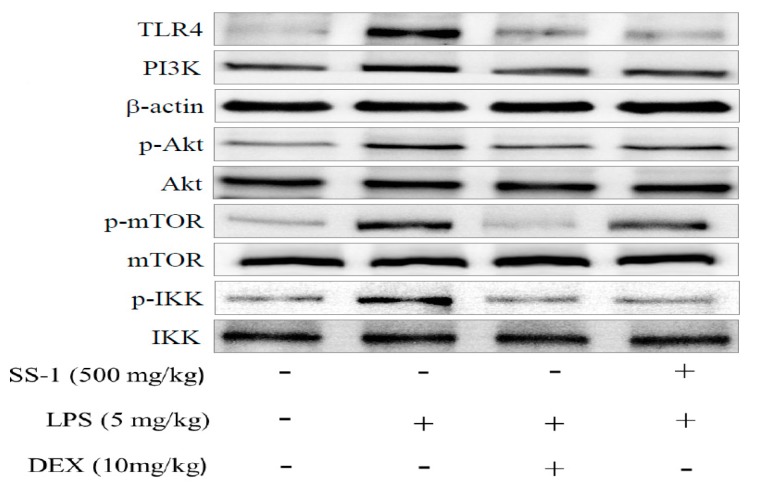
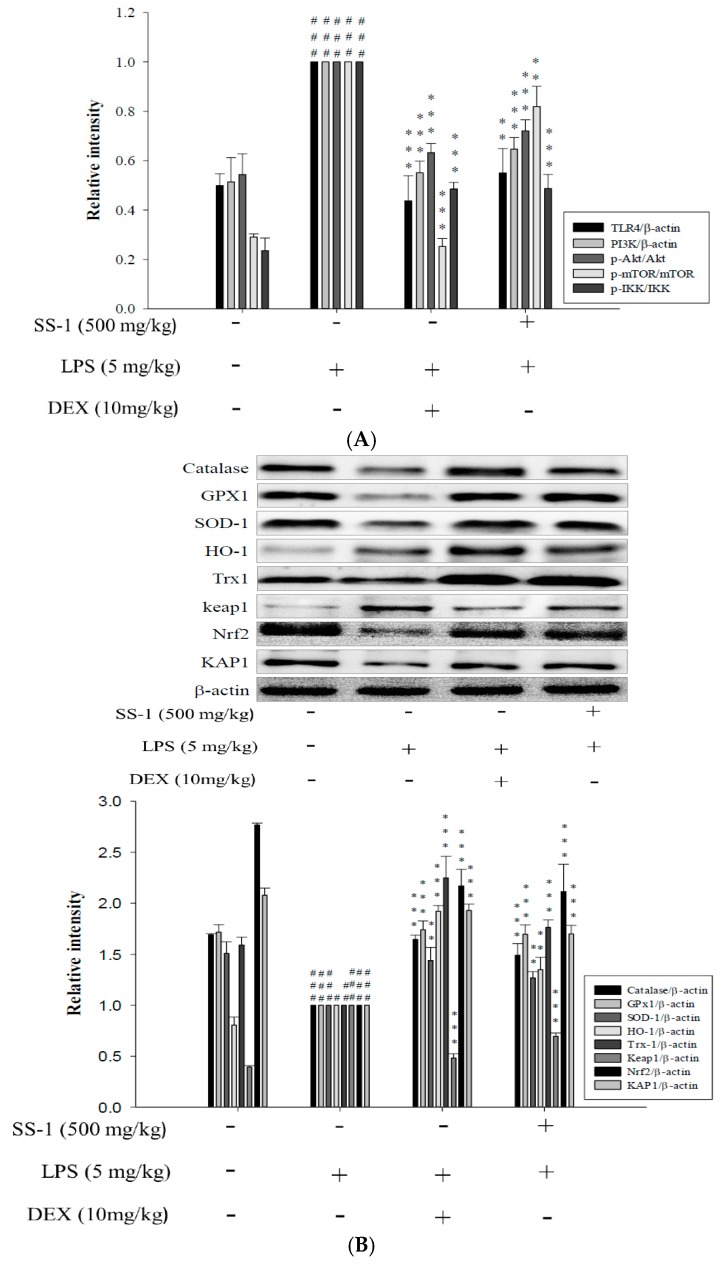
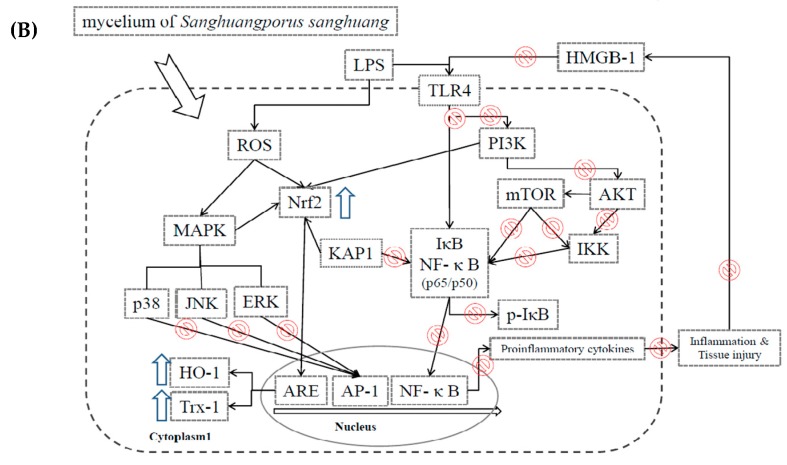
Acute lung injury (ALI) is characterized by inflammation of the lung tissue and oxidative injury caused by excessive accumulation of reactive oxygen species. Studies have suggested that anti-inflammatory or antioxidant agents could be used for the treatment of ALI with a good outcome. Therefore, our study aimed to test whether the mycelium extract of Sanghuangporus sanghuang (SS-1), believed to exhibit antioxidant and anti-inflammatory properties, could be used against the excessive inflammatory response associated with lipopolysaccharides (LPS)-induced ALI in mice and to investigate its possible mechanism of action. The experimental results showed that the administration of SS-1 could inhibit LPS-induced inflammation. SS-1 could reduce the number of inflammatory cells, inhibit myeloperoxidase (MPO) activity, regulate the TLR4/PI3K/Akt/mTOR pathway and the signal transduction of NF-κB and MAPK pathways in the lung tissue, and inhibit high mobility group box-1 protein 1 (HNGB1) activity in BALF. In addition, SS-1 could affect the synthesis of antioxidant enzymes Heme oxygenase 1 (HO-1) and Thioredoxin-1 (Trx-1) in the lung tissue and regulate signal transduction in the KRAB-associated protein-1 (KAP1)/nuclear factor erythroid-2-related factor Nrf2/Kelch Like ECH associated Protein 1 (Keap1) pathway. Histological results showed that administration of SS-1 prior to induction could inhibit the large-scale LPS-induced neutrophil infiltration of the lung tissue. Therefore, based on all experimental results, we propose that SS-1 exhibits a protective effect against LPS-induced ALI in mice. The mycelium of S. sanghuang can potentially be used for the treatment or prevention of inflammation-related diseases.

Keywords: HNGB; HO-1; KAP1/Nrf2 pathway; PI3K/Akt/mTOR pathways; acute lung injury; lipopolysaccharide; mycelium of Sanghuangporus sanghuang.


Conflict of interest statement

The authors declare no conflict of interest.

Figures

Figure 1
Figure 1
SS-1 inhibited lipopolysaccharide (LPS)-induced cell inflammation in RAW264.7 cells. Cytotoxicity (A) of SS-1 in LPS-stimulated RAW264.7 cells. Cells were treated with SS-1 at 125, 250 and 500 μg/mL for 24 h, and cell viability was assayed by the 3-(4,5-Dimethylthiazol-2-yl)-2,5-diphenyltetrazolium bromide MTT assay. NO (B); TNF-α (C); IL-1β (D); and IL-6 (E) production in LPS-stimulated RAW264.7 cells. Cells were incubated with or without LPS (100 ng/mL) in the presence of various doses (125, 250 and 500 μg/mL) of SS-1 for 24 h. Data are expressed as the means ± SD of three independent experiments; ### compared with sample of control group (one-way ANOVA followed by Scheffe’s multiple range tests); ** p < 0.01, and *** p < 0.001, were compared with LPS-alone group.
Figure 1
Figure 1
SS-1 inhibited lipopolysaccharide (LPS)-induced cell inflammation in RAW264.7 cells. Cytotoxicity (A) of SS-1 in LPS-stimulated RAW264.7 cells. Cells were treated with SS-1 at 125, 250 and 500 μg/mL for 24 h, and cell viability was assayed by the 3-(4,5-Dimethylthiazol-2-yl)-2,5-diphenyltetrazolium bromide MTT assay. NO (B); TNF-α (C); IL-1β (D); and IL-6 (E) production in LPS-stimulated RAW264.7 cells. Cells were incubated with or without LPS (100 ng/mL) in the presence of various doses (125, 250 and 500 μg/mL) of SS-1 for 24 h. Data are expressed as the means ± SD of three independent experiments; ### compared with sample of control group (one-way ANOVA followed by Scheffe’s multiple range tests); ** p < 0.01, and *** p < 0.001, were compared with LPS-alone group.
Figure 2
Figure 2
Effects of SS-1 on iNOS, COX-2, IκBα, p-IκBα, and NF-κB protein expression (A); and MAPK phosphorylation (B) in LPS-induced RAW264.7 cells. Cells were incubated with or without LPS (100 ng/mL) in the presence of various concentrations (125, 250 and 500 μg/mL) of SS-1 for 24 h. The data were presented as mean ± SD for the three different experiments performed in triplicate; ## p < 0.01, and ### p < 0.001 were compared with sample of control group (one-way ANOVA followed by Scheffe’s multiple range tests); * p < 0.05, ** p < 0.01 and *** p < 0.001 were compared with LPS-alone group.
Figure 2
Figure 2
Effects of SS-1 on iNOS, COX-2, IκBα, p-IκBα, and NF-κB protein expression (A); and MAPK phosphorylation (B) in LPS-induced RAW264.7 cells. Cells were incubated with or without LPS (100 ng/mL) in the presence of various concentrations (125, 250 and 500 μg/mL) of SS-1 for 24 h. The data were presented as mean ± SD for the three different experiments performed in triplicate; ## p < 0.01, and ### p < 0.001 were compared with sample of control group (one-way ANOVA followed by Scheffe’s multiple range tests); * p < 0.05, ** p < 0.01 and *** p < 0.001 were compared with LPS-alone group.
Figure 3
Figure 3
Effects of SS-1 on TLR4/PI3K/Akt/mTOR/IKK protein expression (A); and anti-oxidative enzymes, HO-1, Trx-1, and Nrf2/KAP1 protein expression (B) in LPS-induced RAW264.7 cells. Cells were incubated with or without LPS (100 ng/mL) in the presence of various concentrations (125, 250 and 500 μg/mL) of SS-1 for 24 h. The data were presented as mean ± SD for the three different experiments performed in triplicate; ## p < 0.01, and ### p < 0.001 were compared with sample of control group (one-way ANOVA followed by Scheffe’s multiple range tests); ** p < 0.01 and *** p < 0.001 were compared with LPS-alone group.
Figure 3
Figure 3
Effects of SS-1 on TLR4/PI3K/Akt/mTOR/IKK protein expression (A); and anti-oxidative enzymes, HO-1, Trx-1, and Nrf2/KAP1 protein expression (B) in LPS-induced RAW264.7 cells. Cells were incubated with or without LPS (100 ng/mL) in the presence of various concentrations (125, 250 and 500 μg/mL) of SS-1 for 24 h. The data were presented as mean ± SD for the three different experiments performed in triplicate; ## p < 0.01, and ### p < 0.001 were compared with sample of control group (one-way ANOVA followed by Scheffe’s multiple range tests); ** p < 0.01 and *** p < 0.001 were compared with LPS-alone group.
Figure 4
Figure 4
SS-1 attenuated pulmonary inflammation in vivo. Six hours after LPS injection with or without SS-1 pretreatments, mice were exsanguinated and their left lower lungs were fixed. Then, tissue sections were stained with hematoxylin and eosin (H&E): (A) Control; (B) LPS; (C) LPS + Dex; (D) LPS + SS-1-L; (E) LPS + SS-1-M; (F) LPS + SS-1-H. The figure demonstrates a representative view (×400) from each group; each bar represents the mean ± SD of six mice. (G) Severity of lung injury was analyzed by the lung injury scoring system. Each value represents as mean ± SD of six mice; ### compared with sample of control group; ** p < 0.01, and *** p < 0.001 were compared with LPS-alone group. The infiltrating neutrophils were more abundant in (B) LPS group as shown by arrows.
Figure 4
Figure 4
SS-1 attenuated pulmonary inflammation in vivo. Six hours after LPS injection with or without SS-1 pretreatments, mice were exsanguinated and their left lower lungs were fixed. Then, tissue sections were stained with hematoxylin and eosin (H&E): (A) Control; (B) LPS; (C) LPS + Dex; (D) LPS + SS-1-L; (E) LPS + SS-1-M; (F) LPS + SS-1-H. The figure demonstrates a representative view (×400) from each group; each bar represents the mean ± SD of six mice. (G) Severity of lung injury was analyzed by the lung injury scoring system. Each value represents as mean ± SD of six mice; ### compared with sample of control group; ** p < 0.01, and *** p < 0.001 were compared with LPS-alone group. The infiltrating neutrophils were more abundant in (B) LPS group as shown by arrows.
Figure 5
Figure 5
SS-1 improved pulmonary edema (A); Myeloperoxidase (MPO) activity (B); MPO and HMGB1 protein level (C) in vivo; and reduced cellular counts (D); and total protein (E) in BALF. Six hours after LPS injection with or without SS-1 pretreatments, mice were sacrificed and their lungs were lavaged. The right lower lungs were used to assess wet to dry (W/D) ratio of lung. Cells in the BALF were collected and cytospin preparations were made. Total cells and total proteins in BALF were analyzed. Data represent mean ± SD of six mice; ### compared with sample of control group (one-way ANOVA followed by Scheffe’s multiple range tests); * p < 0.05, ** p < 0.01, and *** p < 0.001, were compared with LPS-alone group.
Figure 5
Figure 5
SS-1 improved pulmonary edema (A); Myeloperoxidase (MPO) activity (B); MPO and HMGB1 protein level (C) in vivo; and reduced cellular counts (D); and total protein (E) in BALF. Six hours after LPS injection with or without SS-1 pretreatments, mice were sacrificed and their lungs were lavaged. The right lower lungs were used to assess wet to dry (W/D) ratio of lung. Cells in the BALF were collected and cytospin preparations were made. Total cells and total proteins in BALF were analyzed. Data represent mean ± SD of six mice; ### compared with sample of control group (one-way ANOVA followed by Scheffe’s multiple range tests); * p < 0.05, ** p < 0.01, and *** p < 0.001, were compared with LPS-alone group.
Figure 6
Figure 6
SS-1 down regulated: TNF-α (A); IL-6 (B); IL-1β (C); and NO (D); and increased IL-10 (E) in BALF. Six hours after LPS injection with or without SS pre-treatments, mice were sacrificed, their lungs were lavaged and the BALF were collected. TNF-α, IL-6, IL-1β, NO and IL-10 were detected by ELISA. Data represent mean ± SD of six mice; ### compared with sample of control group (one-way ANOVA followed by Scheffe’s multiple range tests); * p < 0.05 ** p < 0.01, and *** p < 0.001, were compared with LPS-alone group.
Figure 7
Figure 7
Effects of SS-1 on LPS-induced iNOs, COX-2, IκB-α, and NF-κB protein expression in lung (A); and MAPK phosphorylation (B) expression in ALI mice. Mice were pretreated with different concentrations of SS for 1 h and stimulated with LPS. Western blotting using specific antibodies was used for the detection of iNOs, COX-2, IκB-α phosphorylated, NF-κB nuclear and cytosol, and total forms of three MAPK molecules, ERK, p38, and JNK. Data represent mean ± SD of six mice; ## p < 0.01, and ### p < 0.001 were compared with sample of control group (one-way ANOVA followed by Scheffe’s multiple range tests); ** p < 0.01, and *** p < 0.001, were compared with LPS-alone group.
Figure 7
Figure 7
Effects of SS-1 on LPS-induced iNOs, COX-2, IκB-α, and NF-κB protein expression in lung (A); and MAPK phosphorylation (B) expression in ALI mice. Mice were pretreated with different concentrations of SS for 1 h and stimulated with LPS. Western blotting using specific antibodies was used for the detection of iNOs, COX-2, IκB-α phosphorylated, NF-κB nuclear and cytosol, and total forms of three MAPK molecules, ERK, p38, and JNK. Data represent mean ± SD of six mice; ## p < 0.01, and ### p < 0.001 were compared with sample of control group (one-way ANOVA followed by Scheffe’s multiple range tests); ** p < 0.01, and *** p < 0.001, were compared with LPS-alone group.
Figure 8
Figure 8
Effects of SS-1 on LPS-induced TLR4, PI3K, AKT, mTOR, and IKK protein expression (A); and antioxidative enzymes and HO-1, Trx-1, Nrf2/KAP1 protein expression (B) in lung in ALI mice. Mice were pretreated with different concentrations of SS for 1 h and stimulated with LPS. The Western blotting using specific antibodies was used for the detection of TLR4, PI3K, AKT, mTOR, and IKK protein expression. Data represent mean ± SD of six mice; # p < 0.05, ## p < 0.01, and ### p < 0.001 were compared with sample of control group (one-way ANOVA followed by Scheffe’s multiple range tests); ** p < 0.01, and *** p < 0.001, were compared with LPS-alone group.
Figure 8
Figure 8
Effects of SS-1 on LPS-induced TLR4, PI3K, AKT, mTOR, and IKK protein expression (A); and antioxidative enzymes and HO-1, Trx-1, Nrf2/KAP1 protein expression (B) in lung in ALI mice. Mice were pretreated with different concentrations of SS for 1 h and stimulated with LPS. The Western blotting using specific antibodies was used for the detection of TLR4, PI3K, AKT, mTOR, and IKK protein expression. Data represent mean ± SD of six mice; # p < 0.05, ## p < 0.01, and ### p < 0.001 were compared with sample of control group (one-way ANOVA followed by Scheffe’s multiple range tests); ** p < 0.01, and *** p < 0.001, were compared with LPS-alone group.
Figure 9
Figure 9
HPLC profile of SS-1 (A); and scheme of its mechanism for the protective effect on LPS-induced inflammation (B). HPLC chromatogram of the polyphenol standards (500 μg/mL) at 280 nm. Peaks: 1. Protocatechuic acid (4.53 min); 2. Protocatechvaldehyde (5.73 min); 3. Caffeic acid (7.53 min); 4. Syringic acid (8.18 min); 5. DTA (9.89 min); and 6. DBL (12.3 min). Representative chromatograms of SS-1 are shown: 1. Protocatechuic acid (96.8 μg/mg extract); 2. Protocatechvaldehyde (57.2 μg/mg extract); 3. Caffeic acid (59.3 μg/mg extract); 4. Syringic acid (42.6 μg/mg extract); 5. DTA (2,5-dihydroxyterephtalic acid, 80.7 μg/mg extract); and 6. DBL (3,4-dihydroxybenzalacetone, 90.2 μg/mg extract).
Figure 9
Figure 9
HPLC profile of SS-1 (A); and scheme of its mechanism for the protective effect on LPS-induced inflammation (B). HPLC chromatogram of the polyphenol standards (500 μg/mL) at 280 nm. Peaks: 1. Protocatechuic acid (4.53 min); 2. Protocatechvaldehyde (5.73 min); 3. Caffeic acid (7.53 min); 4. Syringic acid (8.18 min); 5. DTA (9.89 min); and 6. DBL (12.3 min). Representative chromatograms of SS-1 are shown: 1. Protocatechuic acid (96.8 μg/mg extract); 2. Protocatechvaldehyde (57.2 μg/mg extract); 3. Caffeic acid (59.3 μg/mg extract); 4. Syringic acid (42.6 μg/mg extract); 5. DTA (2,5-dihydroxyterephtalic acid, 80.7 μg/mg extract); and 6. DBL (3,4-dihydroxybenzalacetone, 90.2 μg/mg extract).

References

    1. Liu Y., Wu H., Nie Y.C., Chen J.L., Su W.W., Li P.B. Naringin attenuates acute lung injury in LPS-treated mice by inhibiting NF-κB pathway. Int. Immunopharmacol. 2011;11:1606–1612. doi: 10.1016/j.intimp.2011.05.022. - DOI - PubMed
    1. Niu N., Li B., Hu Y., Li X., Li J., Zhang H. Protective effects of scoparone against lipopolysaccharide-induced acute lung injury. Int. Immunopharmacol. 2014;23:127–133. doi: 10.1016/j.intimp.2014.08.014. - DOI - PubMed
    1. Huang K.L., Chen C.S., Hsu C.W., Li M.H., Chang H., Tsai S.H., Chu S.J. Therapeutic effects of baicalin on lipopolysaccharide-induced acute lung injury in rats. Am. J. Chin. Med. 2008;36:301–311. doi: 10.1142/S0192415X08005783. - DOI - PubMed
    1. Tsai C.L., Lin Y.C., Wang H.M., Chou T.C. Baicalein, an active component of Scutellaria baicalensis, protects against lipopolysaccharide-induced acute lung injury in rats. J. Ethnopharmacol. 2014;153:197–206. doi: 10.1016/j.jep.2014.02.010. - DOI - PubMed
    1. Huang C.H., Yang M.L., Tsai C.H., Li Y.C., Lin Y.J., Kuan Y.H. Ginkgo biloba leaves extract (EGb-761) attenuates lipopolysaccharide-induced acute lung injury via inhibition of oxidative stress and NF-κB-dependent matrix metalloproteinase-9 pathway. Phytomedicine. 2013;20:303–309. doi: 10.1016/j.phymed.2012.11.004. - DOI - PubMed

MeSH terms

LinkOut - more resources