. 2017 Feb 16;542(7641):362-366.
doi: 10.1038/nature21064. Epub 2017 Feb 8.

Synthetic vulnerabilities of mesenchymal subpopulations in pancreatic cancer

Affiliations

Synthetic vulnerabilities of mesenchymal subpopulations in pancreatic cancer

Giannicola Genovese et al. Nature. .

Abstract

Malignant neoplasms evolve in response to changes in oncogenic signalling. Cancer cell plasticity in response to evolutionary pressures is fundamental to tumour progression and the development of therapeutic resistance. Here we determine the molecular and cellular mechanisms of cancer cell plasticity in a conditional oncogenic Kras mouse model of pancreatic ductal adenocarcinoma (PDAC), a malignancy that displays considerable phenotypic diversity and morphological heterogeneity. In this model, stochastic extinction of oncogenic Kras signalling and emergence of Kras-independent escaper populations (cells that acquire oncogenic properties) are associated with de-differentiation and aggressive biological behaviour. Transcriptomic and functional analyses of Kras-independent escapers reveal the presence of Smarcb1-Myc-network-driven mesenchymal reprogramming and independence from MAPK signalling. A somatic mosaic model of PDAC, which allows time-restricted perturbation of cell fate, shows that depletion of Smarcb1 activates the Myc network, driving an anabolic switch that increases protein metabolism and adaptive activation of endoplasmic-reticulum-stress-induced survival pathways. Increased protein turnover renders mesenchymal sub-populations highly susceptible to pharmacological and genetic perturbation of the cellular proteostatic machinery and the IRE1-α-MKK4 arm of the endoplasmic-reticulum-stress-response pathway. Specifically, combination regimens that impair the unfolded protein responses block the emergence of aggressive mesenchymal subpopulations in mouse and patient-derived PDAC models. These molecular and biological insights inform a potential therapeutic strategy for targeting aggressive mesenchymal features of PDAC.


Conflict of interest statement

The authors declare no competing financial interests.

Figures

Extended Data Figure 1 |
Extended Data Figure 1 |. Molecular characterization of escaper clones.
a, Schematic representation of the experimental workflow. Pancreatic epithelial cells (PEC) were isolated from KrasG12D-mutant pancreata and cultured ex vivo under the selective pressure of oncogenic stress. Serial passaging resulted in two different outputs: senescence or the establishment of escaper clones. b, Representative panels of senescence-associated β-galactosidase staining in pancreatic epithelial cells at passages P4 and P7. c, Far left, representative sections of escaper-derived tumours, haematoxylin and eosin stained, displaying mesenchymal-like or epithelial morphology. Insets show the morphology of the original clone in 2D culture. Mid-left to far right, immunohistochemical staining for the EMT markers vimentin, nestin and CDH1, respectively, in tumours derived from EPI and MS-L transplants. d, Assessment of clonogenic growth in 3D in vitro (n = 4 per group). Data are mean ± s.d. of technical replicates (one representative experiment of three). MS-L cells show an enhanced ability to form spheres in methylcellulose-based semi-solid culture medium. e, TIC frequency of EPI and MS-L cells as assessed by limiting dilution experiments in immunocompromised (NCr Nude) mice. Two individual clones per group were tested (EPI#1: n = 19, EPI#2: n = 23, MS-L#1: n = 20, MS-L#2: n = 20). TIC was calculated using the L-Calc software. Data are the mean proportion of TICs ± s.e.m. ***P < 0.001, ****P < 0.0001 by two-tailed chi-squared test. f, Representative pictures of livers from mice orthotopically injected with EPI or MS-L cells. g, Volcano plot showing the number of differentially expressed genes between EPI and MS-L escapers. h, GSEA enrichment analysis plots for gene sets upregulated in EPI (top) and MS-L (bottom) escaper cells. EPI escapers display enrichment for Kras- and Mek-driven transcriptomic gene signatures, MS-L escapers are characterized by the perturbation of transcriptomic targets of the SWI/SNF chromatin remodelling factor Smarcb1 and dysregulation of genetic programs involved in progression through the cell cycle. i, Immunohistochemical profile of EPI and MS-L escapers and validation of the transcriptomic analysis. EPI escapers exhibit robust MAPK signalling, as assessed with antibodies specific for phospho-p44/42 MAPK (ERK1/2) (Thr202/Tyr204) and phospho-MEK1/2 (Ser221); by contrast, MS-L escapers display a lack of MAPK signalling activation, downregulation of SMARCB1 levels and an increase in the proliferative index assessed by Ki67 staining. Scale bars: 100 μm (c, i).
Extended Data Figure 2 |
Extended Data Figure 2 |. Isolation and functional characterization of epithelial and mesenchymal clones from primary tumours in a conditional reporter GEMM of PDAC.
a, Schematic model of the GEMM. KrasG12DLSL/+-Tp53LoxP/LoxP-Pdx1-Cre (KPCΔ/Δ) mice were crossed with a strain expressing a lineage-tracing fluorescent reporter (R26mTmG) and a strain expressing a Cdh1Cfp reporter, in which CFP (cyan fluorescent protein) is expressed as a fusion protein with endogenous E-cadherin to generate the KPCΔ/Δ-R26mTmG/+-Cdh1Cfp/+ dual-reporter model of PDAC. This system allows the isolation of GFP-positive malignant cells and the separation of CFPhigh (epithelial) from CFPlow (mesenchymal) sub-populations. b, FACS experiment showing the distribution of CFPhigh and CFPlow sub-populations in both the GFP+ (tumour cells) compartment and the TdTomato+ (stromal) compartment. The reporter shows an absence of CFP+ cells in the stromal (TdTomato+) compartment and a spectrum of sub-populations in the tumour (GFP+) compartment. c, Western blot analysis of the expression levels of SMARCB1 in the GFP+CFPhigh and GFP+CFPlow sub-populations. Vinculin was used as loading control. d, Representative sections showing the levels of SMARCB1, CDH1 and phospho-ERK1/2 in orthotopic transplants of malignant sub-populations, isolated as described above. MS-L-derived transplants were used as controls. e, In vivo characterization of the PDAC sub-populations in the KPCΔ/Δ-R26mTmG/+ model of PDAC. Immunofluorescence staining for GFP, SMARCB1, phospho-ERK1/2 and nestin in PDAC originated in the KPCΔ/Δ-R26mTmG/+ background strain. Low levels of SMARCB1 and phospho-ERK1/2 and high levels of nestin are a hallmark of the sub-population of invasive GFP+ cells. Scale bars: 100 μm (d; e, bottom nine panels), 20 μm (e, top four panels). For gel source data, see Supplementary Figures.
Extended Data Figure 3 |
Extended Data Figure 3 |. Functional characterization of a Kras/Smarcb1 axis in the maintenance of epithelial identity and in mesenchymal reprograming.
a, RNAi-mediated knockdown of Kras in EPI-derived orthotopic transplants achieved with a lentiviral-based technology results in aggressive tumours that faithfully recapitulate the biological behaviour of MS-L transplants. Kaplan–Meier survival analysis of NCr Nude mice transplanted with MS-L escapers and EPI escapers transduced with either shCtrl or shKras constructs (n = 5 per group). Tumours emerging in the Kras-depleted group display longer latencies; however, once established, they faithfully recapitulate the behaviour of MS-L tumours in secondary transplants. b, TIC frequencies for shCtrl and shKras reprogrammed EPI escapers assessed by limiting dilution transplantation studies in immunocompromised (NCr Nude) mice (EPI and shCtrl: n = 27; EPI and shKras: n = 25) and calculated using the L-Calc software. Data are the mean proportion of TICs ± s.e.m. c, Transcript levels for Kras and Smarcb1 in EPI cells transduced with shCtrl or shKras constructs assessed by qPCR 96 h after transduction. RNAi-mediated depletion of Kras results in an acute drop in the levels of Smarcb1 (n = 3). Data are mean ± s.d. of technical replicates (one representative experiment out of three). d, Immunohistochemical quantification of the levels of phospho- ERK1/2 and SMARCB1 in tumours generated by EPI cells transduced with shCtrl or shKras constructs. Depletion of Kras results in tumours characterized by lack of activation of the MAPK signalling and a profound drop in the levels of nuclear SMARCB1. e, Western blot analysis of the expression of SMARCB1, E-cadherin (CDH1) and nestin in EPI, MS-L clones and EPI clones re-programmed with lentiviral-based shRNAs against Smarcb1 (sh1 and sh855). Vinculin was used as loading control. f, Liver-seeding assay for the quantification of metastatic potential. Liver weight of NCr Nude mice that receievd an intra-splenic injection of EPI cells infected with a lentiviral vector harbouring a control shRNA or a shRNA against Smarcb1 (sh855). MS-L cells were used as positive controls (n = 5 per group). Data are mean ± s.d. of biological replicates. RNAi-mediated ablation of Smarcb1 results in higher metastatic burden. g, Kaplan–Meier analysis of survival of NCr Nude mice orthotopically injected with EPI cells that were infected with a lentiviral vector harbouring a control shRNA or a shRNA against Smarcb1 (sh855). MS-L cells were used as positive control (n = 5 per group). h, Ablation of Smarcb1 in the pancreatic epithelia potently co-operates with mutant KrasG12D in driving aggressive tumours with full penetrance and a median latency of 5–7 weeks. Kaplan–Meier survival analysis. Pdx1-Cre-KrasG12DLSL/+-Smarcb1LoxP/LoxP (KSCΔ/Δ), n = 29; Pdx1-Cre-KrasG12DLSL/+-Tp53LoxP/+\LoxP (KPCΔ/Δ), n = 42; Pdx1-Cre-Smarcb1LoxP/LoxP (CSΔ/Δ), n = 21; Pdx1-Cre-KrasG12DLSL/+(KC), n = 36; Pdx1-Cre-KrasG12DLSL/+-Tp53LoxP/LoxP-Smarcb1LoxP/LoxP (KPSCΔ/Δ), n = 16). KSCΔ/Δ versus KC, P < 0.0001; KPSCΔ/Δ versus KSCΔ/Δ, P < 0.0001; KPSCΔ/Δ versus KPCΔ/Δ, P < 0.0001 by Mantel–Cox log-rank test. i, TIC frequency in Smarcb1-ablated tumours (KSCΔ/Δ, KPSCΔ/Δ) compared to the Smarcb1-proficient background (KPCΔ/Δ), as assessed by limiting-dilution transplantation experiments in NCr Nude mice (KPCΔ/Δ, n = 20; KSCΔ/Δ, n = 20; KPSCΔ/Δ, n = 18) and calculated using the L-Calc software. Data shown as the mean proportion of TICs ± s.e.m. j, Liver weight of NCr Nude mice receiving intra-splenic transplants of low-passage tumour cells isolated from KPCΔ/Δ-R26Cag-LSL-Luc/+, KSCΔ/Δ-R26Cag-LSL-Luc/+ and KPSCΔ/Δ-R26Cag-LSL-Luc/+ tumours (n = 10 per group). Data are mean ± s.d. of biological replicates. k, Top, representative luciferase images for liver-seeding assays described in j. The intensity of the signal is proportional to the metastatic burden. Colour scale bar is a reference for the intensity of the luminescence signal. Bottom panels show representative images of low-passages tumour cells in 2D. Original image magnification, ×20. Cells lacking Smarcb1 are loosely cohesive and characterized by a prominent mesenchymal morphology and a propensity for growth in suspension. l, Immunohistochemical profile of Smarcb1-deficient tumours (KSCΔ/Δ) compared to Smarcb1-proficient lesions (KC, KPCΔ/Δ) and wild-type (Wt) pancreata. Samples were stained for the EMT markers vimentin, nestin and CDH1. Normal wild-type pancreata, pre-neoplastic lesions from the KC background and PDAC from the KPCΔ/Δ background were used as controls. At 8–10 weeks old, mice were killed and pancreata/pancreatic lesions were collected. Hallmarks of Smarcb1-ablated tumours are the complete loss of CDH1 and the robust expression of the mesenchymal markers vimentin and nestin when compared to neoplastic and pre-malignant lesions originating in the Smarcb1-proficient backgrounds (KC and KPCΔ/Δ). m, Histopathological grade distribution in conditional GEMMs of PDAC (KPCΔ/Δ, n = 28; KSCΔ/Δ, n = 29; KPSCΔ/Δ, n = 15). n, Spherogenic potential of low-passage spheroids obtained from tumours arising in the KPCΔ/Δ, KSCΔ/Δ and KPSCΔ/Δ genetic background (n = 3 per group). Data are mean ± s.d. of technical replicates (one representative experiment out of three). o, Representative gross image of a KSCΔ/Δ mouse at necropsy. p, FACS analysis for the putative stem-cell marker aldefluor in freshly isolated tumour cells from the KC, KPCΔ/Δ, KSCΔ/Δ and KPSCΔ/Δ backgrounds. Diethylaminobenzaldehyde-treated cells were used as negative control. Smarcb1-deficient cells display a robust increase in the relative number of aldefluor positive cells. For gel source data see Supplementary figures. NS, not significant; *P < 0.05, ** P < 0.01, *** P < 0.001, ****P < 0.0001, by Mantel–Cox log-rank test (a, g), two-tailed chi-squared test (b, i), unpaired two-tailed t-test (f, j) or two-tailed Fisher’s exact test (m). Scale bars: 100 μm (d, l).
Extended Data Figure 4 |
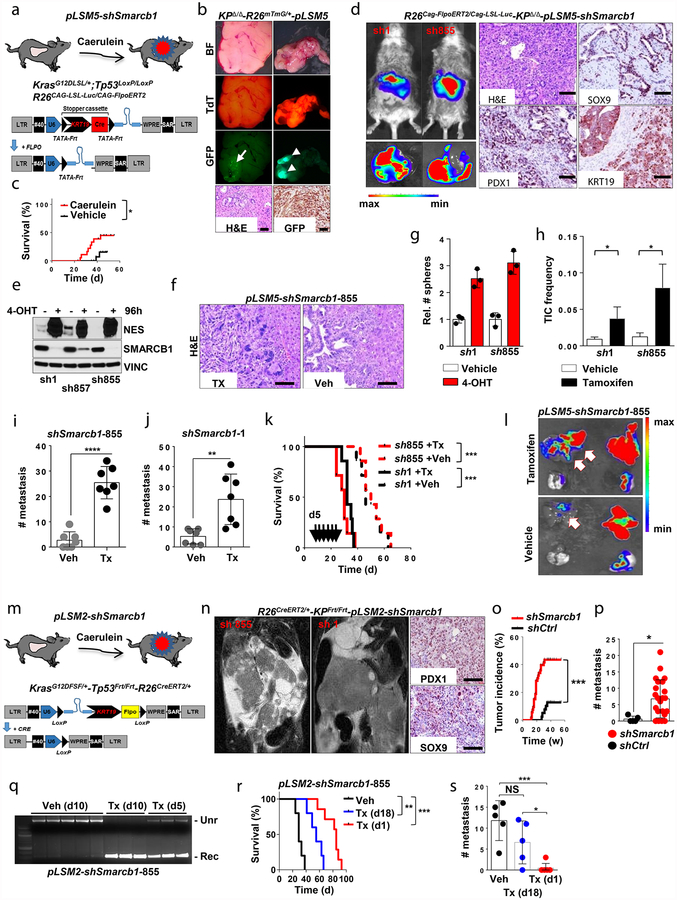
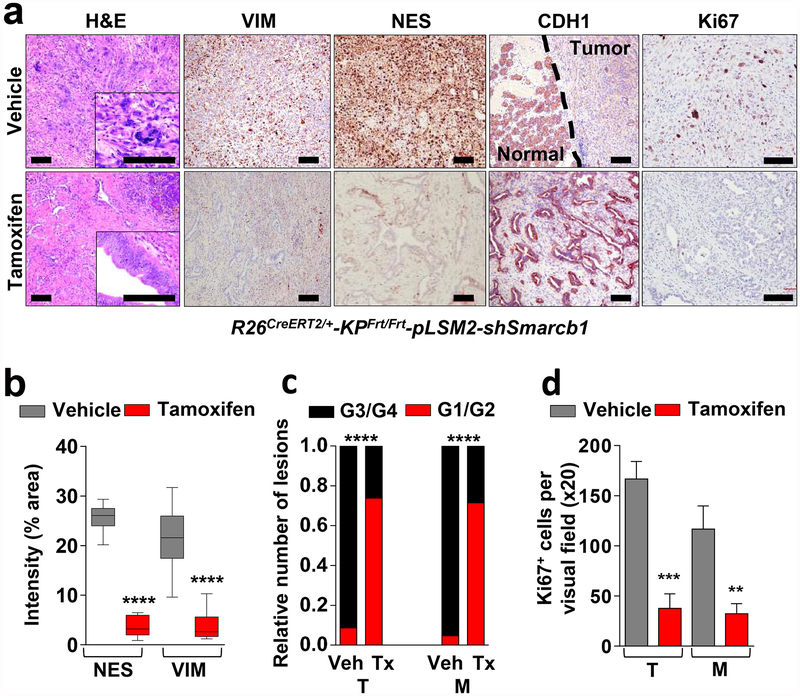
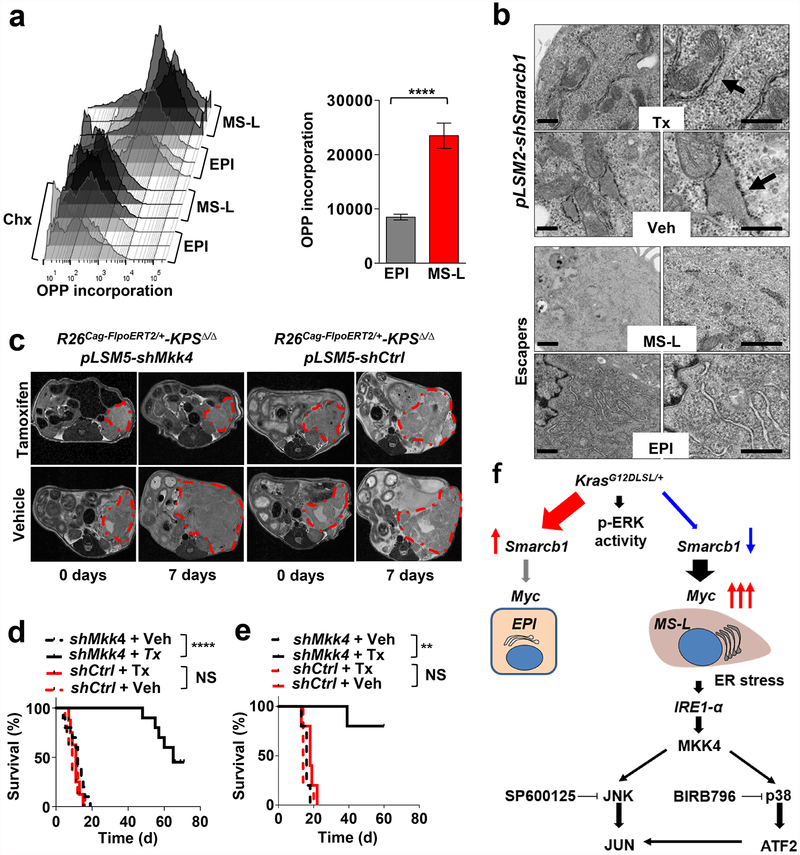
Extended Data Figure 4 |. Smarcb1 restrains the expansion of mesenchymal clones in PDAC.
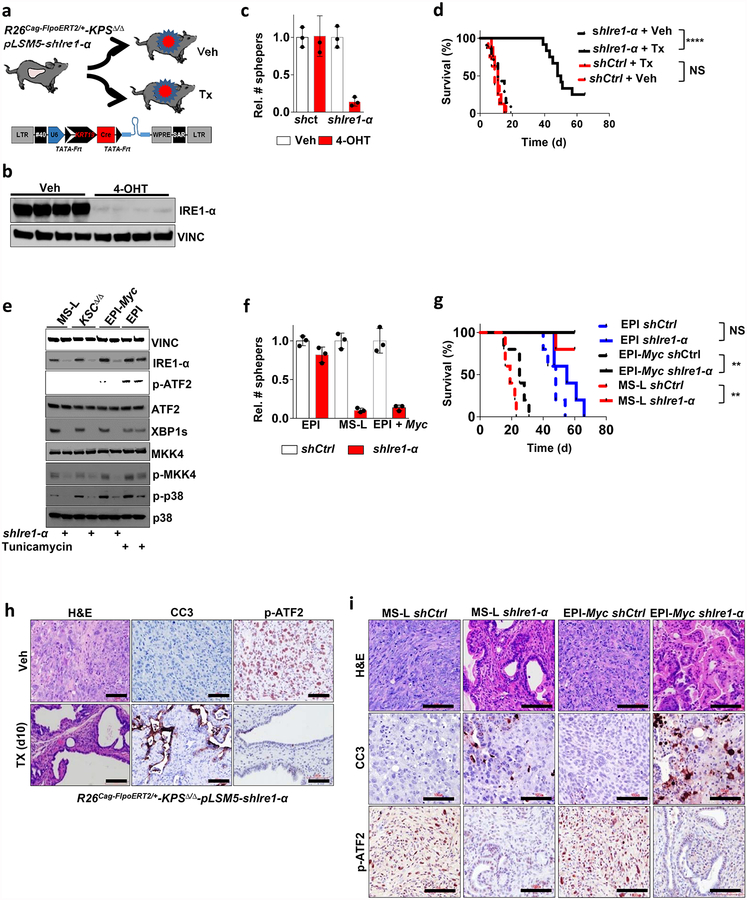
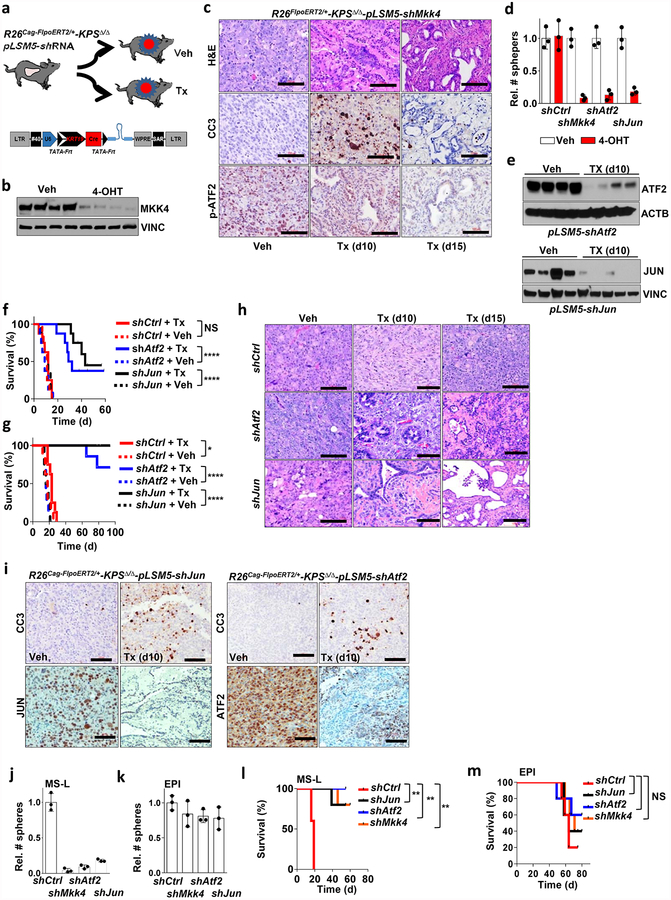
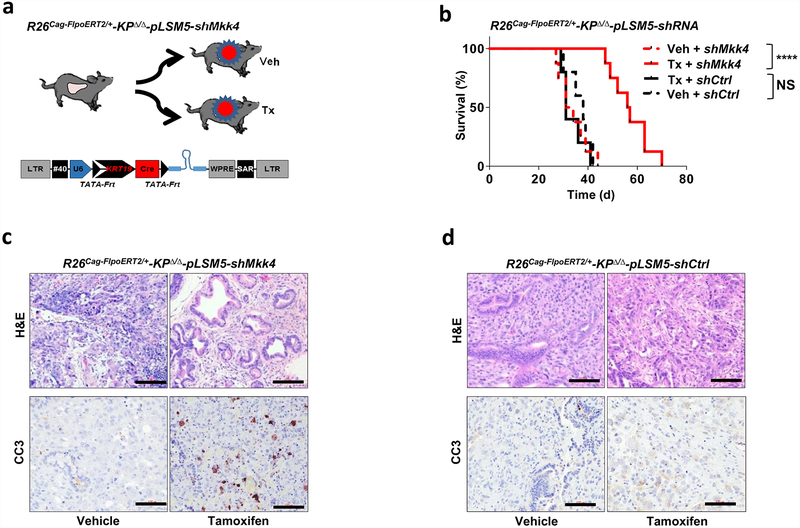
a, Schematic showing the lentiviral construct for Flpo-mediated tissue-specific, time-restricted gene inactivation in vivo (pLSM5). High-titre-purified lentiviral particles (2–5 × 10⁸ IU) were introduced surgically into the tail of the pancreas. At 7 days after surgery, mice were treated with caerulein to induce inflammation, proliferation and the expression of genes under the Krt19 promoter in the acinar compartment. The tissue specificity is provided by the human Krt19 promoter driving the expression of the Cre recombinase resulting in the activation of the latent mutant KrasG12DLSL/+, the inactivation of the conditional Tp53LoxP allele and the activation of the R26CAG-LSL-Luc reporter. The time-restricted activation of the shRNA is mediated by the ubiquitous R26Cag-FlpoERT2 inducible, codon-optimized Flpo recombinase upon tamoxifen treatment and removal of the Krt19-Cre stopper cassette, which is flanked by TATA-Frt sites. b, Representative panels showing the gross appearance of pancreata of KPΔ/Δ-R26mTmG/+ mice orthotopically injected with 108 viral particles, treated with caerulein 7 days after surgery and killed at the 3 weeks (left) or 3 months (right). Arrow indicates mosaic activation of the GFP reporter at 3 weeks. Arrowhead indicates GFP+ tumour nodules at 3 months. TdT, TdTomato. c, Kaplan–Meier analysis of tumour incidence in KPΔ/Δ-R26mTmG/+ mice orthotopically injected with 108 particles of the pLSM5-K19-Cre vector and assigned to caerulein and vehicle treatment. Caerulein treatment resulted in increased tumour incidence and decreased latency when compared to vehicle control (n = 18 per group). d, Representative luciferase images (left) and pathological characterization (right) of tumours generated with lentiviral-mosaic-somatic technology (R26Cag-FlpoERT2/Cag-LSL-Luc-KPΔ/Δ-pLSM5-shSmarcb1-1 or R26Cag-FlpoERT2/Cag-LSL-Luc-KPΔ/Δ-pLSM5-shSmarcb1-855). Orthotopic tumours harbouring latent Flpo/Frt-dependent, tamoxifen-inducible shRNAs against Smarcb1 were generated into a Kras-mutant, Tp53-deficient background (KPΔ/Δ). Mice were monitored weekly for tumour growth by bioluminescence imaging and lesions were characterized by immunophenotypic analysis for pancreatic lineage-differentiation markers before functional studies. e, Expression levels of SMARCB1 and nestin in short-term cultures established from tumours generated in R26Cag-FlpoERT2/Cag-LSL-Luc-KPΔ/Δ-pLSM5-shSmarcb1 mice assessed by western blot. Protein lysates were collected 96 h after 4-OHT (4-hydroxytamoxifen) treatment. Vinculin was used as loading control. f, Representative images of liver metastasis stained for haematoxylin and eosin from tamoxifen- and vehicle-treated R26Cag-FlpoERT2/Cag-LSL-Luc-KPΔ/Δ-pLSM5-shSmarcb1-855 mice. Tamoxifen-driven acute ablation of Smarcb1 in vivo results in poorly differentiated, invasive lesions. g, Spherogenic potential of low-passage spheroids obtained from R26Cag-FlpoERT2/Cag-LSL-Luc- KPΔ/Δ-pLSM5-shSmarcb1-1 and R26Cag-FlpoERT2/Cag-LSL-Luc-KPΔ/Δ-pLSM5-shSmarcb1-855 tumours upon treatment with 4-hydroxytamoxifen or vehicle control (n = 3 per group). Data are mean ± s.d. of technical replicates (one representative experiment out of three). The acute ablation of Smarcb1 results in a robust increase of the clonogenic potential in the KPΔ/Δ background. h, TIC frequency of KPΔ/Δ-R26Cag-FlpoERT2/Cag-LSL-Luc-pLSM5-shSmarcb1-1 and R26Cag-FlpoERT2/Cag-LSL-Luc-KPΔ/Δ-pLSM5-shSmarcb1-855 tumours upon treatment with vehicle or tamoxifen assessed by limiting-dilution experiments in immunocompromised (NCr Nude) mice (sh1 and vehicle, n = 25; sh1 and tamoxifen, n = 20; sh855 and vehicle, n = 19; sh855 and tamoxifen, n = 19) and calculated using the L-Calc software. Data are mean proportion of TIC ± s.e.m. i, j, Metastatic burden assesses by counting the number of superficial liver, peritoneal and lung metastases in NCr Nude mice transplanted orthotopically with R26Cag-FlpoERT2/Cag-LSL-Luc- KPΔ/Δ-pLSM5-shSmarcb1-1 or R26Cag-FlpoERT2/Cag-LSL-Luc-KPΔ/Δ-pLSM5-shSmarcb1-855 tumours assigned to vehicle or tamoxifen treatment. Acute ablation of Smarcb1 resulted in a higher metastatic burden (n = 7 per group). Data are mean ± s.d. of biological replicates. k, Kaplan–Meier survival analysis of NCr Nude mice orthotopically transplanted with R26Cag-FlpoERT2/Cag-LSL-Luc- KPΔ/Δ-pLSM5-shSmarcb1-1 or R26Cag-FlpoERT2/Cag-LSL-Luc-KPΔ/Δ-pLSM5-shSmarcb1-855 tumours (n = 7 per group). Tamoxifen treatment was started 5 days after surgery. Acute ablation of Smarcb1 resulted in more aggressive tumours and a significantly shorter overall survival. l, Representative ex-vivo bioluminescence images in NCr Nude mice orthotopically transplanted with R26Cag-FlpoERT2/Cag-LSL-Luc-KPΔ/Δ-pLSM5-shSmarcb1-855 tumours and assigned to vehicle or tamoxifen treatment. Arrows indicate metastatic liver disease. m, Schematic showing the lentiviral construct for Cre-mediated, tissue-specific, time-restricted restoration of a gene of interest in vivo (pLSM2). High-titre-purified lentiviral particles (2–5 × 10⁸ IU) are introduced surgically into the pancreas of KrasG12DFSF/+-Tp53Frt/Frt-R26CreERT2/+ mice to generate the R26CreERT2/+-KPFrt/Frt-pLSM2-shSmarcb1 model. 7 days after surgery, mice were treated with caerulein. The tissue specificity is provided by the human Krt19 promoter, which drives the expression of the Flpo recombinase, resulting in the activation of the latent mutant KrasG12DFSF/+ and the inactivation of the conditional Tp53Frt allele along with the constitutive expression of an shRNA under the U6 promoter. The time-restricted restoration of the gene of interest is mediated by the R26CreERT2 ubiquitous CreERT2 strain upon tamoxifen treatment and removal of the cassette containing the shRNA flanked by LoxP sites. n, Left, T2-weighted MRI scans of tumour-bearing mice 19 weeks after orthotopic injection with the pLSM2 lentiviral system carrying two shRNAs specific for murine Smarcb1. The tumours extensively invade the abdominal cavity. Right, immuno-phenotype of a tumour induced with pLSM2-shSmarcb1. Poorly cohesive, undifferentiated tumour cells express the pancreatic-specific markers Pdx1 and Sox9, suggestive of a pancreatic epithelial cell of origin. o, Kaplan–Meier analysis of tumour incidence in R26CreERT2/+-KPFrt/Frt mice challenged with orthotopic injections of the pLSM2-shSmarcb1 and pLSM2-shCtrl constructs. Knockdown of Smarcb1 in the mosaic model system results in higher penetrance and shorter latency (R26CreERT2/+-KPFrt/Frt-pLSM2-shSmarcb1, n = 53; R26CreERT2/+-KPFrt/Frt-pLSM2-shCtrl, n = 39). p, Quantification of the metastatic burden in R26CreERT2/+-KPFrt/Frt-pLSM2-shSmarcb1 mice versus R26CreERT2/+-KPFrt/Frt-pLSM2-shCtrl mice, assessed by counting the combined number of liver, lung and peritoneal metastases (R26CreERT2/+-KPFrt/Frt-pLSM2-shSmarcb1, n = 23; R26CreERT2/+-KPFrt/Frt-pLSM2-shCtrl, n = 5). Data are mean ± s.d. of biological replicates. q, PCR from recombined and un-recombined genomic DNA isolated from vehicle- and tamoxifen-treated tumour-bearing mice. Genomic DNA was extracted 5 and 10 days after treatment in vivo. r, Kaplan–Meier survival analysis of R26CreERT2/+-KPFrt/Frt-pLSM2-shSmarcb1 tumours transplanted orthotopically in syngeneic C57BL/6 recipient mice (n = 5 per vehicle and d18 groups, n = 7 per d1 group). Early tamoxifen treatment and Smarcb1 restoration resulted in a significant and durable improvement in survival. s, Metastatic burden was estimated by counting the number of liver, peritoneal and lung metastasis in the experimental cohorts described in r (n = 5 per vehicle and Txd18 groups, n = 7 per Txd1 group). The early restoration of Smarcb1 greatly reduced the number of metastatic foci, suggesting that its deficiency is a requirement in tumour dissemination. Data are mean ± s.d. of biological replicates. NS, not significant; *P < 0.05, **P < 0.01, ***P < 0.001, ****P < 0.0001, by Mantel–Cox log-rank test (c, k, o, r), two-tailed chi-squared test (h) or unpaired two-tailed t-test (i, j, p, s). Scale bars: 100 μm (b, d, f, n). For gel source data, see Supplementary Figures.
Extended Data Figure 5 |
Extended Data Figure 5 |. Transcriptomic and proteomic profiles of mesenchymal tumours.
a, The robust-multi-array-average-normalized probe signal levels from microarray data for each gene previously identified as pancreatic cancer classifiers. Smarcb1-ablated tumours and mesenchymal clones display enrichment for the QM-PDA gene signature. b, Acute restoration of Smarcb1 in pancreatic tumours generated in R26CreERT2/+-KPFrt/Frt-pLSM2-shSmarcb1-855 mice results in the dysregulation of Myc transcriptomic targets and genes involved in global protein metabolism and global response to stress. Heat maps show the enrichment for specific gene ontology pathways in vehicle-treated tumours when compared with tamoxifen-treated, Smarcb1-restored tumours. Lesions were collected 10 days after treatment. c, Myc transcriptomic targets and genes involved in global protein metabolism and response to stress are enriched in MS-L escaper clones. d, Quantification of protein biosynthesis by OPP-incorporation analysis using FACS. Representative plots from Smarcb1-ablated and restored cultures established from GEMM-derived tumours. Cycloheximide (Chx)-treated cultures were used as negative controls. e, Western blot analysis for SMARCB1, Myc and ER-stress-response pathway proteins from independent tumours upon tamoxifen-mediated Smarcb1 restoration compared to vehicle controls and tumours generated from EPI and MS-L escapers. Vinculin was used as loading control. Tumours generated with the somatic technology were harvested 10 days after tamoxifen or vehicle treatment. Robust activation of the IRE1-α/MKK4 and IRE1-α/XBP-1 pathways is readily apparent. f, GSEA scores for the Atf2 signature in Smarcb1-ablated/deficient models. Left, vehicle versus tamoxifen-treated R26CreERT2/+-KPFrt/Frt-pLSM2-shSmarcb1-855 tumour-bearing mice; right, Atf2 gene-signature enrichment in MS-L escapers as compared to EPI. g, Immunohistochemical analysis of protein expression for SMARCB1, phospho-ATF2, and JUN in surgically resected human PDAC samples with high and low levels of SMARCB1. Images are of representative sections; scale bars: 100 μm. h, Kaplan–Meier analysis of survival in surgically resected PDAC patients with available follow-up data segregated according to the expression levels of phospho-ATF2 (phospho-ATF2 score, 2–3+, n = 55; phospho-ATF2 score, 0–1, n = 79). Activation of the stress-response factor ATF2 results in reduced post-operative survival. P < 0.0001 by Mantel–Cox log-rank test. i, Bar plots for the relative abundance of phospho-ATF2 immuno-staining in SMARCB1-deficient and SMARCB1-proficient human pancreatic cancer. An inverse correlation in the expression levels of SMARCB1 and phospho-ATF2 in human PDAC is apparent (SMARCB1+ n = 138, SMARCB1 n = 16). P < 0.0001 by two-tailed Fisher’s exact test. For gel source data, see Supplementary Figures.
Extended Data Figure 6 |
Extended Data Figure 6 |. The proto oncogene Myc is a master regulator in the Smarcb1 transcriptomic network.
a, Schematic model of Myc-rescue experiments. Short-term cultures from R26CreERT2/+-KPFrt/Frt-pLSM2-shSmarcb1-855 tumours were transduced with a Myc-expressing lentiviral vector and briefly selected. A LacZ expression vector was used as negative control. Cells were injected orthotopically into syngeneic mice assigned to either tamoxifen or vehicle treatment. b, Kaplan–Meier analysis of survival in mice transplanted with R26CreERT2/+-KPFrt/Frt-pLSM2-shSmarcb1-855 tumours rescued with Myc or LacZ and assigned to vehicle or tamoxifen treatment (n = 5 per group). c, Quantification of nestin+ areas in LacZ-control and Myc-reprogrammed R26CreERT2/+-KPFrt/Frt-pLSM2-shSmarcb1-855 tumours (n = 12 per group). Enforced expression of Myc resulted in a marked increase in the number of nestin+ cells per section and in the maintenance of a mesenchymal state. Data are mean ± s.d. of biological replicates. d, Representative haematoxylin and eosin (left) and nestin staining (right) of R26CreERT2/+-KPFrt/Frt-pLSM2-shSmarcb1-855 tumours rescued with Myc or LacZ. Myc overexpression keeps the cells in a mesenchymal state upon tamoxifen treatment. e, Myc overexpression rescues the steady-state levels of protein biosynthesis in Smarcb1-restored cells assessed by OPP incorporation and FACS analysis from freshly isolated tumour cells. f, Representative haematoxylin and eosin (left) and nestin staining (right) from EPI cells transduced with Myc or LacZ. Myc overexpression fully reprograms EPI clones, generating anaplastic, mesenchymal tumours. g, Kaplan–Meier analysis of survival in mice transplanted with EPI cells transduced with Myc or LacZ. MS-L cells were used as positive controls (n = 5 per group). Myc transduced EPI transplants faithfully recapitulate the aggressive behaviour of MS-L tumours. h, Functional rescues studies using a Myc- or LacZ-expressing vector. Western blot analysis showing that the sustained overexpression of Myc in Smarcb1 restored cells and in EPI clones engages the Jnk/Atf2 stress response pathway. Vinculin was used as loading control. i, Representative TEM sections from Smarcb1-proficient and Smarcb1-deficient tumours generated with the somatic conditional model and the stochastic model and rescued with Myc and LacZ, respectively. The sustained overexpression of Myc fully rescues the ultra-structural findings observed in the Smarcb1-deficient settings. Arrow indicates cytoplasmic fibres. NS, not significant; **P < 0.01, ****P < 0.001, by Mantel–Cox log-rank test (b, g) or unpaired two-tailed t-test (c). Scale bars: 100 μm (d, f); 4 μm (i, ×5,000); 500 nm (i, ×25,000). For gel source data, see Supplementary Figures.
Extended Data Figure 7 |
Extended Data Figure 7 |. Genetic extinction of the ER-stress response pathway is lethal in Smarcb1-deficient PDAC.
a, Orthotopic primary tumours harbouring latent Flpo/Frt-dependent, tamoxifen-inducible shRNAs against Ern1 (shown as Ire1-α) were generated into the KPSΔ/Δ background (R26Cag-FlpoERT2/+-KPSΔ/Δp-LSM5-shIre1α or R26Cag-FlpoERT2/+-KPSΔ/Δ-pLSM5-shCtrl). Mice with palpable masses were assigned to tamoxifen or vehicle treatment. b, Western blot analysis of short-term cultures established from the model described above. 4-Hydroxytamoxifen treatment results in the robust knockdown of Ern1. Lysates were harvested 96 h after 4-hydroxytamoxifen treatment. Vinculin was used as loading control. c, Spherogenic assay after acute RNAi-mediated depletion of Ern1 achieved by 4-hydroxytamoxifen treatment (n = 3 per group). Impairment of clonal growth is observed in 4-hydroxytamoxifen-treated, Ern1-depleted spheroids as compared to vehicle-treated cells and shCtrl. Data are mean ± s.d. of technical replicates (one representative experiment out of three). d, Kaplan–Meier survival analysis of R26Cag-FlpoERT2/+-KPSΔ/Δ-pLSM5-shIre1α and R26Cag-FlpoERT2/+-KPSΔ/Δ-pLSM5-shCtrl GEMMs after tamoxifen treatment. Continuous line, tamoxifen-treated mice; interrupted line, vehicle-treated mice (shErn1 and vehicle, n = 7; shErn1 and tamoxifen, n = 12; shCtrl and vehicle, n = 8; shCtrl and tamoxifen, n = 8). Ern1 extinction results in a robust improvement in overall survival. e, Western blot analysis showing that the RNAi-mediated ablation of Ern1 in a Smarcb1-deficient background and in Myc-reprogrammed EPI cells results in a marked decrease in the activity of Mkk4 kinase and its downstream effectors. Vinculin was used as loading control. Ern1 has an essential role in the engagement of the stress response pathway. Tunicamycin-treated EPI cells were used as positive control. f, Spherogenic assay for EPI, MS-L escapers and EPI-Myc escapers upon RNAi-mediated genetic depletion of Ern1 (n = 3 per group). Data are mean ± s.d. of technical replicates (one representative experiment out of three). g, Kaplan–Meier analysis of survival of NCr Nude mice orthotopically injected with EPI, MS-L and Myc-reprogrammed EPI cells expressing a lentiviral-based shErn1. Knockdown of Ern1 is lethal in MS-L- and Myc-EPI-derived tumours but shows no effect in EPI tumours transduced with LacZ (n = 5 per group). h, Histological analysis of primary pancreatic tumours from the R26Cag-FlpoERT2/+-KPSΔ/Δ-pLSM5-shIre1α GEMM treated with tamoxifen or vehicle. Depletion of Ern1 in Smarcb1-deficient tumours results in a profound apoptotic response (assessed by staining for cleaved caspase-3 (CC3)) and in residual epithelial remnants. Engagement of the JNK/p38 pathway in vivo was assessed by phospho-Atf2 staining. i, Histological analysis of pancreatic tumours resulting from orthotopic transplants of MS-L or EPI-Myc cells transduced with shIre1α or shCtrl vectors. Depletion of Ern1 in MS-L and Myc-EPI tumours results in a profound apoptotic response (assessed by staining for CC3) and in residual epithelial remnants. NS, not significant; **P < 0.01, ****P < 0.0001, by Mantel–Cox log-rank test (d, g). Scale bars: 100 μm (h, i). For gel source data, see Supplementary figures.
Extended Data Figure 8 |
Extended Data Figure 8 |. Genetic extinction of the JNK/p38 stress response pathway is lethal in a Smarcb1-deficient context.
a, Orthotopic tumours harbouring latent Flpo/Frt-dependent, tamoxifen-inducible shRNAs against Mkk4, Atf2 and Jun were generated in the KPSΔ/Δ mouse background (R26Cag-FlpoERT2/+-KPSΔ/Δ-pLSM5-shMkk4, R26Cag-FlpoERT2/+-KPSΔ/Δ-pLSM5-shAtf2, R26Cag-FlpoERT2/+-KPSΔ/Δ-pLSM5-shJun, andR26Cag-FlpoERT2/+-KPSΔ/Δ-pLSM5-shCtrl). Tumour-bearing mice were assigned to tamoxifen or vehicle treatment. b, Western blot analysis for MKK4 levels in ex vivo cultures generated from R26Cag-FlpoERT2/+-KPSΔ/Δ-pLSM5-shMkk4 tumours. Protein lysates were isolated 96 h after vehicle or 4-hydroxytamoxifen treatment. Vinculin was used as loading control. c, Histological analysis of primary tumours from the R26Cag-FlpoERT2/+-KPSΔ/Δ-pLSM5-shMkk4 backgrounds treated with vehicle or tamoxifen and collected after 10 or 15 days of treatment. Engagement of the Jnk/p38/Atf2 pathway and apoptosis were assessed by phospho-Atf2 and cleaved caspase 3 (CC3) staining, respectively. d, Spherogenic assays for short-term spheroid cultures generated from the R26Cag-FlpoERT2/+-KPSΔ/Δ-pLSM5-shMkk4, R26Cag-FlpoERT2/+-KPSΔ/Δ-pLSM5-shAtf2, R26Cag-FlpoERT2/+-KPSΔ/Δ-pLSM5-shJun, and R26Cag-FlpoERT2/+-KPSΔ/Δ-pLSM5-shCtrl tumours (n = 3 per group). Treatment with 4-hydroxytamoxifen results in the impairment of 3D growth. Data are mean ± s.d. of technical replicates (one representative experiment out of three). e, Knockdown efficiency of Atf2 and Jun in tumour lysates collected after 10 days from tamoxifen treatment, as assessed by western blot. Vinculin and actin B were used as loading controls for Atf2 and Jun, respectively. f, g, Kaplan–Meier survival analysis of primary tumours (f) and orthotopic transplants (g) from R26Cag-FlpoERT2/+-KPSΔ/Δ-pLSM5-shAtf2, R26Cag-FlpoERT2/+-KPSΔ/Δ-pLSM5-shJun, andR26Cag-FlpoERT2/+-KPSΔ/Δ-pLSM5-shCtrl GEMMs. Continuous line, tamoxifen-treated mice; interrupted line, vehicle-treated mice (n = 8 per group). h, Histological analysis of primary tumours from the R26Cag-FlpoERT2/+-KPSΔ/Δ-pLSM5-shAtf2, R26Cag-FlpoERT2/+-KPSΔ/Δ-pLSM5-shJun, and R26Cag-FlpoERT2/+-KPSΔ/Δ-pLSM5-shCtrl tumour-bearing mice treated with vehicle or tamoxifen and collected at the beginning of the treatment, or after 10 or 15 days of treatment. i, Immunohistochemical analysis for Atf2, Jun and CC3 in sections obtained from R26Cag-FlpoERT2/+-KPSΔ/Δ-pLSM5-shAtf2 and R26Cag-FlpoERT2/+-KPSΔ/Δ-pLSM5-shJun tumour-bearing mice assigned to vehicle or tamoxifen treatment. Apoptosis was assessed by CC3 staining. Tumours were collected 10 days after the beginning of the treatment. j, k, Spherogenic assays for MS-L and EPI spheroids transduced with lentiviral shRNA specific for Mkk4, Jun or Atf2 (n = 3 per group). Knock-down of Mkk4, Jun or Atf2 impairs the growth potential in vitro of MS-L cells with minimal effects on EPI cells. Data are mean ± s.d. of technical replicates (one representative experiment out of three for both groups). l, m, Kaplan–Meier survival analysis of NCr Nude mice orthotopically transplanted with EPI and MS-L cells transduced with lentiviral shRNA specific for murine Mkk4, Atf2 and Jun. shCtrl vector transduced cells were used as negative control (n = 5 per group). NS, not significant; * P < 0.05, **P < 0.01, ****P < 0.0001, by Mantel–Cox log-rank test (f, g, l, m). Scale bars: 100 μm (c, h, i). For gel source data, see Supplementary Figures.
Extended Data Figure 9 |
Extended Data Figure 9 |. Genetic ablation of Mkk4 kinase delays tumour growth in the KPΔ/Δ background.
a, Orthotopic tumours harbouring latent Flpo/Frt-dependent, tamoxifen-inducible shRNAs against Mkk4 were generated in a Kras-mutant, Tp53-deficient, Smarcb1-intact background (KPΔ/Δ). Tumour-bearing mice were assigned to tamoxifen or vehicle treatment. b, Kaplan–Meier survival analysis of R26Cag-FlpoERT2/+-KPΔ/Δ-pLSM5-shMkk4 (n = 8 per group), and R26Cag-FlpoERT2/+-KPΔ/Δ-pLSM5-shCtrl (n = 5 per group) GEMMs. Continuous line, tamoxifen-treated mice; interrupted line, vehicle-treated mice. NS, not significant, ****P < 0.0001 by Mantel–Cox log-rank test. c, d, Histological analysis of primary tumours from the R26Cag-FlpoERT2/+-KPΔ/Δ-pLSM5-shMkk4 or control backgrounds treated with vehicle or tamoxifen and collected after 10 days of treatment. Apoptotic response was assessed by immunostaining for CC3. Scale bars: 100 μm.
Extended Data Figure 10 |
Extended Data Figure 10 |. Pharmacological manipulation of proteostasis is lethal in a Smarcb1-deficient genetic context.
a, b, In vitro 3D growth assay for Smarcb1-proficient and Smarcb1-deficient murine PDAC lines (n = 3 per group). Pharmacological treatment with proteasome and HSP90 inhibitors results in the marked impairment of clonogenic growth in Smarcb1-deficient background with limited efficacy in Smarcb1-proficient models. Data are mean ± s.d. of technical replicates (one representative experiment out of three). c, Kaplan–Meier survival analysis of NCr Nude mice orthotopically transplanted with Smarcb1-deficient and Smarcb1-proficient cells and treated with the HSP90 inhibitor AUY922 or vehicle control (EPI, MS-L, KC, KPCΔ/Δ, KPSCΔ/Δ: n = 5 per group; KSCΔ/Δ: n = 7 per group). P values were calculated using the Mantel–Cox log-rank test. d, Representative panels of Smarcb1-proficient (EPI) and Smarcb1-deficient (MS-L, KSCΔ/Δ, KPSCΔ/Δ) tumour-bearing mice treated with AUY922 or vehicle control; tumours were collected after 10 days of treatment. Top, haematoxylin and eosin staining. Bottom, CC3 staining, showing that impairment of the unfolded-protein response results in the induction of apoptotic cell death. Arrows indicate protein aggregates. e, Kaplan–Meier survival analysis of tumour-bearing mice transplanted orthotopically with Smarcb1-deficient KPSCΔ/Δ cells and assigned to one of four treatment arms: vehicle (n = 5); AUY922 (n = 5); BIRB796 and SP600125 (n = 5); or AUY922, BIRB796 and SP600125 (n = 10). **P < 0.01, ****P < 0.0001 by Mantel–Cox log-rank test. f, The apoptotic response associated with the treatments was assessed by CC3 staining. Stress-response engagement was assessed by phospho-Atf2 staining. g, Representative sections from orthotopic PDX transplants treated with gemcitabine, AUY922 or a combination of gemcitabine and AUY922. Apoptotic response was assessed by CC3 staining. Scale bars: 100 μm (d, f, g).
Figure 1 |
Figure 1 |. Identification and functional characterization of mesenchymal sub-populations in pancreatic cancer.
a, Kaplan–Meier analysis of tumour incidence in NCr Nude mice orthotopically transplanted with MS-L (n = 32) or EPI (n = 26) escapers. b, Metastatic burden (macroscopic liver, peritoneal and lung metastasis) from the experiment above (MS-L n = 32, EPI n = 16). c, Spherogenic potential in 3D of GFP+/CFPhigh and GFP+/CFPlow cell populations isolated from two independent tumours arising in the KPCΔ/Δ-R26mTmG/+-Cdh1Cfp/+ model (n = 3) (see Methods for details). d, TIC frequency of GFP+CFPhigh and GFP+CFPlow cells assessed by limiting-dilution experiments in NCr Nude mice (n = 20 per group) and calculated using L-Calc software. e, Kaplan–Meier survival analysis of NCr Nude mice orthotopically transplanted with the subpopulations described in d (n = 5 per group). f, In vivo characterization of tumour heterogeneity in the KPCΔ/Δ-R26mTmG/+ model of PDAC. Immunofluorescence staining for GFP, phospho-ERK1/2 and nestin identify distinct sub-population of invasive GFP+ cells. g, Histopathological grade distribution in a cohort of surgically resected human PDAC (SMARCB1+, n = 138; SMARCB1, n = 16). h, Kaplan–Meier analysis of overall survival in surgically resected PDAC with available follow up data. Patients were clustered on presence (n = 122) or absence (n = 12) of SMARCB1 immunostaining. i, Quantification of phospho-ERK1/2 immunohistochemical staining in SMARCB1+ (n = 51) versus SMARCB1 (n = 15) samples. j, Quantification of Ki67 immunohistochemical staining in SMARCB1+ (n = 45) versus SMARCB1 (n = 15) samples. k, Representative panels showing the morphology (haematoxylin and eosin stain (H&E)) and the expression of SMARCB1, Phospho-ERK1/2 and Ki67 in surgically resected human PDAC samples. Data are mean ± s.d. of biological replicates (a, b, e, i, j) or of technical replicates (one representative experiment out of three; c). d, Error bars show the proportion of TIC ± s.e.m. *P < 0.05, **P < 0.01, ****P < 0.0001 by unpaired two-tailed t-test (b, i, j) log-rank (Mantel–Cox) test (a, e, h), two-tailed chi-squared test (d) or two-tailed Fisher’s exact test (g). Scale bars: 100 μm (f, k).
Figure 2 |
Figure 2 |. Smarcb1 restrains the expansion of aggressive mesenchymal clones in PDAC.
a, Morphological and immuno-phenotypic characterization of Smarcb1-restored tumours (tamoxifen) compared to vehicle-treated controls (see Methods). Haematoxylin and eosin, vimentin (VIM), nestin (NES), E-cadherin (CDH1) and Ki67 stains of lesions collected 10 days after tamoxifen or vehicle treatment. Scale bars: 100 μm. b, Quantification of the vimentin- and nestin-positive areas in Smarcb1 depleted and restored primary tumours (n = 12 per group). c, Histopathological grade distribution in Smarcb1-depleted and restored primary tumours (T) and metastatic lesions (M) (n = 23 primary tumours, n = 21 metastatic lesions). Tx, tamoxifen; Veh, vehicle. d, Quantification of the proliferative index measured by Ki67 staining (n = 3 per group). Data are mean ± s.d. of biological replicates. **P < 0.01, ***P < 0.001, ****P < 0.0001 by unpaired two-tailed t-test (b, d) or two-tailed Fisher’s exact test (c).
Figure 3 |
Figure 3 |. Genetic perturbation of ER-stress response pathway is lethal in a Smarcb1-deficient context.
a, Quantification of protein biosynthesis by OPP incorporation analysis (measured by FACS). Representative graphics (left) and bar plots (right) from short-term cultures established from escapers-derived tumours (n = 4 per group). Cycloheximide (Chx)-treated cultures were used as negative controls. b, Transmission electron microscopy (TEM) sections from Smarcb1-proficient and -deficient tumours generated from somatic GEMMs and from stochastic escapers. Arrows indicate ER. Enlarged ER and cytoplasmic protein aggregates were observed in Smarcb1-deficient cells. Scale bars: 500 nm. c, Representative MRI axial sections of R26Cag-FlpoERT2/+-KPSΔ/Δ-pLSM5-shMkk4 and R26Cag-FlpoERT2/+-KPSΔ/Δ-pLSM5-shCtrl (containing a non-targeted control shRNA) tumour-bearing mice upon vehicle or tamoxifen treatment (see Methods). d, Kaplan–Meier survival analysis for the experimental groups described above assigned to tamoxifen (continuous lines) or vehicle (interrupted lines) treatment. shMkk4, n = 10 per group; shCtrl, n = 8 per group. e, Secondary orthotopic transplants (n = 5 per group). f, Schematic model showing the engagement of stress pathways defining malignant mesenchymal sub-populations in PDAC. Data are mean ± s.d. of biological replicates. **P < 0.01, ****P < 0.0001, by unpaired two-tailed t-test (a) or Mantel–Cox log-rank test (d, e). NS, not significant.
Figure 4 |
Figure 4 |. Pharmacological perturbation of proteostasis induces tumour regression in cooperation with gemcitabine in pre-clinical models of pancreatic cancer.
a, b, Waterfall plots (left) and box plots (right) of KPCΔ/Δ GEMM-derived-allografts (GDAs) transplanted subcutaneously in NCr Nude mice assigned to a vehicle (n = 5), BIRB796 and SP600125 (n = 5), gemcitabine (n = 5), gemcitabine, BIRB796 and SP600125 (n = 7) (a); and vehicle (n = 7), AUY922 (n = 6), gemcitabine (n = 18), gemcitabine and AUY922 (n = 14) (b). VD20 and VD0, tumour volumes at day 20 and 0 of treatment, respectively. c, Schematic of experimental design for the establishment of PDX models of PDAC. There were two independent lines used, PATX53 and PATX50. d, Representative sections from tumour-bearing mice treated with AUY922 or vehicle. Scale bars: 100 μm. e, f, Bar graph showing the relative enrichment of SMARCB1highGFP+ subpopulations upon treatment with AUY922 in orthotopic transplants of PDXs PATX53 (e) and PATX50 (f); n = 6 per group. g, h, Kaplan–Meier survival analysis of NOD SCID mice orthotopically transplanted with low-passage, PDAC PDX lines. Treatment with combined gemcitabine and AUY922 results in a significantly higher response rate and prolonged survival than treatment with monotherapies (PATX53, n = 7 per group; PATX50 vehicle, AUY992 and gemcitabine, n = 7 per group; PATX50, gemcitabine and AUY922, n = 14). Error bars denote mean ± s.d. of biological replicates (a, b, e, f). NS, not significant; *P < 0.05, **P < 0.01, ***P < 0.001, ****P < 0.0001, by unpaired two-tailed t-test (a, b, e, f) or Mantel–Cox log-rank test (g, h).

Comment in

References

    1. Hanahan D & Weinberg RA Hallmarks of cancer: the next generation. Cell 144, 646–674 (2011). - PubMed
    1. Nieto MA, Huang RY, Jackson RA & Thiery JP Emt: 2016. Cell 166, 21–45 (2016). - PubMed
    1. Pisco AO & Huang S Non-genetic cancer cell plasticity and therapy-induced stemness in tumour relapse: ‘What does not kill me strengthens me’. Br. J. Cancer 112, 1725–1732 (2015). - PMC - PubMed
    1. Rhim AD et al. EMT and dissemination precede pancreatic tumor formation. Cell 148, 349–361 (2012). - PMC - PubMed
    1. Kopp JL et al. Identification of Sox9-dependent acinar-to-ductal reprogramming as the principal mechanism for initiation of pancreatic ductal adenocarcinoma. Cancer Cell 22, 737–750 (2012). - PMC - PubMed

Publication types

MeSH terms