. 2017 Mar 2;543(7643):122-125.
doi: 10.1038/nature21356. Epub 2017 Feb 8.

Extrachromosomal oncogene amplification drives tumour evolution and genetic heterogeneity

Affiliations

Extrachromosomal oncogene amplification drives tumour evolution and genetic heterogeneity

Kristen M Turner et al. Nature. .

Abstract

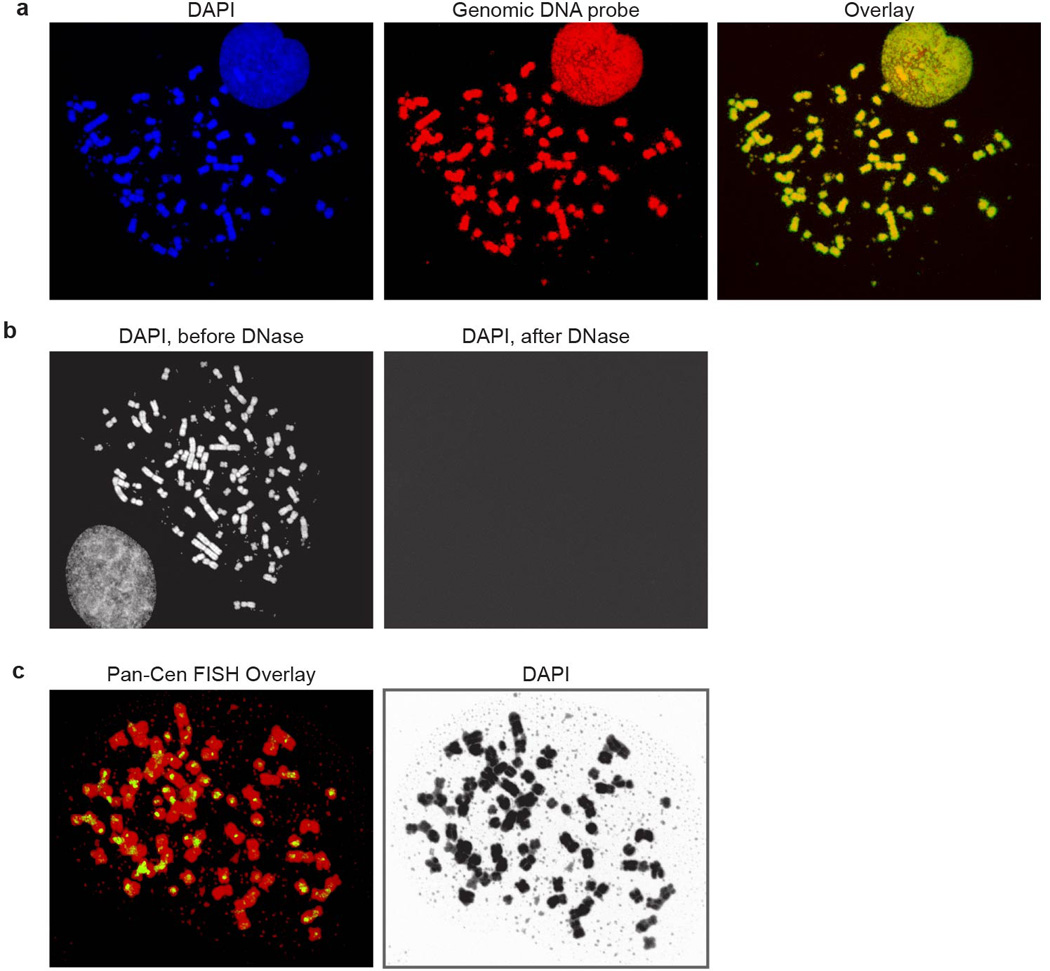
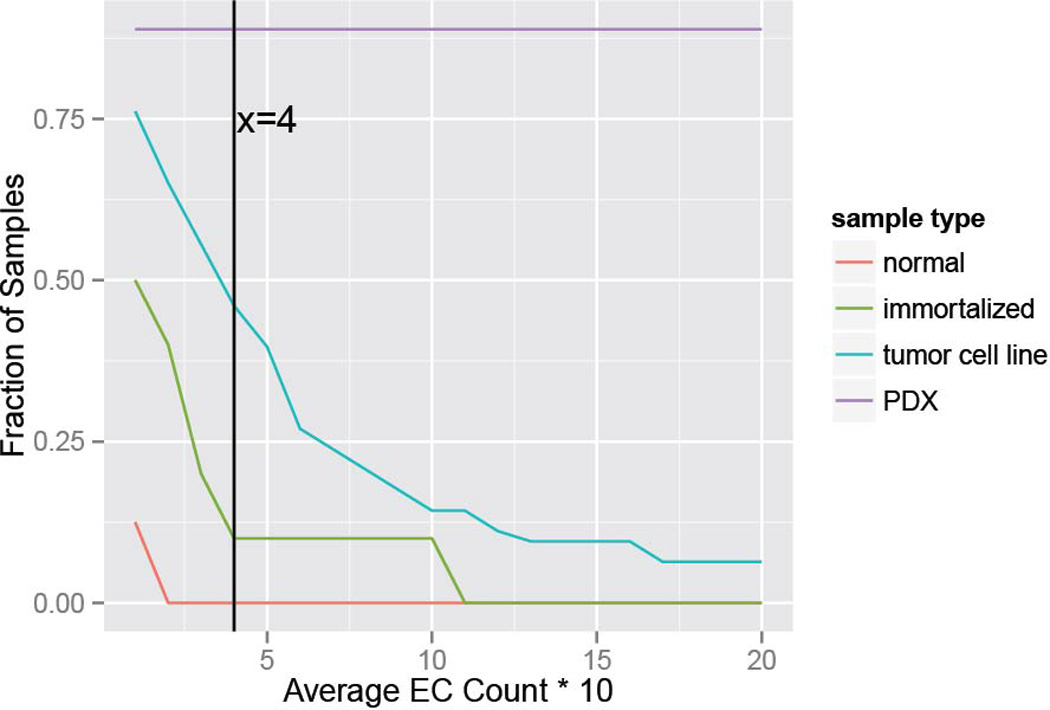
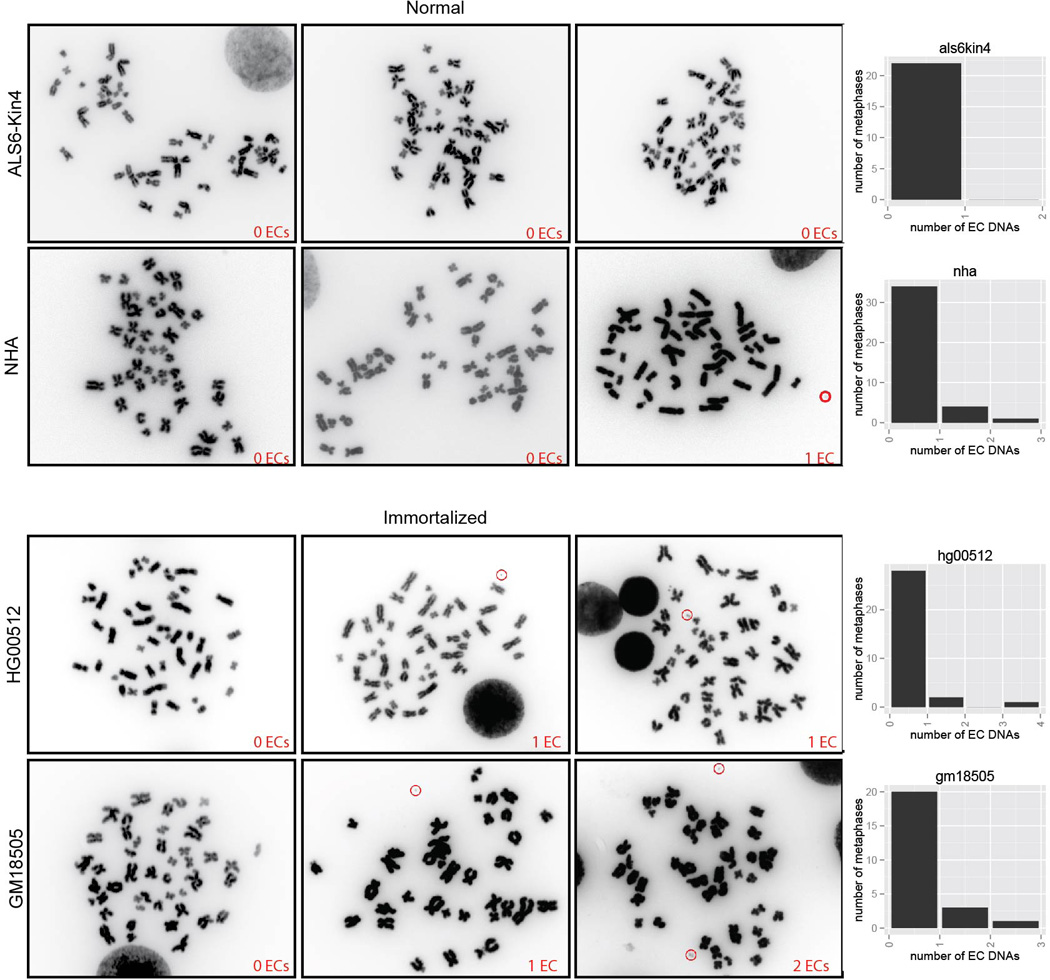
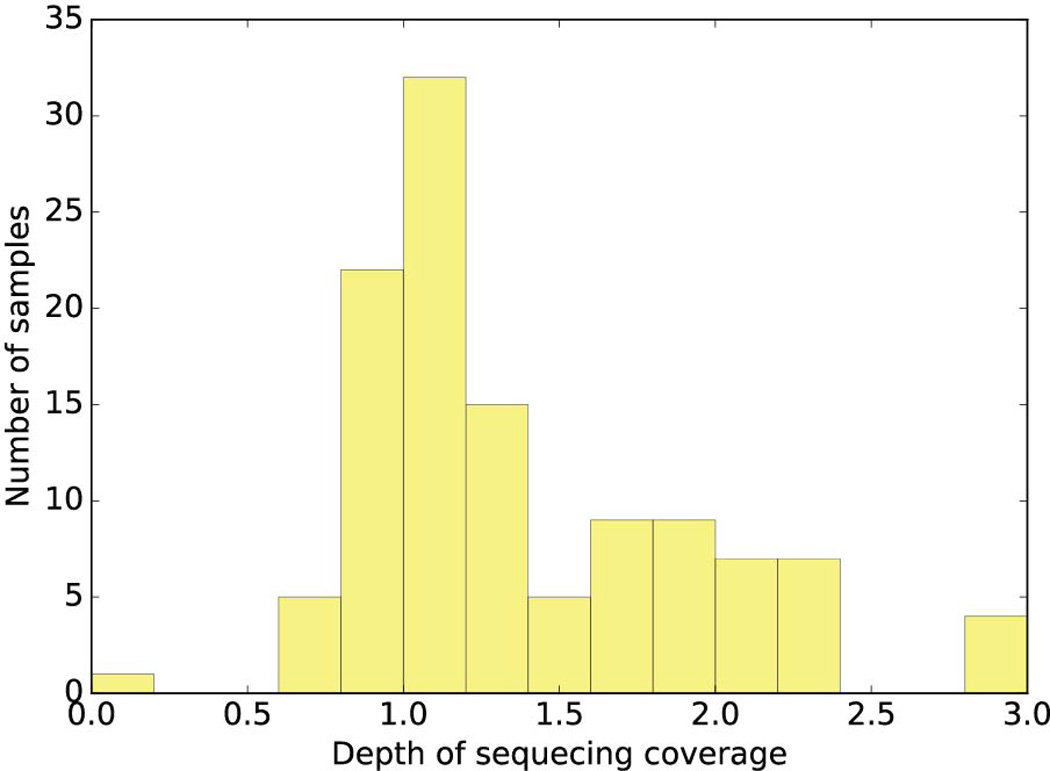
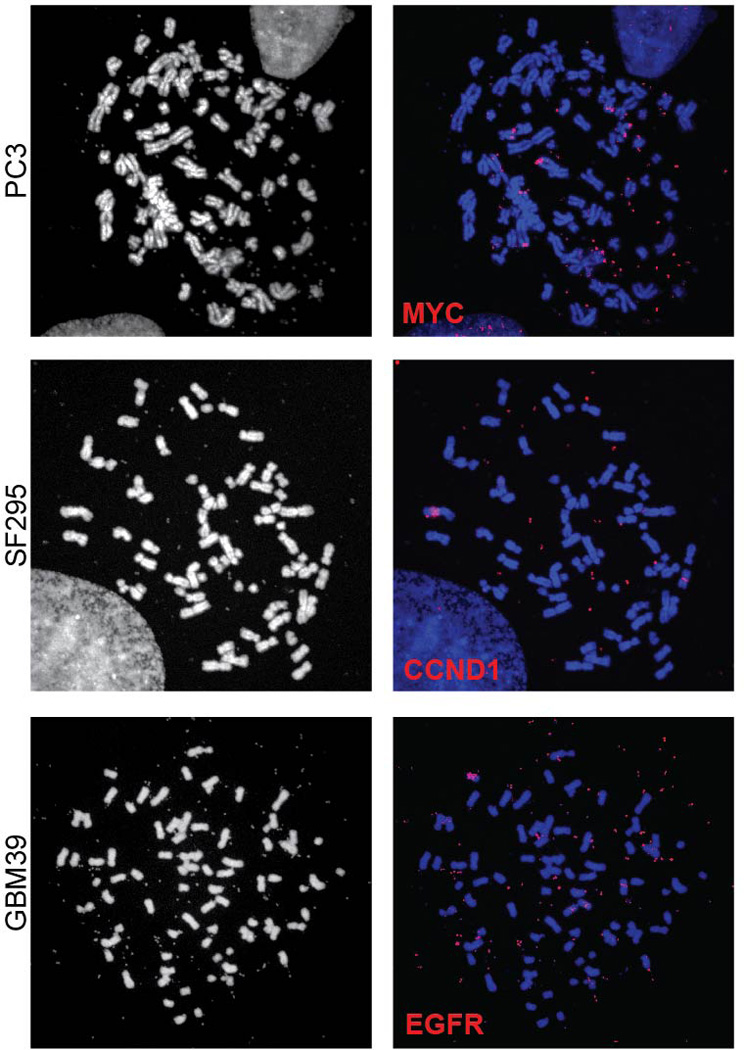
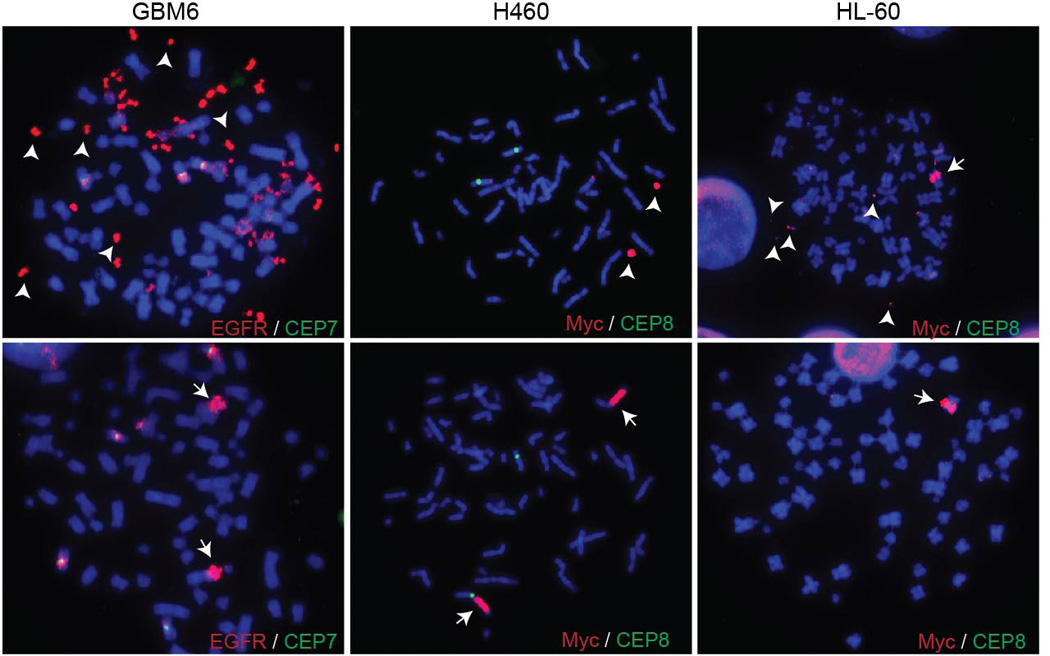
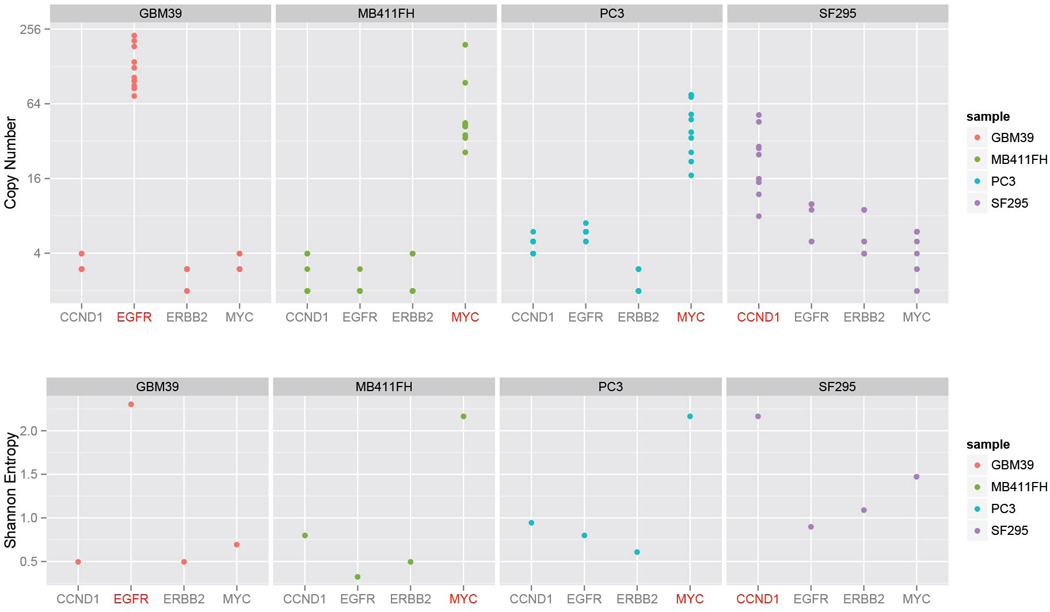
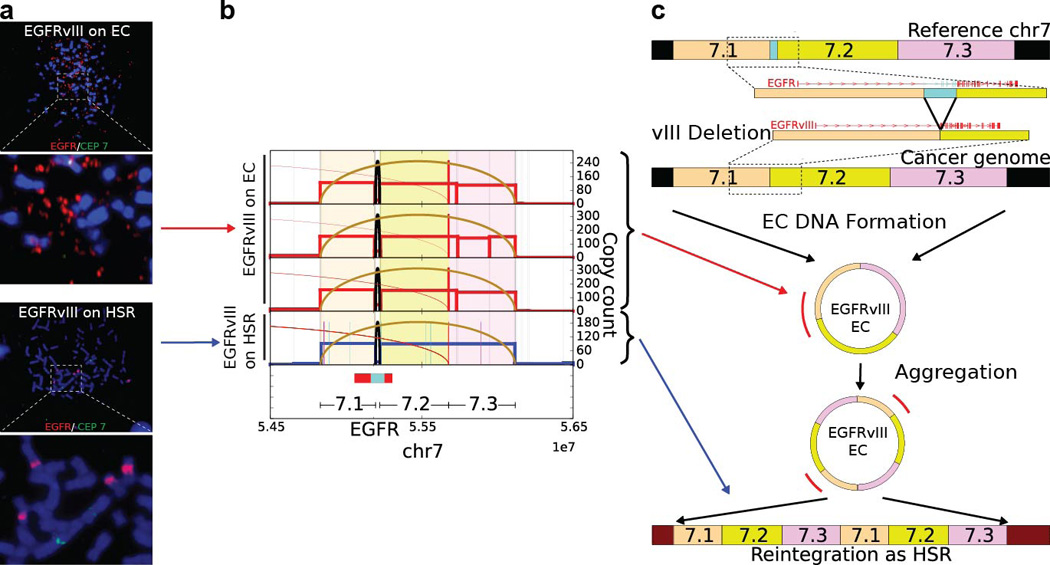
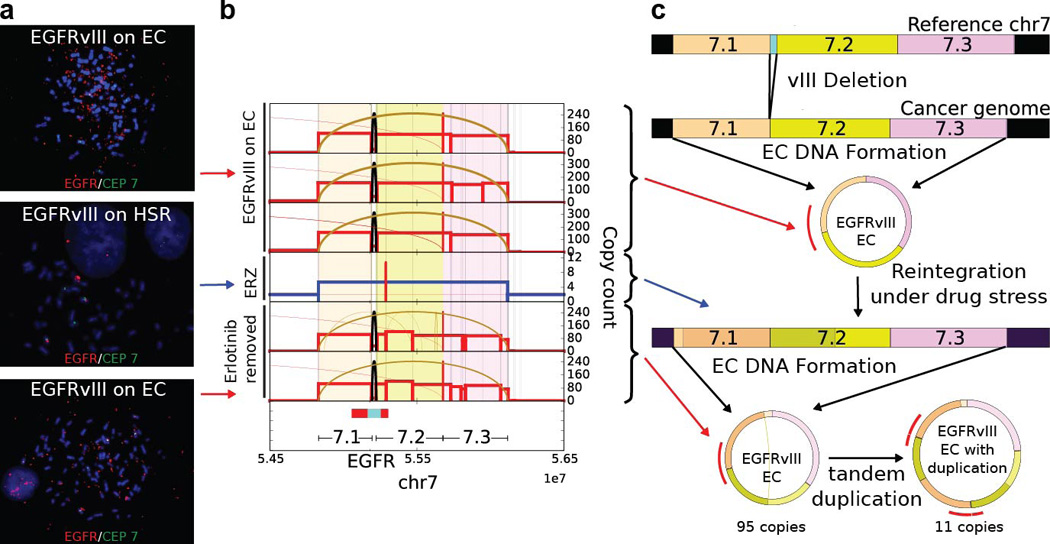
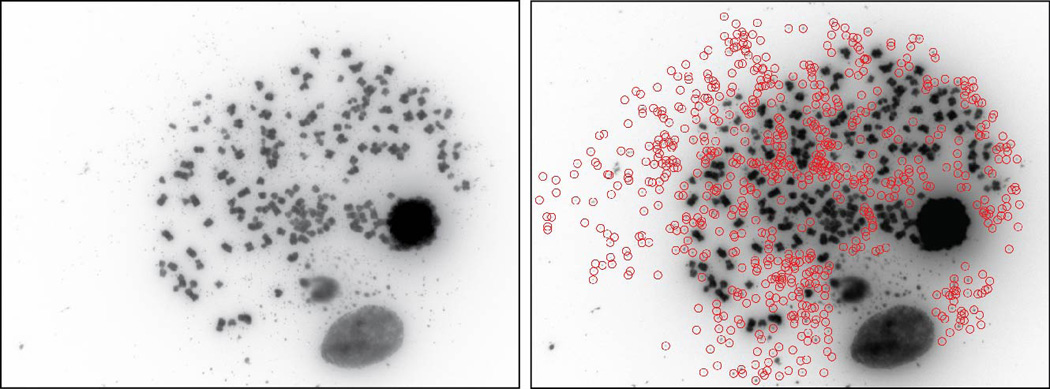
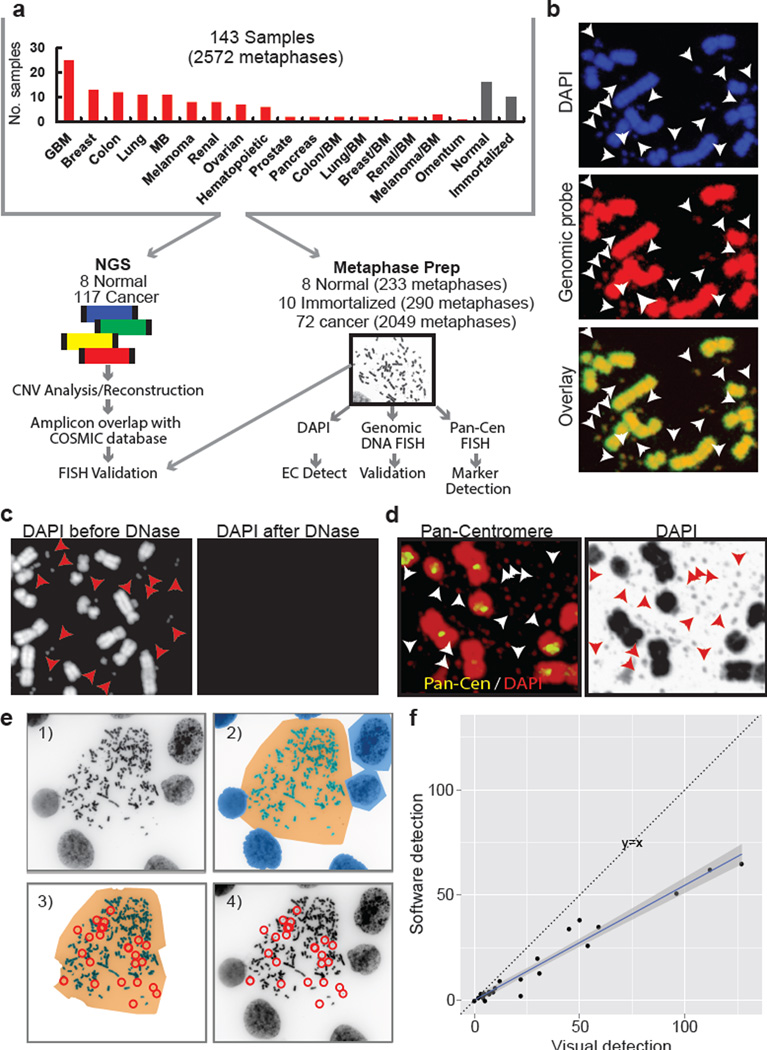
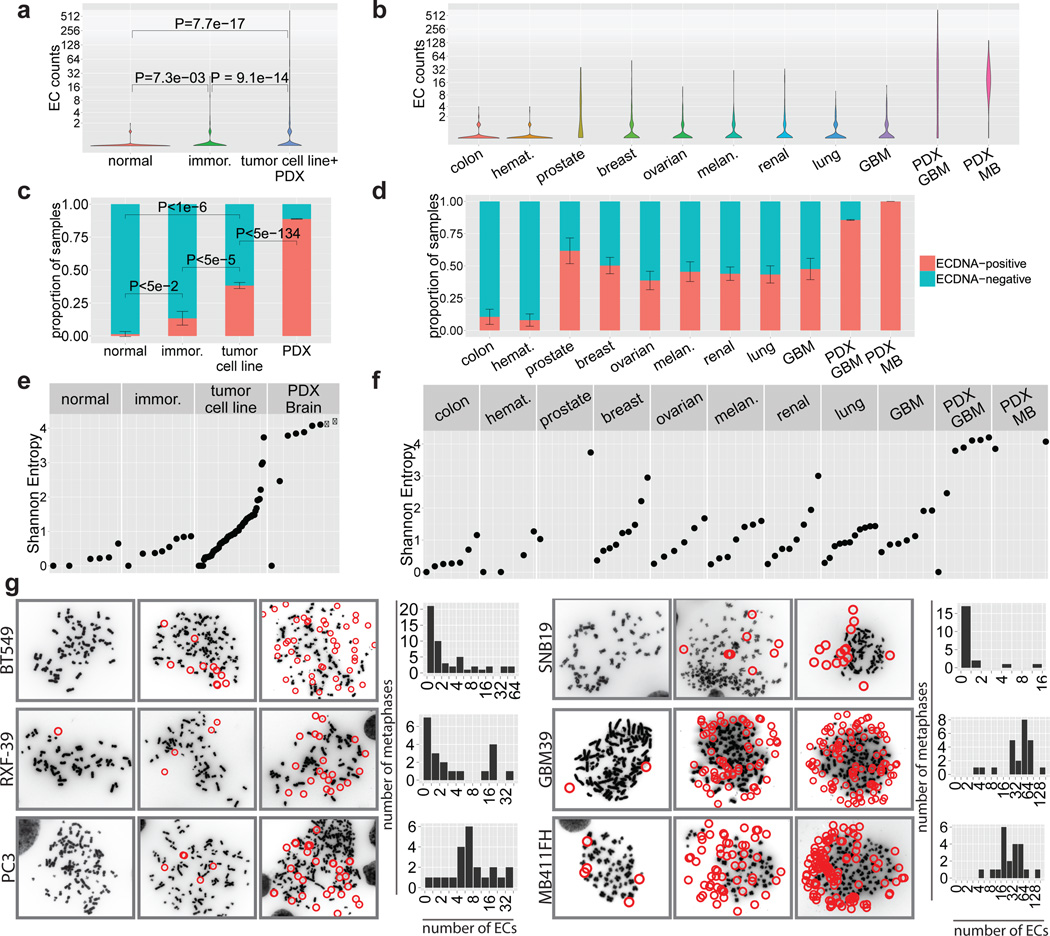
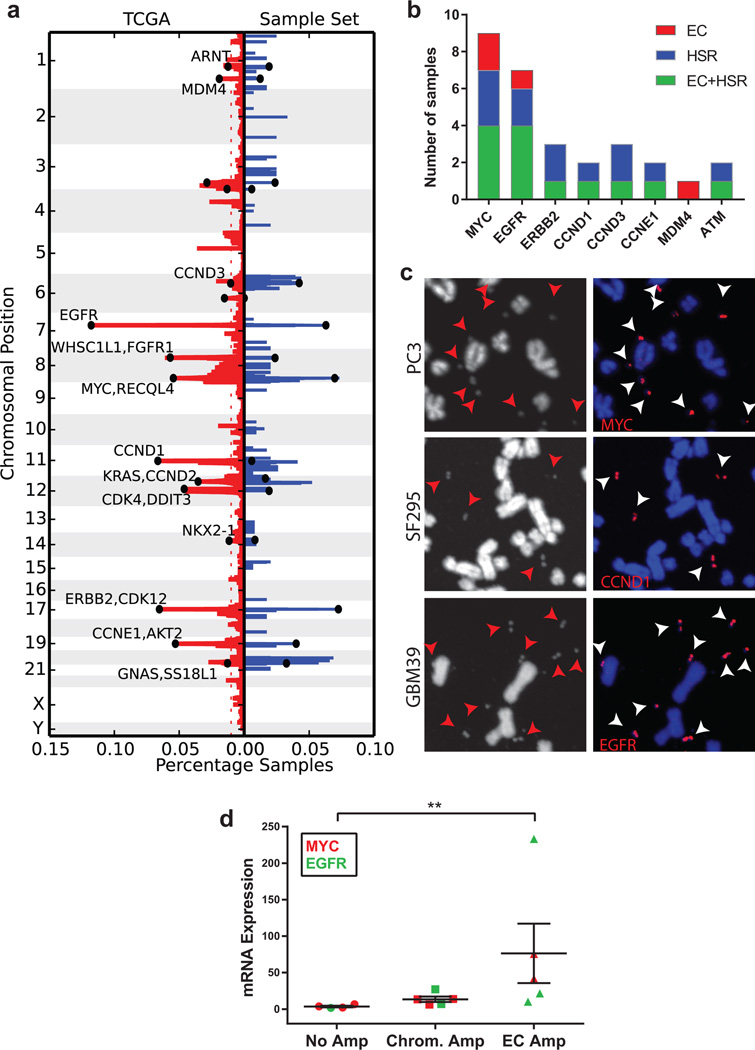
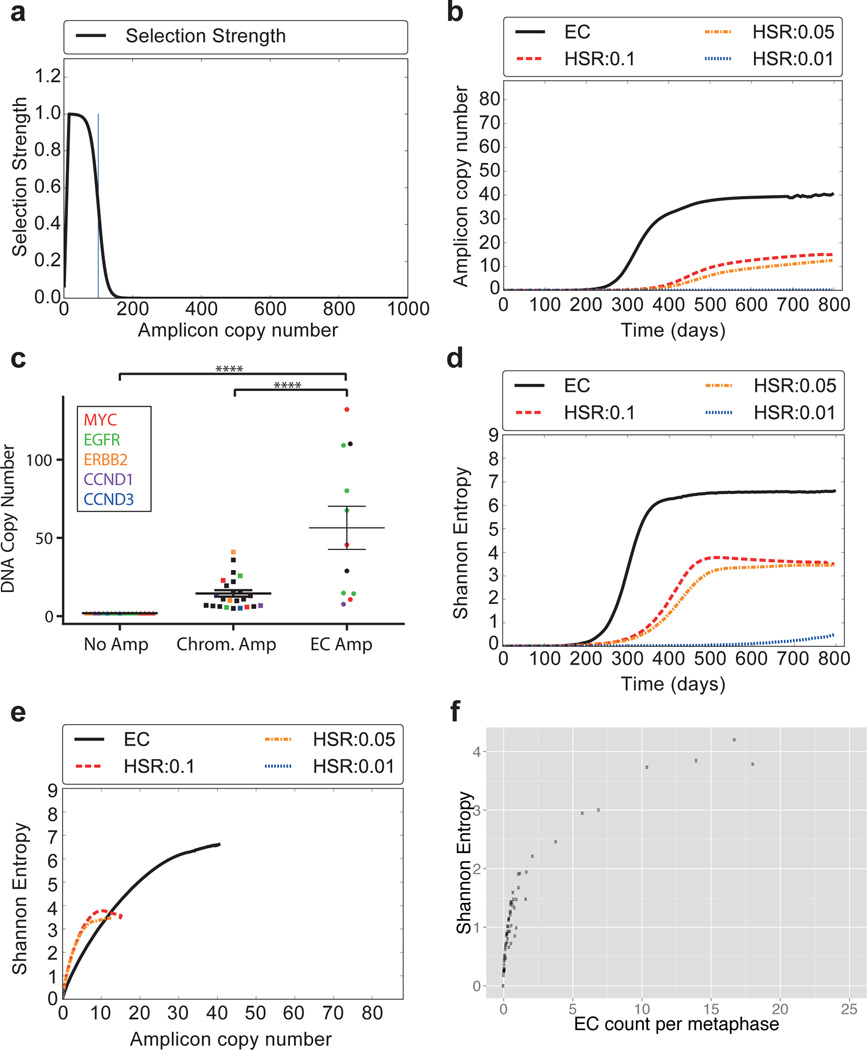
Human cells have twenty-three pairs of chromosomes. In cancer, however, genes can be amplified in chromosomes or in circular extrachromosomal DNA (ecDNA), although the frequency and functional importance of ecDNA are not understood. We performed whole-genome sequencing, structural modelling and cytogenetic analyses of 17 different cancer types, including analysis of the structure and function of chromosomes during metaphase of 2,572 dividing cells, and developed a software package called ECdetect to conduct unbiased, integrated ecDNA detection and analysis. Here we show that ecDNA was found in nearly half of human cancers; its frequency varied by tumour type, but it was almost never found in normal cells. Driver oncogenes were amplified most commonly in ecDNA, thereby increasing transcript level. Mathematical modelling predicted that ecDNA amplification would increase oncogene copy number and intratumoural heterogeneity more effectively than chromosomal amplification. We validated these predictions by quantitative analyses of cancer samples. The results presented here suggest that ecDNA contributes to accelerated evolution in cancer.


Figures

Figure E1
Figure E1
Full metaphase spreads corresponding to the partial metaphase spreads shown in Figure 1. a, Images corresponding to Fig. 1B, b, images corresponding to Fig. 1C, c, images corresponding to Fig. 1D.
Figure E2
Figure E2
Alternative analysis of ECDNA presence according to varying criteria, stratified by sample type: Samples with a minimum number of ECDNA per 10 metaphases in average shown in x-axis are classified ECDNA-positive, and their fraction is displayed on the y-axis. The vertical line at x=4 shows that for a minimum of 4 ECDNA per 10 metaphases on average, 0% of normal, 10% of immortalized, 46% of tumor cell line and 89% of PDX samples are classified as ECDNA positive.
Figure E3
Figure E3
ECDNA counts in normal and immortalized cells.
Figure E4
Figure E4
Histogram of depth of coverage for next-generation sequencing of tumor samples. We sequenced 117 tumor samples including 63 cell lines, 19 neurospheres (PDX) and 35 cancer tissues with coverage ranging from 0.6× to 3.89× (excluding one sample with 0.06 × coverage) with median coverage of 1.19×.
Figure E5
Figure E5
Full metaphase spreads corresponding to the partial metaphase spreads shown in Figure 3C.
Figure E6
Figure E6
FISH images displaying both ECDNAs and HSRs in cells from the same sample.
Figure E7
Figure E7
Copy number amplification and diversity due to ECDNA. To test how much of the copy number and diversity could be attributed to ECDNA, we chose FISH probes that bind to four of the most commonly amplified oncogenes in our sample set, EGFR, MYC, CCND1 or ERBB2, and quantified the cell-to-cell variability in their DNA copy number in metaphase spreads, from four tumor cell lines: GBM39, MB411FH, SF295 and PC3 cancer cells. For each cell line, only the target oncogene marked in red is known to be amplified on ECDNA (EGFR in GBM39; MYC in MB411FH and PC3, and CCND1 in SF295). The other 3 genes reside on chromosomal loci. The target oncogene shows consistently higher copy numbers (Top Panel) and diversity (Bottom Panel).
Figure E8
Figure E8
Fine structure analysis of EGFRvIII Amplification in Extrachromosomal or Chromosomal DNA in GBM39 Cells: a., FISH images revealed EGFR gene on ECDNAs (top) and HSRs (bottom) on different passes of the GBM39 cell line. Analysis of the HSR FISH images shows evidence of multiple integration sites on different chromosomes. b., Next generation sequencing of DNA from 4 independent cultures of GBM39 was used to analyze the fine structure of amplifications (Supplementary Material Section 4.3). In 3 biological replicates (rows 1 to 3) of these cultures, EGFRvIII was exclusively on ECDNA, while one of the later passage cultures (row 4) was found to contain EGFRvIII entirely on HSRs, with no detectable ECDNA. The DNA derived from different ECDNA cultures shows identical structure with some heterogeneity (p < 2.18 × 10⁻⁸ for all pairs), suggesting common origin. However, DNA derived from HSRs reveals a conserved structure that is identical to ECDNA structure (p < 1.98 × 10⁻⁵, Supplementary Material Section 2.4), possibly with tandem duplications. c., A possible progression of normal genome to cancer genome with EGFRvIII ECDNAs and amplification to a copy count of around 100 copies. The EGFRvIII ECDNAs possibly aggregate into tandem duplications and reintegrate into multiple chromosomes as HSRs such that 5–6 HSRs accommodate around 100 copies of EGFRvIII.
Figure E9
Figure E9
Fine structure analysis of EGFRvIII Amplification in Extrachromosomal or Chromosomal DNA in naive GBM39 cells and in response to Erlotinib Treatment (ERZ) and Drug Withdrawal: a., FISH images of naive GBM39 cells, in response to Erlotinib Treatment (ERZ) and Drug Withdrawal displayed EC amplification, HSR amplification and EC amplification respectively (top to bottom). b., Next generation sequencing of DNA from 6 independent cultures of GBM39 was used to analyze the fine structure of amplifications (Supplementary Material Section 4.3). Average copy numbers of amplified intervals as determined from sequencing analysis in naive samples (biological replicates in rows 1 to 3): 110 to 150, ERZ sample (row 4): 5.4 and Erlotinib removed (biological replicates in rows 5 and 6): 100–105. All three categories show similar fine structure indicating common origin (Methods). Erlotinib removed replicates show additional rearrangements and heterogeneity as compared to naive samples. c., Cytogenetic and sequencing progression suggests the EGFRvIII ECDNAs in naive cells get reintegrated into HSRs after drug application and the copies in the HSRs break off from the chromosomes again to form ECDNAs with copy count similar to naive cells. Drug removed samples also show additional heterogeneity in structure.
Figure E10
Figure E10
A GBM metaphase spread with large ECDNA counts (> 600), as determined by manual counting and ECdetect.
Fig. 1
Fig. 1. Integrated next-generation DNA sequencing and cytogenetic analysis of ECDNA
a, Schematic diagram of experimental flow. b, Representative metaphases stained with DAPI and a genomic DNA FISH probe (ECDNA, arrows). c, DNase treatment abolishes DAPI staining of chromosomal and ECDNA (arrows). d, Pan-centromeric FISH reveals absence of a centromere in ECDNAs (arrows). e, Schematic illustration of ECdetect. e.1) DAPI-stained metaphase as input. e.2) Semi-automated identification of ECDNA search region via segmentation. e.3) Conservative filtering, removing non-ECDNA components. e.4) ECDNA detection and visualization. (F). Pearson correlation between software-detected and manual calls of ECDNA (R: 0.98, p < 2.2 × 10⁻¹⁶.
Fig. 2
Fig. 2. ECDNA is found in nearly half of cancers and contributes to intra-tumoral heterogeneity
a, Distribution of ECDNA per metaphase from 72 cancer, 10 immortalized and 8 normal cell cultures, Wilcoxon rank sum test. b, ECDNA distribution per metaphase stratified by tumor type. c, Proportion of samples with ≥ 2 ECDNAs in ≥ 2 per 20 metaphases. Data shown as mean ± SEM. (methods). d, Proportion of tumor cultures positive for ECDNA by tumor type. e, Shannon diversity index (SI). Each dot represents an individual cell line sampled with ≥ 20 metaphases. f, SI by tumor type. g, DAPI-stained metaphases with histograms.
Fig. 3
Fig. 3. The most common focal amplifications in cancer are contained on ECDNA
a, Comparison of the frequency of focal amplifications detected by next generation sequencing of 117 cancer samples studied here (blue), with those of matched tumor types in the TCGA (red), demonstrates significant overlap and representative sampling (p-value 10−6 based upon random permutations of TCGA amplicons; Methods). b, Localization of oncogenes by FISH. c, Representative FISH images of focal amplifications on ECDNA (arrows). d, EGFRvIII and c-Myc mRNA level, measured by qPCR (p < 0.001, Mann-Whitney test), mean ± SEM. n=17; each data point represents qPCR values from three technical replicates.
Fig. 4
Fig. 4. Theoretical model for focal amplification via extrachromosomal (EC) and intrachromosomal (HSR) mechanisms
Simulated change in copy number via random segregation (EC) or mitotic recombination (HSR), starting with 105 cells, 100 of which carry amplifications. a, The selection function f100(k) reaches maximum for k=15, then decays logistically. b, Growth in amplicon copy number over time. c, DNA copy number stratified by oncogene location. (p<0.001, ANOVA/Tukey’s multiple comparison). N=52; data points include top five amplified oncogenes, mean ± SEM. d, Change in heterogeneity (SI) over time. e, Correlation between copy number and heterogeneity. f, Experimental data showing correlation between ECDNA counts and heterogeneity matches the simulation in panel E.

Comment in

Similar articles

Cited by

References

    1. Vogelstein B, et al. Cancer genome landscapes. Science. 2013;339:1546–1558. - PMC - PubMed
    1. Stark GR, Debatisse M, Giulotto E, Wahl GM. Recent progress in understanding mechanisms of mammalian DNA amplification. Cell. 1989;57:901–908. - PubMed
    1. Schimke RT. Gene amplification in cultured animal cells. Cell. 1984;37:705–713. - PubMed
    1. Fan Y, et al. Frequency of double minute chromosomes and combined cytogenetic abnormalities and their characteristics. J Appl Genet. 2011;52:53–59. - PubMed
    1. Nowell PC. The clonal evolution of tumor cell populations. Science. 1976;194:23–28. - PubMed

Online Methods References

    1. Lee PM. Bayesian statistics: an introduction. 4th. John Wiley & Sons; 2012.
    1. Motl J. < https://www.mathworks.com/matlabcentral/fileexchange/40854>.
    1. Bradley D, Roth G. Adaptive thresholding using the integral image. Journal of graphics, gpu, and game tools. 2007;12:13–21.
    1. Lander ES, et al. Initial sequencing and analysis of the human genome. Nature. 2001;409:860–921. - PubMed
    1. Kent WJ, et al. The human genome browser at UCSC. Genome Res. 2002;12:996–1006. Article published online before print in May 2002. - PMC - PubMed

Publication types