. 2017 Feb 23;542(7642):439-444.
doi: 10.1038/nature21394. Epub 2017 Feb 8.

Inhibition decorrelates visual feature representations in the inner retina

Affiliations

Inhibition decorrelates visual feature representations in the inner retina

Katrin Franke et al. Nature. .

Abstract

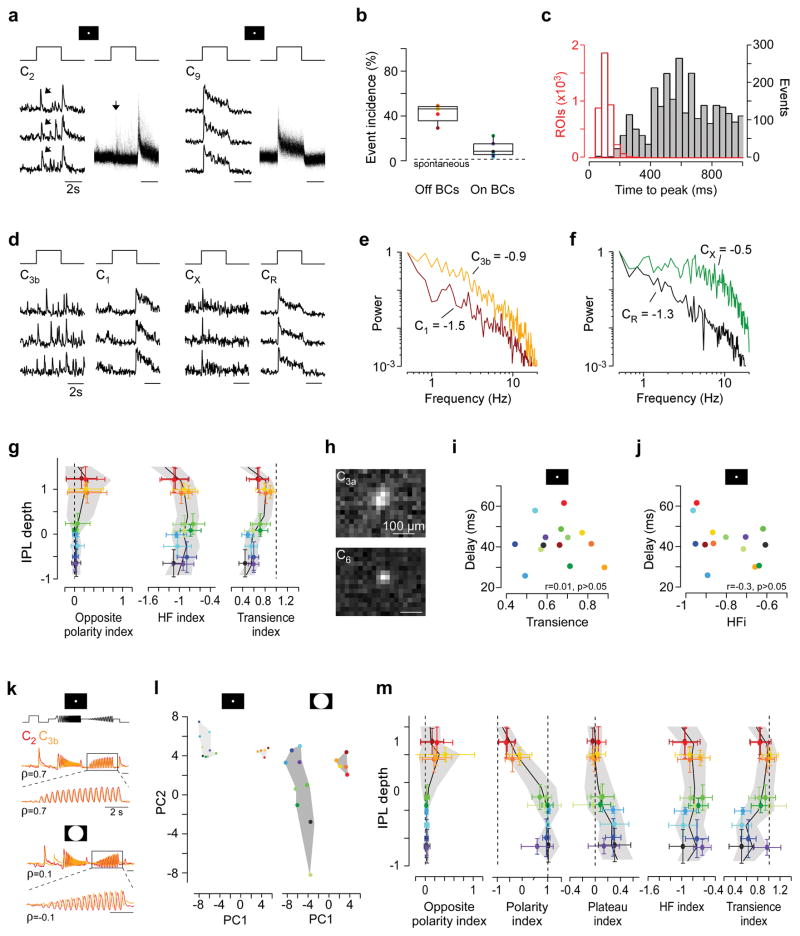
The retina extracts visual features for transmission to the brain. Different types of bipolar cell split the photoreceptor input into parallel channels and provide the excitatory drive for downstream visual circuits. Mouse bipolar cell types have been described at great anatomical and genetic detail, but a similarly deep understanding of their functional diversity is lacking. Here, by imaging light-driven glutamate release from more than 13,000 bipolar cell axon terminals in the intact retina, we show that bipolar cell functional diversity is generated by the interplay of dendritic excitatory inputs and axonal inhibitory inputs. The resulting centre and surround components of bipolar cell receptive fields interact to decorrelate bipolar cell output in the spatial and temporal domains. Our findings highlight the importance of inhibitory circuits in generating functionally diverse excitatory pathways and suggest that decorrelation of parallel visual pathways begins as early as the second synapse of the mouse visual system.


Conflict of interest statement

The authors declare no competing financial interests. Readers are welcome to comment on the online version of the paper.

Figures

Extended Data Figure 1
Extended Data Figure 1. ROI detection
a, Mean correlation (± s.d. shading, n=100 pixels) between noise-response traces of two individual pixels from scan field shown in (Fig. 1c) plotted against the distance of each pixel-pair (a1). Dotted line shows linear fit to the data above x = 10 μm and its extrapolation towards x = 0 μm. The space constant obtained from an exponential fit (orange) for distances >5 μm was used to determine a scan field’s specific correlation minimum for ROI detection (a2, zoomed-in version of a1). Blue shading indicates the range of allowed ROI radii (0.375–2 μm). b, Scan field from (Fig. 1c), with each pixel color-coded by its correlation with the noise trace of pixel indicated in (b1). In b2, the red shading corresponds to pixels with a correlation coefficient > correlation minimum from (a2), resulting in red ROI in (b3). c, As (a1), averaged for n=71 scan fields recorded at 48×12 μm. d, Histogram of ROI (black) and BC axon terminal (red) area. Terminal area was determined from BC axonal arborisations labelled in GCaMP6-injected Pcp2 mice where individual axon terminals can be distinguished (cf. SFig. 2a). Inset shows a histogram of the number of ROIs per BC axon terminal. e, Distribution of ROI numbers per scan field. f, Histogram illustrating sampling of ROIs against IPL depth. Data collected specifically for drug experiments (Methods) contributed to the “oversampling” of the two ChAT bands.
Extended Data Figure 2
Extended Data Figure 2. GCaMP6 signals in mouse BC axon terminals
a–c, High resolution scan of GCaMP6f-expressing BC axon terminal systems in the IPL of a Pcp2 mouse (a) and corresponding scan field (b) with automatically generated ROI mask overlaid (c, cf. Extended Data Fig. 1). Our ROI algorithm reliably detected individual axon terminals and rather assigned two ROIs to a single terminal before merging two terminals into one ROI (cf. Extended Data Fig. 1g). d, Exemplary mean local-chirp responses of individual ROIs shown in (c) of the two different BCs shown in a. e, Scan field from (c) with ROI mask and spatial RFs (2 s.d. outlines of gauss fit) overlaid. f, Distribution of RF diameters estimated from On BC terminal calcium (GCaMP6) and glutamate release (iGluSnFR), respectively. Black dots correspond to mean RF diameters. Receptive field sizes estimated from calcium signals of single terminals closely fit those estimated from single iGluSnFR ROIs (56.1 ± 10 μm for GCaMP6 and 57.5 ± 10.6 μm for iGluSnFr; p>0.05, n=261 (GCaMP6) and n=3,540, non-parametric non-paired Wilcoxon signed-rank test) and matched the anatomical dimensions of BC dendritic fields (Wässle et al., 2009b; Behrens et al., 2016). The findings shown here suggest that each ROI likely captured the light-driven glutamate signal of at most one individual BC axon terminal. g,h, High resolution scan of GCaMP6-expressing RBC axon terminals (g) and corresponding scan field (h), with two individual terminals indicated. i,j, Mean responses of RBC terminals shown in (h) to full-field flashes (i, n=20 trials) and local chirp stimulus (j, n= 5 trials).
Extended Data Figure 3
Extended Data Figure 3. Alternative clustering including the glutamatergic monopolar interneuron (GluMI)
a,b, Heat maps of local chirp responses of C1, C2 and CGluMI (a) and respective cluster means (b). Superimposed cluster means (b, bottom) illustrate response similarity between clusters. c and d like a and b, but for full-field responses.
Extended Data Figure 4
Extended Data Figure 4. Clustering
a, Exemplary distributions of prior probabilities for cluster allocation (right) taken from mean stratification profiles (left) of scan fields recorded at two different IPL depths (A: 1.7; B: 0). b, Temporal features extracted from glutamate traces in response to local (n=6 features, top) and full-field (n=12 features, middle) chirp and full-field flashes (n=6 features, bottom). c, Heat maps of all recorded glutamate responses (n=14 clusters plus ROIs discarded based on signal-to-noise (S/N) ratio) to the four visual stimuli (cf. Fig. 1); n=11,101 ROIs from 29 retinas. Each line corresponds to the responses of individual ROIs with activity colour-coded. Block height represents the number of included ROIs per cluster. Within one cluster, ROIs are sorted based on the quality of their RFs and local chirp response (Methods). Overlaid stratification profiles (left) illustrate overlap for some BC types. d, e, Cluster separation was determined for every cluster pair using the sensitivity index d′. Dotted lines in (d) illustrate transition between On and Off clusters and dotted line in e at d′=2, which corresponds to about 15% FP/FN rates. f, Separation of exemplary cluster pairs with a low (d′=2.0, top) and an average (d′=4.5, bottom) sensitivity index, respectively. g, Distribution of field entropies (left, Methods). Two exemplary scan fields (right) with ROIs colour-coded by cluster allocation illustrate low (1) and high (2) field entropy, respectively.
Extended Data Figure 5
Extended Data Figure 5. Anatomical verification of clustering approach
a, High resolution scan of the axon terminal system of a filled BC (middle), with the iGluSnFR staining overlaid in green (top), and corresponding scan field (bottom). b, Colour-coded ROI mask (cyan), with ROIs assigned to the labelled axon terminal system in red (top; Methods). Cluster allocations of all ROIs, and ROIs assigned to the labelled cell that passed the quality criterion, are shown in the middle and bottom panel, respectively. c, Reconstructed BC and its smoothed stratification profile (black), with the profile of the BC underlying the assigned functional cluster (CBC2) overlaid (red). d, RF outlines of ROIs with QiRF < 0.6 allocated to one reconstructed cell. e, Mean local (top) and full-field chirp (bottom) response of all ROIs assigned to the labelled cell (black), with s.d. shading (grey) and cluster mean of the assigned functional cluster (C2, red). f–j like a–e and k–n like b–e. o, Box plots illustrate the fraction of ROIs from one cell that were assigned to the same cluster for all reconstructed BCs (n=8 cells, n=3 mice). For the plot in the bottom, functionally very similar clusters (C3a and C3b; C5o, C5i and C5t) were merged. Due to lower signal-to-noise ratios and a slower sampling rate (15.625 Hz vs. 31.25 Hz) for this single-cell data compared to all other data, the fraction of “correctly” assigned ROIs is likely underestimated.
Extended Data Figure 6
Extended Data Figure 6. Functional organisation of the IPL
a, Glutamate responses to the local chirp step stimulus (first 8 seconds) of single ROIs assigned to C2 and C9, respectively. Shown are responses to 3 trials and a histogram of response amplitudes across each cluster’s 100 best responding ROIs. On responses in Off BC cluster C2 are highlighted (arrows). b, Percentage of ROIs with at least one opposite polarity event in response to the local chirp step response for On and Off BC cluster. Dotted line illustrates mean incidence of spontaneous events (<1%). c, Time to peak of On events observed in the Off layer (grey) and On responses in On layer (red). Events were estimated from responses to single trials of the local chirp stimulus. Due to the variability in timing, On events are not evident in traces averaged across the population of ROIs for each cluster (Fig. 2d). d, As (a), showing “spiking” (C3b, CX) and non-spiking (C1, CR) responses in clusters of either polarity. e, f, Mean spectra (n=5 trials) of local chirp step responses for two Off (C3b and C1) and two On (CX and CR) ROIs shown in (d), with HFi estimated from the relative power of low (0.5–1 Hz) and high (2–16 Hz) frequencies (Methods). g, Response measures estimated from local chirp responses for all ROIs plotted against IPL depth (cf. Fig. 2e–h). h, Spatial RFs of individual ROIs assigned to C3a and C6, respectively. i, Mean response transience of BC clusters is not correlated with mean response delay (r=0.01, p>0.05, n=14, linear correlation). j, Mean HFi and mean response delay are not correlated across BC clusters (r=0.3, p>0.05, n=14, linear correlation). k, Mean chirp responses of two Off (C2 and C3b) clusters, with linear correlation coefficient (ρ) of whole trace or contrast ramp indicated. l, Cluster means of local (left) and full-field (right) chirp responses embedded in two-dimensional feature space based on first and second principal components (PC). m, Response measures estimated from full-field chirp responses for all ROIs plotted against IPL depth (cf. Fig. 2e–h).
Extended Data Figure 7
Extended Data Figure 7. GABA and glycinergic inhibition differentially shapes BC responses
a, Mean responses (n=5 trials) of individual ROIs to alternating local and full-field flashes under control conditions and with GABA (top) or glycine (bottom) receptor block. b, Change of mean peak amplitudes (± s.d. shading) of n=15 ROIs originating from two scan fields during wash-in of GABA and glycine receptor blockers, respectively. c, Drug-induced changes in peak response amplitude across different BC clusters upon blocking GABA (c1; p<0.001, n=9 clusters from 5 scan fields and 4 mice, non-parametric paired Wilcoxon signed-rank test) and glycine receptors (c2; p<0.001, n=6 clusters from 5 scan fields and 4 mice). Mean ± s.d. in black. d,e, Local (grey) and full-field (black) chirp responses for control and drug conditions (d: GABA receptor block; e: glycine receptor block), with linear correlation coefficient (ρ) between each pair indicated. f, Local (grey) and surround (black) chirp responses for an exemplary On (C7, top) and Off (C3a, bottom) BC cluster, respectively. g,h, Spatial RFs with 2 s.d. outline of Gaussian fit shown in red (left) and quantification of changes in RF diameter across different BC clusters (right) upon blocking GABA (g; p<0.05, n=6 cluster from 3 scan fields and 2 mice, non-parametric paired Wilcoxon signed-rank test) and glycine receptors (h; p>0.05, n=5 cluster from 3 scan fields and 2 mice).
Extended Data Figure 8
Extended Data Figure 8. Glycine-mediated crossover inhibition from the On pathway rectifies Off BCs
a, Local chirp traces of an exemplary Off BC cluster (C3a) during control condition (left) and glycine receptor block (right). Magnified traces in the bottom illustrate an increase in tonic release upon drug application, with respective tonic release indices (TRi, Methods) indicated. Dotted line corresponds to baseline. Schematic (top right) illustrates effect of drug on inner retinal network. b, Quantification of drug-induced changes in tonic release across different Off BC clusters (p<0.001, n=5 clusters from 5 scan fields and 4 mice, non-parametric paired Wilcoxon signed-rank test). c, Local chirp responses of an exemplary On (C6) and Off (d, C2) BC cluster for control condition (left) and upon blocking the On BC pathway via L-AP4 (right). e, Tonic release indices of different Off BC clusters for control and L-AP4 condition (p<0.001, n=5 clusters from 3 scan fields and 2 mice, non-parametric paired Wilcoxon signed-rank test). f, Average local chirp frequency and contrast responses of an exemplary Off (C1, top) and On (CX, bottom) BC cluster illustrate rectification of Off BC responses. g, Comparison of tonic release indices of On and Off BC clusters under control condition and Off BCs upon blocking crossover inhibition with L-AP4 or strychnine (*p<0.05, **p<0.01, non-parametric Kruskal-Wallis test).
Extended Data Figure 9
Extended Data Figure 9. Extraction of BC centre-surround RFs
a, Centre-surround maps obtained from the ring noise were averaged across ROIs assigned to one cluster (1). To isolate the surround component, the innermost two rings which contained the majority of the centre component were clipped (2) and the surround map estimated by SVD (3) was extrapolated across the centre by fitting a Gaussian (4). Next, the extrapolated surround map was subtracted from the average map and the centre component was extracted using SVD (6). The resultant centre-surround map was then subtracted from the average map to estimate the residual variance (7, Methods). Dotted lines at t=0. b, Centre-surround maps of 3 ROIs assigned to CX from three independent experiments (top; bottom, left). Overlaid centre and surround time kernels (bottom, right) of ROIs (grey) and cluster mean (black) illustrate temporal precision and reproducibility. c,d, Heat maps of all centre (C) and surround (S) time kernels and cluster means ± s.d. for Off (c) and On (d) BC clusters.
Extended Data Figure 10
Extended Data Figure 10. Centre-surround RFs of BC clusters
a, Normalised time (top) and space (bottom) kernels of all On and Off BC clusters. Space kernels represent extrapolated Gauss fits of centre and surround activation across rings shown in (Fig. 5b), with circles corresponding to the original data points (Methods). b,c, Effect of GABA (b) and glycine (c) receptor block on centre-surround RFs of two exemplary BC clusters. Centre-surround maps correspond to averages of n>5 ROIs of one scan field. d, Time to peak of centre time kernels preceded peak of surround time kernels (cluster mean ± s.e.m.; r=0.91, p<0.001, n=14, linear correlation), consistent with at least two additional synapses in the inhibitory pathway. Black line corresponds to linear fit and for the dashed line the slope=1. e, Half-maximal width (cluster mean± s.e.m.) was consistently narrower for centre compared to surround time-kernels (r=0.83, p<0.001, n=14, linear correlation). f, Half-maximal width of surround space kernels did not correlate with mean cluster IPL depth (r=0.06, p>0.05, n=14, linear correlation). g, Time to peak of centre time kernels correlated with response delay estimated from local chirp step responses (mean ± s.e.m.; r=0.82, p<0.001, n=14, linear correlation), indicating that centre kernels adequately reflect BC responses to local stimuli. h, Predicted centre-surround ratios (CSRs) of BC clusters for different stimulus diameters (cf. Fig. 5d). i,j, Normalised temporal kernels predicted for local (100 μm diameter), full-field (500 μm diameter) and surround-only (500 and 100 μm outer and inner diameter, respectively) stimulation for Off (i) and On (j) BC clusters (cf. Fig. 5e), respectively.
Figure 1
Figure 1. Imaging light-driven glutamate release in the IPL
a, Vertical projection of stack showing iGluSnFR expression (green) across the IPL, blood vessels in red. Grey plane: scan field orientation. GCL: Ganglion cell layer, IPL: Inner plexiform layer, INL: Inner nuclear layer, OV: Outer vessels, IV: Inner vessels. b, ChAT bands (white) relative to blood vessels (red) and average depth profiles (± s.d. shading); n=9 stacks, n=3 mice. c, Example scan field (64×16 pixels) with region-of-interest (ROI) mask. d, Glutamate response of ROI from (c) to local and full-field chirp stimulus and full-field flashes. Black: mean; grey: individual trials. Glutamate traces represent relative glutamate release (d[Glut]). e, Temporal and spatial receptive field of ROI from (d). Dashed line: Time of response. f, Superimposed mean glutamate traces in response to local (top) and full-field chirp (bottom) of red and green ROIs from (c). g, Scan field and ROI mask from (c) with spatial RFs (2 s.d. outlines, n=20 ROIs) of red and green ROIs.
Figure 2
Figure 2. Anatomy-guided clustering and functional organisation of the IPL
a, EM-reconstructed example BCs from. b, Mean BC stratification profiles of all known BCs (see text). Colours indicate cluster allocation in all subsequent figures. c, Prior probabilities of scan fields recorded at two IPL depths (A: 1.7; B: 0). d, Mean glutamate response (n=8,448 ROIs) of every cluster to local and full-field chirp, full-field flashes and temporal RF kernels. e, Polarity index (Methods) (n=8,448) as function of IPL depth. Shading corresponds to median ± s.d. for every IPL bin (n=13 bins). Cluster means (± s.d.) are overlaid. f–h like e for plateau index, delay and receptive field diameter (Methods). e–g were estimated from local chirp step responses.
Figure 3
Figure 3. Surround activation increases functional diversity across BCs
a, Correlation between cluster means of local (top) and full-field (bottom) chirp responses. b, Mean correlation between local and full-field chirp responses for each cluster with all other clusters of the same (top) and opposite (bottom) polarity (mean: ρlocal =0.9 vs. ρfull-field=0.7 and ρlocal =−0.3 vs. ρfull-field=−0.5, p<0.001, n=14, non-parametric paired Wilcoxon signed-rank test). Mean ± s.d. in black. c, Mean chirp responses of C6 and C9, with linear correlation coefficient (ρ) of whole trace or contrast ramp.
Figure 4
Figure 4. Opposite effects of GABA- and glycinergic ACs on BC output
a, Local (grey) and full-field (black) chirp responses for control condition and GABA receptor block, with linear correlation coefficient (ρ) between each pair. b, Schematic illustrating the effects of GABA receptor block (TPMPA/Gbz; 75/10 μM). c, Linear correlation coefficients of local and full-field chirp responses across different clusters for GABA receptor block (p<0.05, n=10 from 5 scan fields and 4 mice, non-parametric paired Wilcoxon signed-rank test). d–f like a–c but for glycine receptor block (Strychnine; 0.5 μM). p<0.001, n=8 from 4 scan fields and 3 mice.
Figure 5
Figure 5. Differential centre-surround organisation underlies BC functional diversity
a, Schematic of ring noise stimulus (ring width: 25 μm). b, Centre-surround time kernels of an example cluster for 8 rings (CX; Methods, cf. Extended Data Fig. 9a). Dashed line at t=0. c, Normalised time (top) and space (bottom) kernels of CX. Space kernels are Gaussian fits of centre and surround activation, circles indicate original data points (Methods). d, Predicted centre-surround activation ratios (CSRs) to local (top) and full-field (bottom) spot-stimuli from activation of centre (light grey) and surround (dark grey). e, Normalised effective time kernels of CX for different stimulus diameters (left) and for 100 and 500 μm (right). f, Normalised spectra of predicted time kernels shown in (e, right). g, Normalised spectra predicted for Off- (top) and On-clusters (middle) during local (left) and full-field (right) stimulation with mean ± s.d. shown in black/grey (bottom). h, Measured time kernels (left) and frequency spectra (right) for a local and full-field spot noise stimulus (C1 and C6). i, Measured and predicted correlation of time kernels for local, full-field and surround-only stimulation (data: p<0.001, n=13, non-parametric paired Wilcoxon signed-rank test; model: both p<0.001, n=14). Black: mean ± s.d.. j, Average correlation ± s.e.m. across predicted cluster time kernels for different stimulus diameters.

Comment in

Similar articles

Cited by

References

    1. Masland RH. The Neuronal Organization of the Retina. Neuron. 2012;76:266–280. - PMC - PubMed
    1. Baden T, et al. The functional diversity of retinal ganglion cells in the mouse. Nature. 2016;529:345–350. - PMC - PubMed
    1. Sanes JR, Masland RH. The Types of Retinal Ganglion Cells: Current Status and Implications for Neuronal Classification. Annu Rev Neurosci. 2015;38:221–46. - PubMed
    1. Euler T, Haverkamp S, Schubert T, Baden T. Retinal bipolar cells: elementary building blocks of vision. Nat Rev Neurosci. 2014;15:507–19. - PubMed
    1. Helmstaedter M, et al. Connectomic reconstruction of the inner plexiform layer in the mouse retina. Nature. 2013;500:168–74. - PubMed

Publication types

MeSH terms