. 2017 Feb 16;542(7641):357-361.
doi: 10.1038/nature21380. Epub 2017 Feb 8.

EPRS is a critical mTORC1-S6K1 effector that influences adiposity in mice

Affiliations

EPRS is a critical mTORC1-S6K1 effector that influences adiposity in mice

Abul Arif et al. Nature. .

Abstract

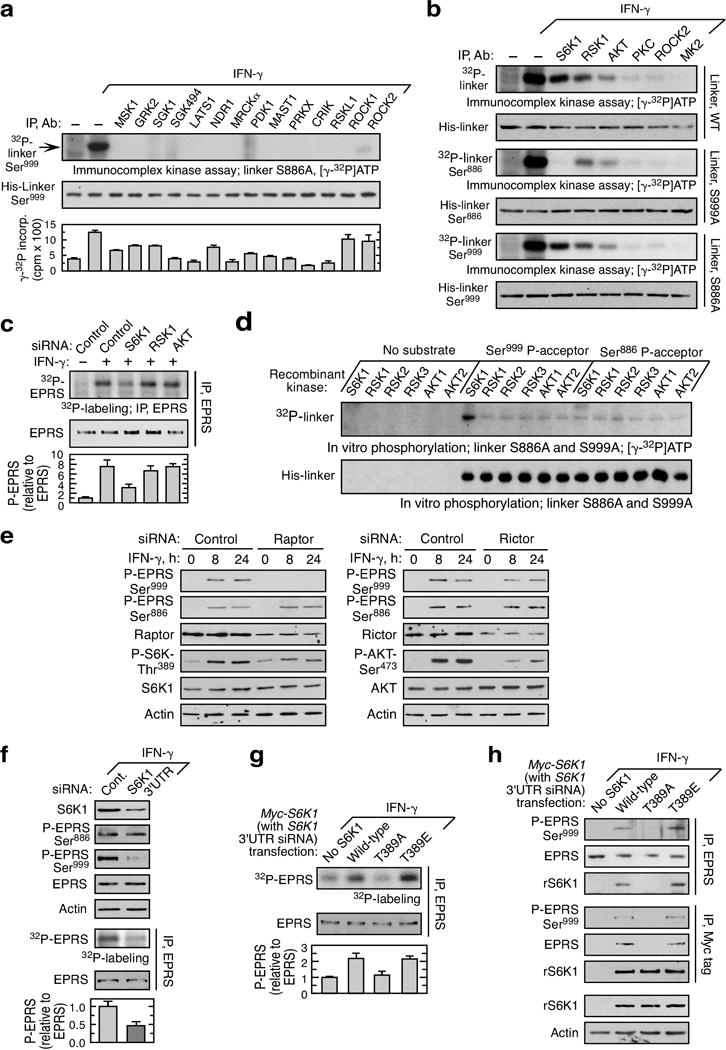
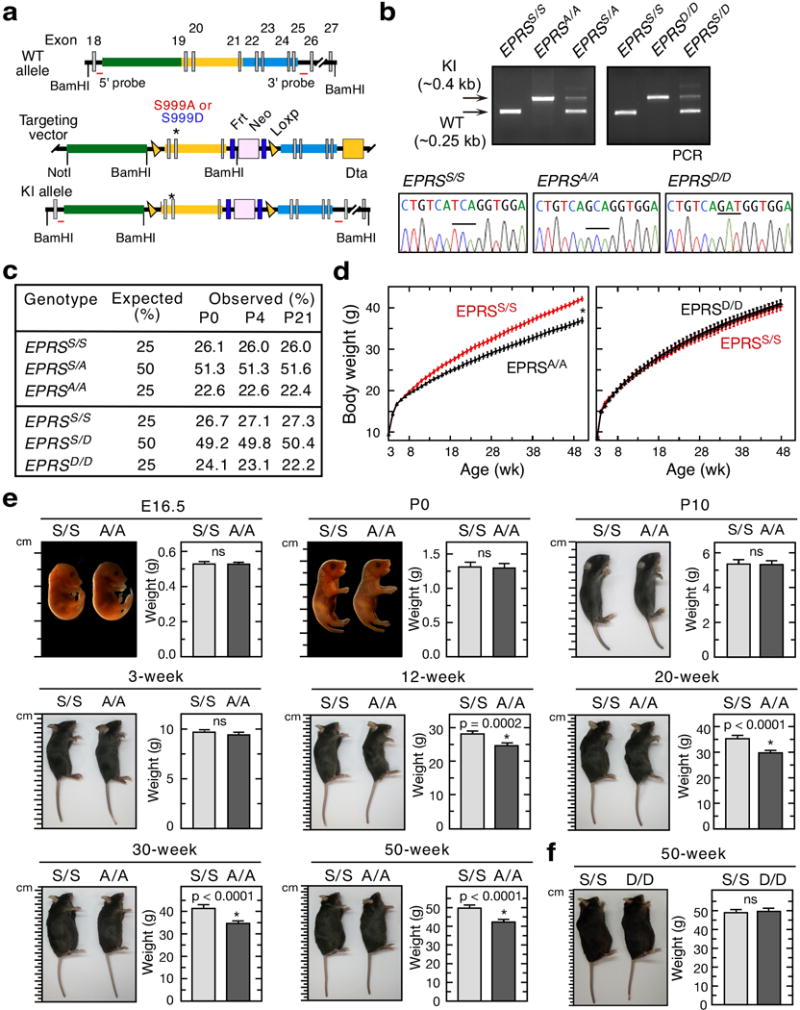
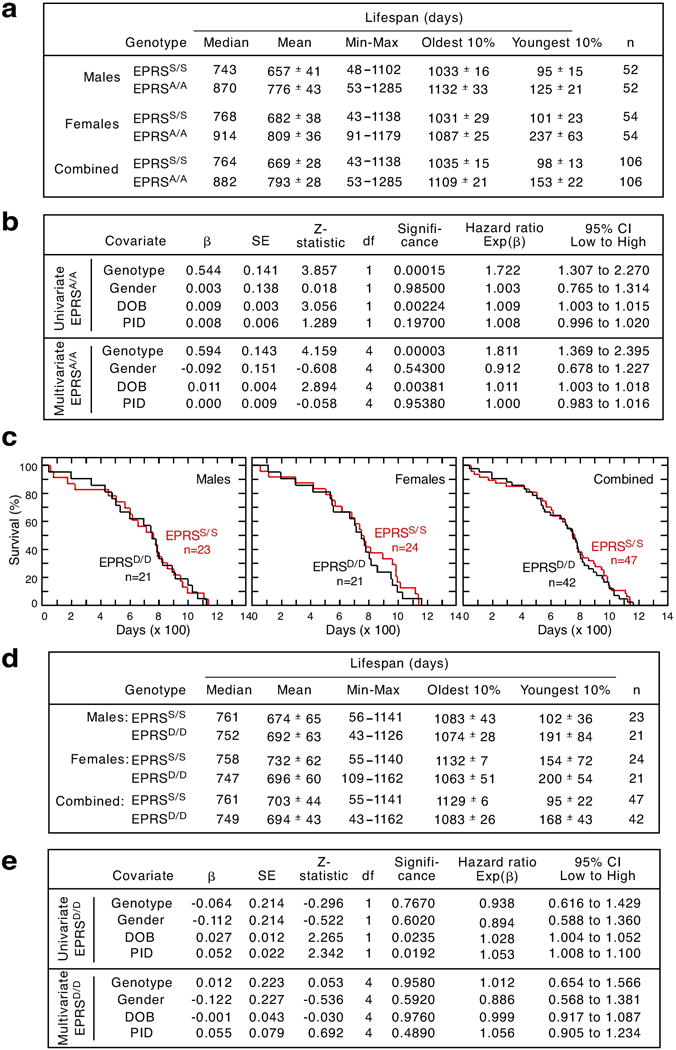
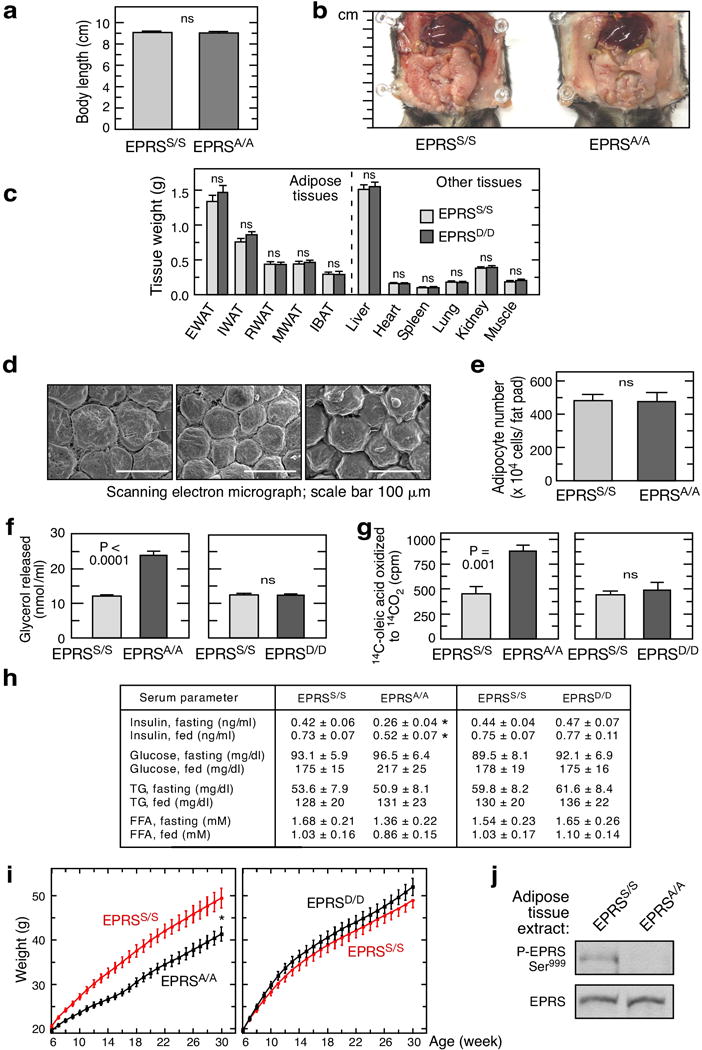
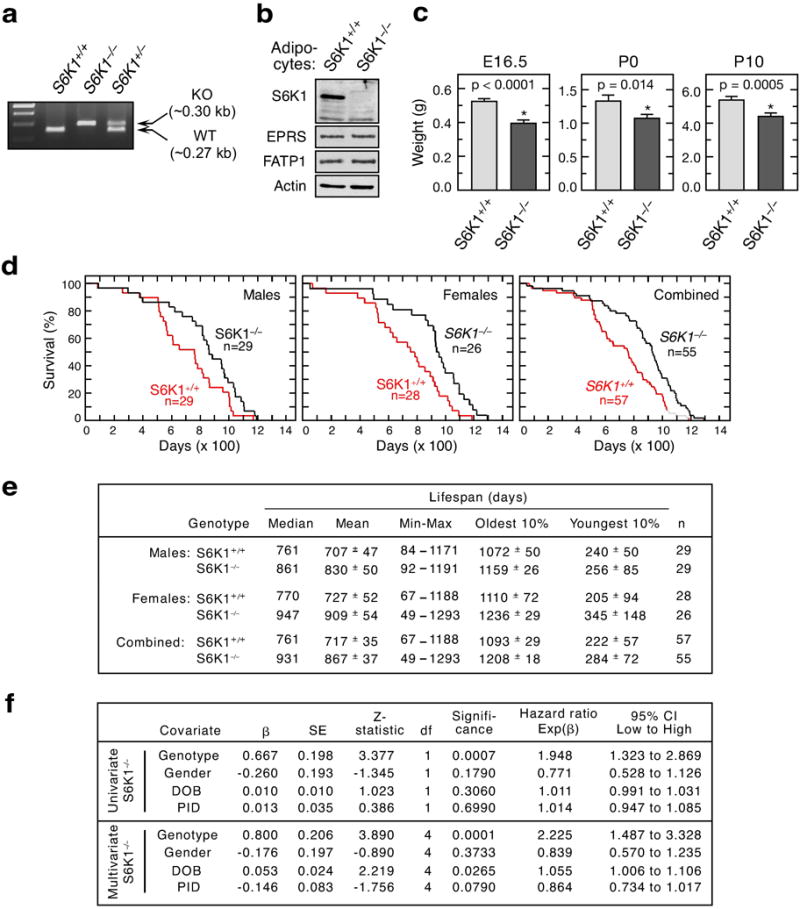
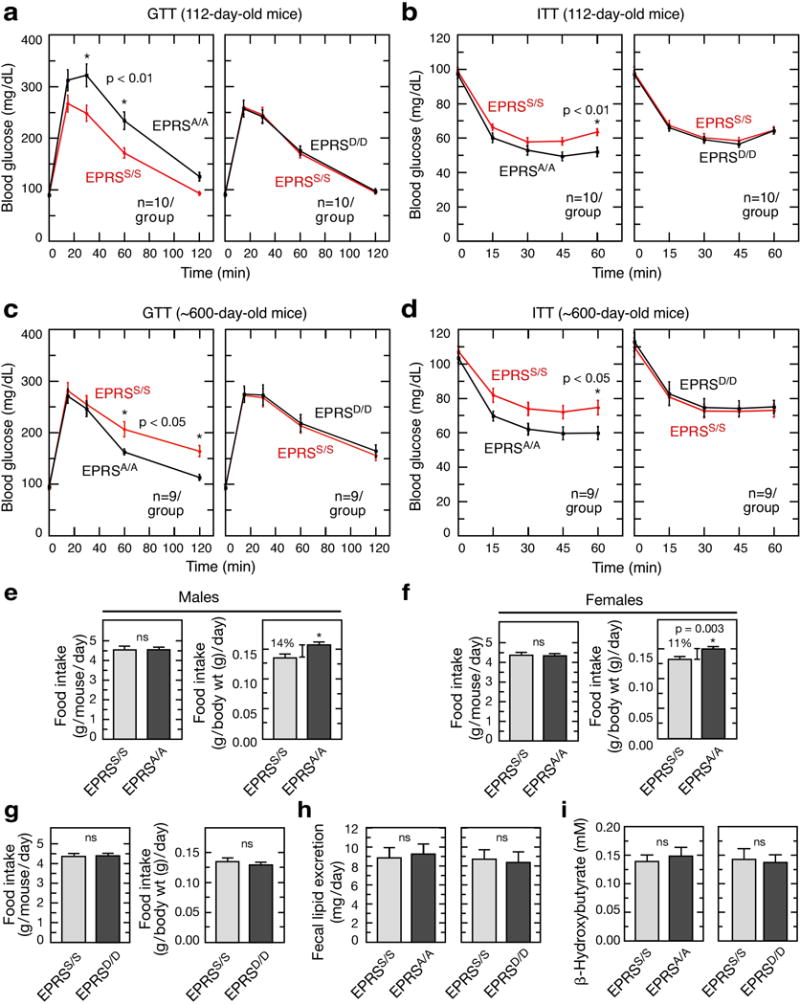
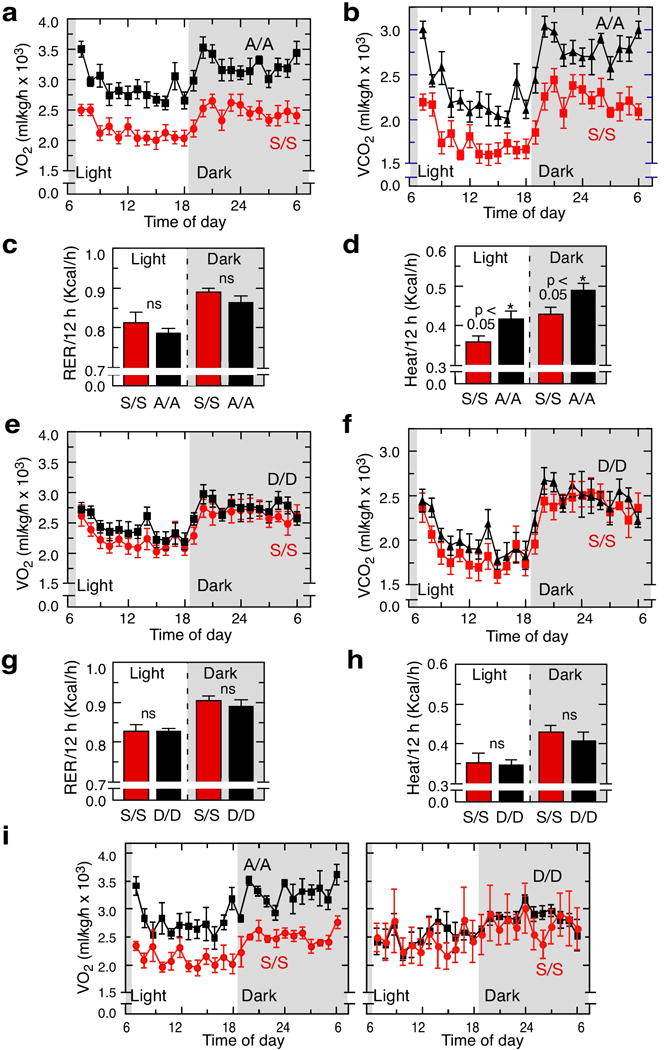
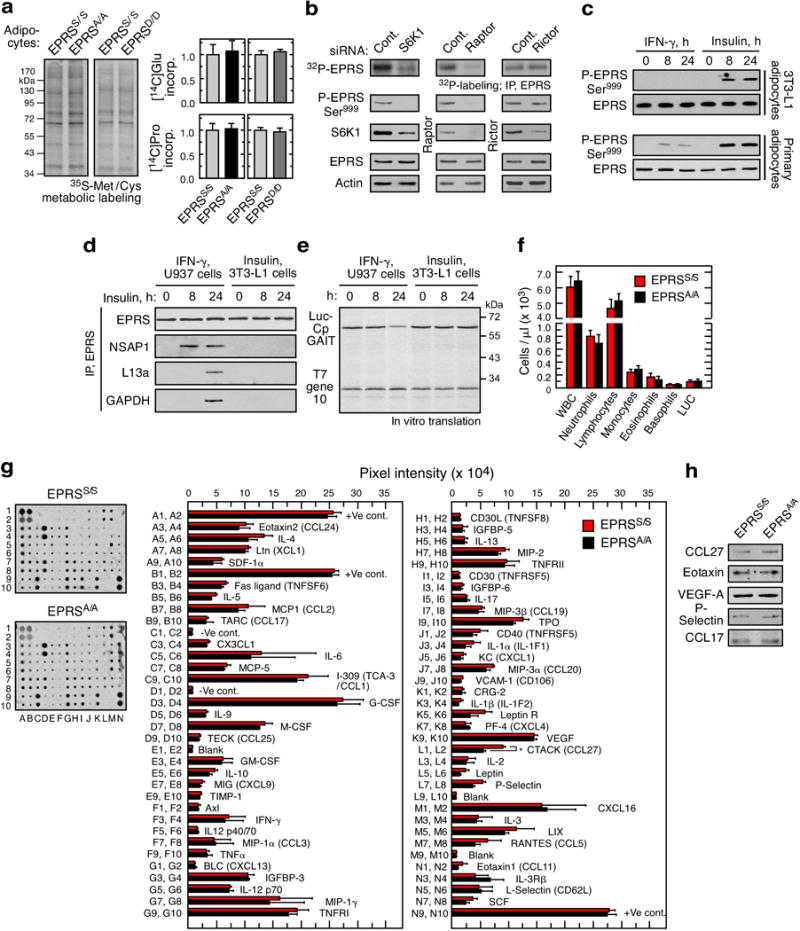
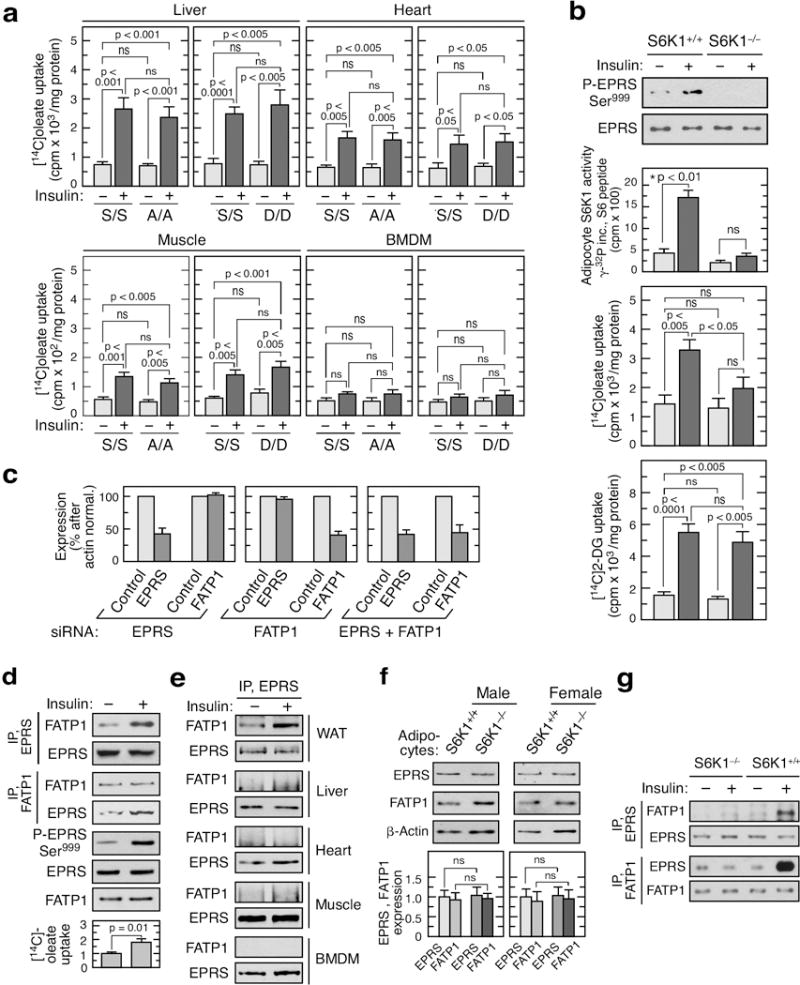
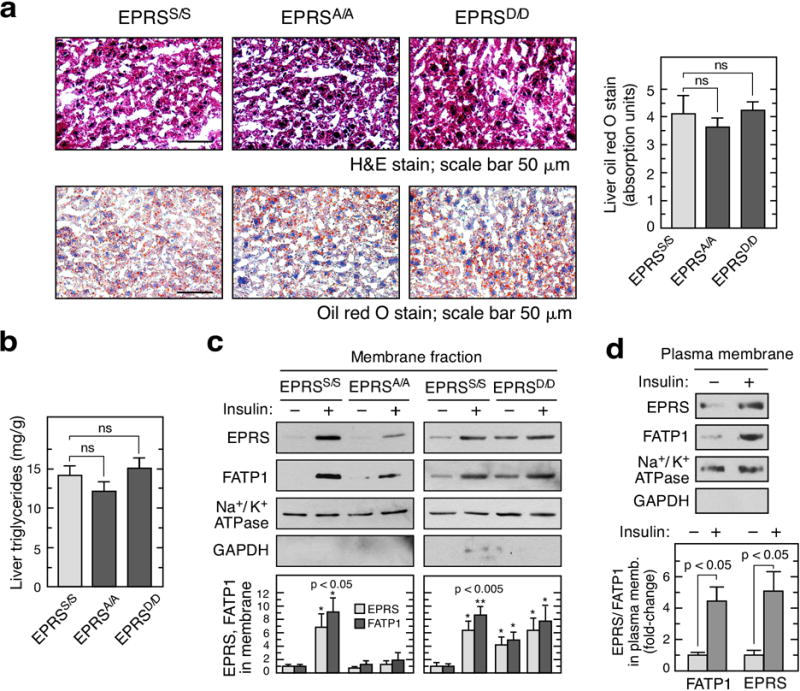
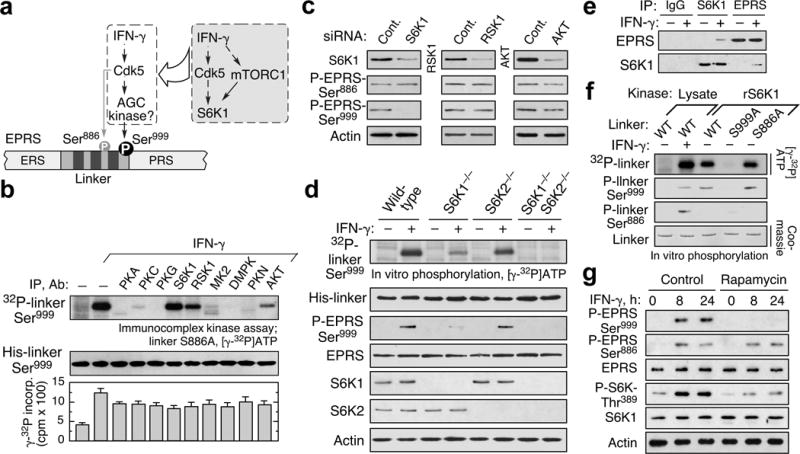
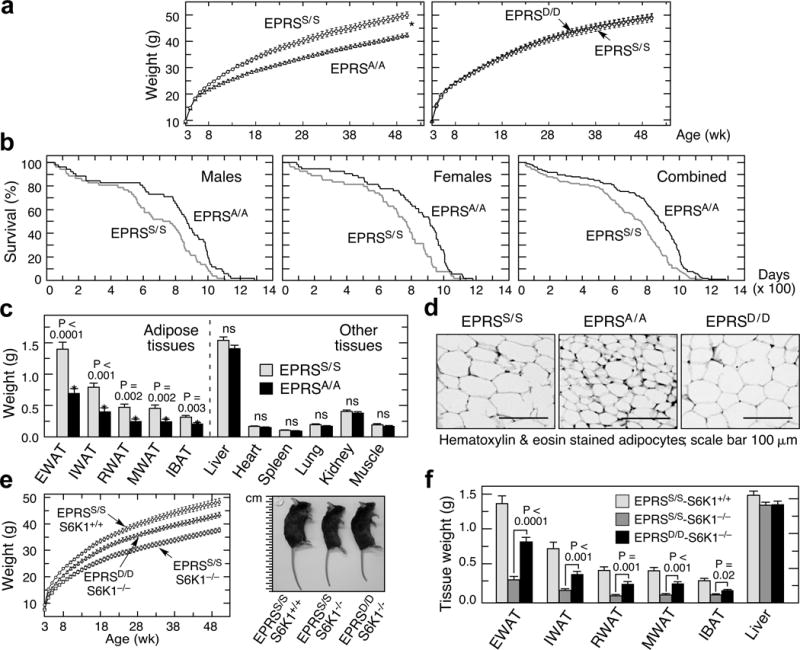
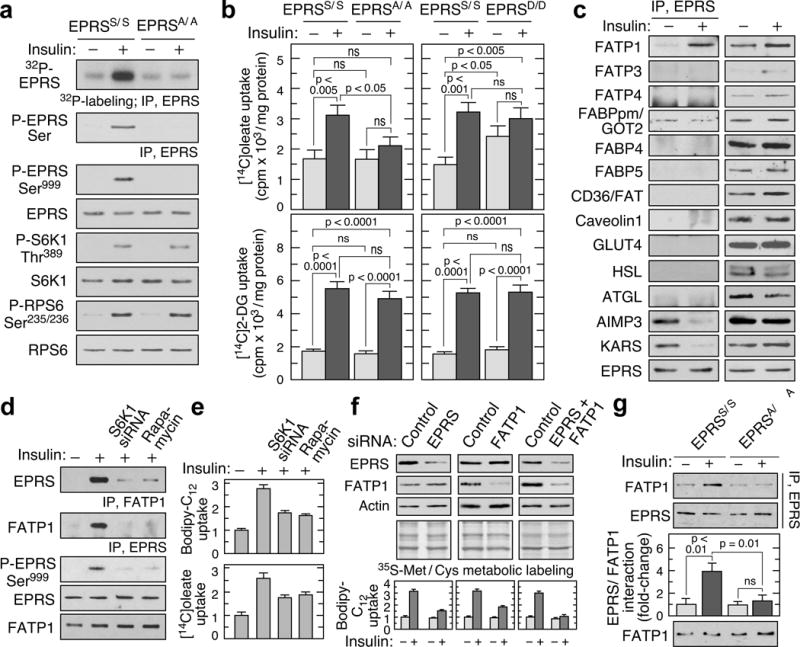
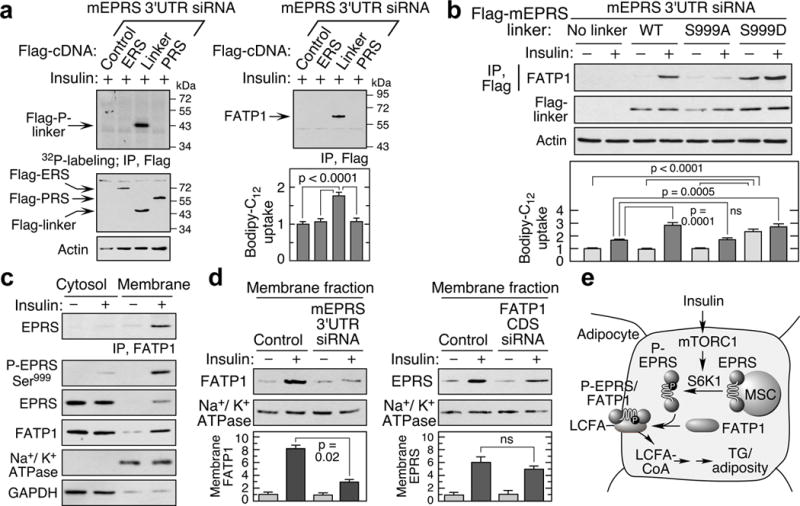
Metabolic pathways that contribute to adiposity and ageing are activated by the mammalian target of rapamycin complex 1 (mTORC1) and p70 ribosomal protein S6 kinase 1 (S6K1) axis. However, known mTORC1-S6K1 targets do not account for observed loss-of-function phenotypes, suggesting that there are additional downstream effectors of this pathway. Here we identify glutamyl-prolyl-tRNA synthetase (EPRS) as an mTORC1-S6K1 target that contributes to adiposity and ageing. Phosphorylation of EPRS at Ser999 by mTORC1-S6K1 induces its release from the aminoacyl tRNA multisynthetase complex, which is required for execution of noncanonical functions of EPRS beyond protein synthesis. To investigate the physiological function of EPRS phosphorylation, we generated Eprs knock-in mice bearing phospho-deficient Ser999-to-Ala (S999A) and phospho-mimetic (S999D) mutations. Homozygous S999A mice exhibited low body weight, reduced adipose tissue mass, and increased lifespan, similar to S6K1-deficient mice and mice with adipocyte-specific deficiency of raptor, an mTORC1 constituent. Substitution of the EprsS999D allele in S6K1-deficient mice normalized body mass and adiposity, indicating that EPRS phosphorylation mediates S6K1-dependent metabolic responses. In adipocytes, insulin stimulated S6K1-dependent EPRS phosphorylation and release from the multisynthetase complex. Interaction screening revealed that phospho-EPRS binds SLC27A1 (that is, fatty acid transport protein 1, FATP1), inducing its translocation to the plasma membrane and long-chain fatty acid uptake. Thus, EPRS and FATP1 are terminal mTORC1-S6K1 axis effectors that are critical for metabolic phenotypes.


Conflict of interest statement

The authors declare no competing financial interests.

Figures

Extended Data Figure 1
Extended Data Figure 1. Identification of S6K1 as EPRS Ser999 kinase
a, Screening of AGC kinase group members for phosphorylation of EPRS Ser999 by immunocomplex kinase assay and [γ-32P]ATP-labeling with S886A linker target in U937 cells. Kinase activity using kinase-specific substrate is shown (bottom; mean ± SEM, n = 3). b, Specificity of S6K1 for Ser999 phosphorylation, determined by 32P incorporation in wild-type (WT), S999A and S886 linker. c, siRNA targeting S6K1 inhibits IFN-γ-stimulated EPRS phosphorylation in U937 cells determined by 32P-labeling (mean ± SEM, n = 3). d, Active recombinant kinases used for in vitro phosphorylation of linker bearing S886A (Ser999 P-acceptor) mutation shows site-specific phosphorylation by S6K1. e, Raptor not rictor is required for Ser999 phosphorylation. f, siRNA targeting the S6K1 3’UTR inhibits S6K1 expression and phosphorylation of EPRS Ser999, but not Ser886 (mean ± SEM, n = 3). g, Phosphorylation of S6K1 Thr389 is required for phosphorylation of EPRS. Cells were co-transfected with siRNA targeting the 3’UTR to knock down endogenous S6K1, and with myc-tagged wild-type or mutant S6K1 cDNA; IFN-γ-stimulated EPRS phosphorylation determined by 32P-labeling (mean ± SEM, n = 3). h, Cells treated as in (e) but followed by reciprocal co-immunoprecipitation.
Extended Data Figure 2
Extended Data Figure 2. Gene targeting and generation of EPRSA/A and EPRSD/D knock-in mice, and their body weight phenotypes
a, Knock-in mice bearing Ser999-to-Ala and -Asp mutations were generated by homologous recombination. b, Validation of wild-type (EPRSS/S) and EPRS knock-in mice by PCR genotyping (top) and sequence analysis (bottom). c, Genotype analysis of littermates. Total of 1410 and 644 progeny from interbreeding EPRSS/A and EPRSS/D mice, respectively, were used at postnatal days P0, P4, and P21. d, Growth curves of EPRSA/A (mean ± SEM, n = 10/group; P < 0.0001, 2-way ANOVA) and EPRSD/D (n = 10/group) female mice. e, Representative images (left) and weights (right) of wild-type (EPRSS/S; S/S) and EPRSA/A (A/A) mice on embryonic day E16.5 and post-embryonic development stages. Data shown are mean ± SEM; n = 11 for E16.5 embryos, n = 10 for P0 and P10 mice, and n = 14 for 3, 12, 20, 30, and 50-week mice. f, Representative images (left) and weights (right) of 50-week S/S and EPRSD/D (D/D) mice (mean ± SEM; n = 10/group).
Extended Data Figure 3
Extended Data Figure 3. Lifespan analysis of EPRSS/S, EPRSA/A and EPRSD/D mice monitored from weaning (>21 days)
a, Youngest and oldest 10% are the mean lifespan of the shortest- and longest-living 10% mice. Numbers of days are represented to nearest full day. Median and mean ± SEM are shown. b, Cox proportional hazard (CPH) regression analyses of EPRSS/S and EPRSA/A mice shows genotype as the most significant predictor of increased longevity. Longevity relative to survival days (i.e., age at death) was analyzed in pooled mice by CPH regression model. The 4 independent variables genotype, date of birth (DOB), parental ID (PID), and gender were replaced with a set of category variables. In case of genotype and gender, category represents their presence or absence. DOB and PID data were divided into multiple categories as described in the supplementary methods. Independent variables were fitted into the CPH model individually (univariate) or simultaneously (multivariate). Shown are: β(the unstandardized regression coefficient) with standard error (SE), the degrees of freedom (df), and the significance for each model fit. Exp(β) for the covariate of interest is the predicted change in hazard ratio for a unit increase in the predictor, and its 95% confidence interval (CI). c, Kaplan-Meier survival curves show no change in lifespan of male, female, or combined EPRSD/D mice. Male (MC χ2 = 0.003, P = 0.956; GBW χ2 = 0.001, P = 0.972), female (MC χ2 = 0.158, P = 0. 0.691; GBW χ2= 0.206, P = 0.650), and gender-combined (MC χ2 = 0.079, P = 0. 0.779; GBW χ2= 0.076, P = 0.783). d and e, Survival and CPH regression analyses of EPRSS/S and EPRSD/D mice as described above in a and b.
Extended Data Figure 4
Extended Data Figure 4. Adipose tissue deposition and lipolysis in EPRSA/A and EPRSD/D mice
a, Length of mice was measured from head to beginning of tail using a digital caliper (Fisherbrand Traceable). Data shown are mean ± SEM, n = 15 for 20-week male mice. b, Ventral view of wild-type and EPRSA/A mice abdominal cavity. c, Weights of adipose and non-adipose tissues from 20-week male EPRSD/D and control mice (mean ± SEM, n = 14/group, P value from unpaired t-test). d, Scanning electron micrographs of EWAT in 20-week male EPRSS/S, EPRSA/A, and EPRSD/D mice. e, Total adipocyte cell number in EWAT of EPRSA/A knock-in and wild-type mice. Data represent mean ± SEM, n = 5/group. f, Elevated lipolysis in adipocytes from EPRSA/A, but not EPRSD/D, mice (mean ± SEM; n = 6/group). g, Elevated β-oxidation in WAT explants from EPRSA/A mice as determined by release of 14CO2 from 14C-oleic acid (mean ± SEM; n = 5/group). h, Serum levels of insulin, glucose, triglycerides (TG) and free fatty acids (FFA) in 12-h fasted and 1-h post-prandial (fed) 16-week old male mice (mean ± SEM, n = 10/group, *P < 0.05, unpaired t-test). i, Growth curves of EPRSA/A and EPRSD/D mice (males, n = 12/group, mean ± SEM, P < 0.001, 2-way ANOVA) started at 6 wk on an unrestricted high-fat diet (HFD, Harlan Teklad TD.06414) deriving 18, 60, and 21 kcal% from protein, fat, and carbohydrate, respectively. j, Phosphorylation of EPRS Ser999 in WAT from EPRSA/A and EPRSD/D mice after HFD feeding for 24 wk.
Extended Data Figure 5
Extended Data Figure 5. Adiposity and lifespan of S6K1−/− mice
a, PCR genotyping of wild-type (S6K1+/+), heterozygous (S6K1+/–) and homozygous (S6K1−/−) mice. b, Immunoblot analysis of S6K1, EPRS, and FATP1 in S6K1−/− mice. c, Weight of S6K1−/− mice at embryonic day E16.5, and at postnatal days P0 and P10. d, Kaplan-Meier survival curves shows increased longevity in male, female or combined S6K1−/− mice. Male (n = 29/group; MC χ2 = 4.919, P = 0.027; GBW χ2 = 4.660, P = 0.031), female (n = 28 for S6K1+/+ and n = 26 for S6K1−/−; MC χ2 = 7.927, P = 0.005; GBW χ2= 7.277, P = 0.007), and gender-combined (n = 26 for S6K1+/+ and n = 55 for S6K1−/−; MC χ2 = 11.78, P = 0.0006; GBW χ2= 11.01, P = 0.0009). e and f, Lifespan and CPH regression analyses of S6K1+/+ and S6K1−/− mice as described above in Extended Data Fig. 3a,b.
Extended Data Figure 6
Extended Data Figure 6. Glucose metabolism, food intake and fecal lipid excretion in EPRSA/A and EPRSD/D mice
a, Glucose tolerance test (GTT) in 112-day-old EPRSS/S, EPRSA/A, and EPRSD/D mice (mean ± SEM, n = 10/group). b, Insulin tolerance test (ITT) on mice as in (a; mean ± SEM, n = 10/group). c,d, Same as a,b but using ~600-day-old mice (mean ± SEM, n = 9/group). e-g, Determination of food intake as g/mouse/day (left) or g/body weight (g)/day (right in male (e) and female (f) EPRSA/A mice, and in male EPRSD/D mice (g). All values represent mean ± SEM, n = 14/group. h, Fecal lipid excretion in EPRSS/S, EPRSA/A, and EPRSD/D mice (mean ± SEM, n = 6/group). i, Serum ketone body (β-hydroxybutyrate) level in 6-h fasted mice.
Extended Data Figure 7
Extended Data Figure 7. Energy metabolism in EPRSA/A and EPRSD/D mice
a,b, Determination of VO2 (left) and VCO2 (right) in EPRSS/S and EPRSA/A male mice over a 24-hour period. c,d, Respiratory exchange ratio (RER) (left) and heat generation (right) in 12-h light and dark cycles were determined (mean ± SEM, n = 6/group). e-h, Same as (a-d) but comparing EPRSS/S and EPRSD/D male mice (mean ± SEM, n = 6/group). i, Determination of VO2 in female EPRSS/S, EPRSA/A, and EPRSD/D mice (mean ± SEM, n = 3/group).
Extended Data Figure 8
Extended Data Figure 8. Absence of GAIT pathway in adipocytes and inflammatory response in EPRSA/A mice
a, Total protein synthesis determined by [35S]Met/Cys labeling (left), and by incorporation of [14C]Glu and [14C]Pro into TCA-precipitated proteins in adipocytes from EPRSS/S, EPRSA/A, and EPRSD/D mice. b, Effect of siRNA-mediated knockdown of S6K1, raptor, and rictor on phosphorylation of EPRS Ser999 in differentiated mouse 3T3-L1 adipocytes in presence of 100 nM insulin. c, Effect of IFN-γ and insulin on phosphorylation of EPRS Ser999 in differentiated 3T3-L1 adipocytes or mouse primary adipocytes determined using phospho-specific EPRS antibody. d, GAIT complex formation in IFN-γ-stimulated U937 cells and insulin-stimulated 3T3-L1 adipocytes by immunoprecipitation with anti-EPRS antibody and immunoblot with antibodies against GAIT complex constituents. Cytosolic lysates from IFN-γ-treated U937 cells served as positive control. e, Determination of GAIT pathway activity in IFN-γ-stimulated U937 cells and insulin-stimulated 3T3-L1 adipocytes by in vitro translation of a control (T7 gene 10) and GAIT element bearing (Luc-ceruloplasmin (Cp) GAIT element) reporter RNAs. f, White blood cells (WBC) counts in blood from EPRSS/S and EPRSA/A mice by Advia hematology system (LUC, large unstained cells). g, Determination of cytokine levels in serum from EPRSS/S and EPRSA/A mice. Mouse cytokine antibody arrays were incubated with serum (100 μg, protein, right). Pixel intensity was determined by densitometry (right; mean ± SEM, 2 mice/group). h, Immunoblot analysis of selected cytokines in serum from EPRSS/S and EPRSA/A mice.
Extended Data Figure 9
Extended Data Figure 9. Tissue-specificity of insulin-stimulated LCFA uptake and EPRS-FATP1 interaction
a, [14C]oleate uptake determined in insulin-stimulated hepatocytes, cardiac cells, soleus muscle strips, and BMDM from EPRSS/S, EPRSA/A, and EPRSD/D mice (mean ± SEM, n = 6 mice/group). b, Insulin-stimulated EPRS Ser999 phosphorylation (top), [14C]oleate uptake (middle), and [14C]2-deoxy-D-glucose (DG) uptake (bottom) in adipocytes from white adipose tissue of S6K1+/+ and S6K1−/− mice (mean ± SEM, n = 5 mice/group). c, Efficiency of EPRS and FATP1 knockdown in 3T3-L1 adipocytes by siRNA targeting each mRNA alone and in combination, as determined by densitometry (NIH image J) of immunoblots shown in Fig. 3g (mean ± SEM, n = 4 experiments). d, Insulin-induced EPRS Ser999 phosphorylation, interaction with FATP1, and [14C]oleate uptake in human adipocytes (mean ± SEM, n = 3 experiments in duplicate). e, Co-immunoprecipitation experiment to determine FATP1 binding to EPRS in lysates from multiple tissues as indicated. f, EPRS and FATP1 expression in male and female S6K1−/− mice (mean ± SEM, n = 3 mice/group). g, Lack of interaction of EPRS and FATP1 in insulin-stimulated adipocytes of S6K1−/− mice.
Extended Data Figure 10
Extended Data Figure 10. Hepatic lipids and FATP1/EPRS membrane localization in EPRSA/A and EPRSD/D mice
a, Optimum cutting temperature (OCT) compound-fixed liver slices from EPRSS/S, EPRSA/A, and EPRSD/D mice were stained with H&E (top) or oil red O (bottom), and the latter quantitated by densitometry (right; mean ± SEM, n = 3 mice/group). b, Determination of liver triglycerides in wild-type and mutant mice (mean ± SEM, n = 5 mice/group). c, Insulin-inducible membrane localization of EPRS and FATP1 in adipocytes from wild-type and mutant mice. d, Membrane fractionation shows EPRS and FATP1 co-localizing in plasma membrane (mean ± SEM, n = 3 experiments).
Figure 1
Figure 1. mTORC1-S6K1 phosphorylates EPRS at Ser999
a, Schematic of IFN-γ-induced EPRS phosphorylation. Inset, pathway responsible for EPRS Ser999 phosphorylation. b, Immunocomplex kinase assay shows S6K1 phosphorylates Ser999 in EPRS linker bearing S886A mutation. Kinase activity determined with kinase-specific peptides (mean ± SEM, n = 3). c, S6K1 is required for Ser999 phosphorylation in 4-h IFN-γ-treated, siRNA-targeted PBMs. d, S6K1 is the primary S6K isoform that phosphorylates Ser999 determined using BMDM of S6K1−/−, S6K2−/−, and double-knockout mice. e, IFN-γ induces S6K1-EPRS interaction determined by co-immunoprecipitation. f, Recombinant full-length S6K1 directly phosphorylates Ser999 determined by [γ-32P]ATP labeling and by phospho-specific antibodies. g, Rapamycin (10 nM) blocks S6K1 activation and Ser999 phosphorylation in U937 cells.
Figure 2
Figure 2. Reduced adiposity and extended lifespan of EPRSA/A mice
a, Growth curves of EPRSA/A (males, mean ± SEM, n = 14/group; P < 0.0001, 2-way ANOVA) and EPRSD/D (n = 10/group) mice. b, Kaplan-Meier survival curves for male (n = 52/group; log rank Mantel-cox (MC) χ2 = 6.75, P = 0.009; Gehan-Breslow-Wilcoxon (GBW) χ2 = 6.24, P = 0.012), female (n = 54/group; MC χ2 = 7.92, P = 0. 0.005; GBW χ2= 8.91, P = 0.003), and gender-combined (n = 106/group; MC χ2 = 15.28, P ≤ 0. 0.0001; GBW χ2= 14.96, P = 0.0001) EPRSS/S and EPRSA/A mice. c, Weights of white adipose tissues (WAT) (epididymal, EWAT; inguinal, IWAT; mesenteric, MWAT; retroperitoneal, RWAT) and interscapular brown adipose tissue (IBAT), from 20-week male mice; excised calf muscle comprised gastrocnemicus, soleus and plantaris from fascia (mean ± SEM, n = 14/group, P value from unpaired t-test). d, Histological micrographs of EWAT in 20-week male wild-type (EPRSS/S), EPRSA/A, and EPRSD/D mice. e, Growth of S6K1-null (EPRSS/S/S6K1−/−) and wild-type mice (EPRSS/S/S6K1+/+), and S6K1-null mice bearing S999D allele (EPRSD/D/S6K1−/−) (mean ± SEM, n = 10 males/group; P < 0.0001, 2-way ANOVA). Representative 20-week male mice (right). f, Tissues weights of 20-week mice of genotypes described in (f) (mean ± SEM, n = 10 males/group).
Figure 3
Figure 3. Insulin induces EPRS-FATP1 interaction and LCFA uptake
a, Ser999 phosphorylation in insulin-treated adipocytes by 32P-labeling and by immunoblot with anti-phospho-Ser and -phospho-Ser999 antibodies. b, Insulin-induced LCFA uptake is reduced in EPRSA/A but not EPRSD/D adipocytes (top, mean ± SEM, n = 10 mice/group). Insulin-induced deoxyglucose uptake is similar in all mice types (bottom, mean ± SEM, n = 6 mice/group). c, EPRS interaction screen of adipose tissue fatty acid binding proteins/transporters in insulin-treated 3T3-L1 adipocytes. d, Verification of EPRS-FATP1 interaction by two-way co-immunoprecipitation, and inhibition by S6K1 knockdown or rapamycin. e, S6K1 knockdown and mTORC1 inhibition block insulin-induced uptake of bodipy-dodecanoate (top) and [14C]oleate (bottom) (mean ± SEM, n = 4 experiments in duplicate). f, siRNA-mediated knockdown of EPRS, FATP1, or both (top) inhibits LCFA uptake (bottom; mean ± SEM, n = 4 experiments in duplicate) without affecting protein synthesis. g, Insulin-inducible EPRS-FATP1 interaction is significantly reduced in EPRSA/A adipocytes (mean ± SEM, n = 10 mice/group).
Figure 4
Figure 4. EPRS linker binds FATP1 and induces membrane translocation
a, Insulin induces EPRS linker phosphorylation, binding to FATP1, and LCFA uptake. Endogenous EPRS in 3T3-L1 adipocytes was knocked down by 3′UTR-specific siRNA and cells transfected with Flag-tagged EPRS domains (ERS, PRS, and linker), and insulin-stimulated phosphorylation determined by 32P-labeling (left). Binding of EPRS domains to FATP1 was detected by co-immunoprecipitation, and LCFA uptake measured (mean ± SEM, n = 4 experiments in duplicate) (right). b, Expression of phospho-mimetic S999D linker facilitates interaction with FATP1 and fatty acid uptake even without insulin (mean ± SEM, n = 3 experiments in duplicate). c, Insulin induces translocation of Ser999-phosphorylated EPRS and FATP1 to membranes. Anti-GAPDH and -Na+/K+ ATPase antibodies verified cytosolic and membrane isolation. d, Effect of knockdown of EPRS (left) and FATP1 (targeting the coding sequence [CDS], right) on translocation to membrane. e, Schematic of mTORC1-S6K1 activation of EPRS and FATP1-mediated LCFA uptake in adipocytes.

Comment in

Similar articles

Cited by

References

    1. Johnson SC, Rabinovitch PS, Kaeberlein M. mTOR is a key modulator of ageing and age-related disease. Nature. 2013;493:338–345. - PMC - PubMed
    1. Lamming DW, Sabatini DM. A Central role for mTOR in lipid homeostasis. Cell Metab. 2013;18:465–469. - PMC - PubMed
    1. Fontana L, Partridge L, Longo VD. Extending healthy life span–from yeast to humans. Science. 2010;328:321–326. - PMC - PubMed
    1. Tumaneng K, Russell RC, Guan KL. Organ size control by Hippo and TOR pathways. Curr Biol. 2012;22:R368–379. - PMC - PubMed
    1. Magnuson B, Ekim B, Fingar DC. Regulation and function of ribosomal protein S6 kinase (S6K) within mTOR signalling networks. Biochem J. 2012;441:1–21. - PubMed

Publication types

MeSH terms