

Computational investigation of sphingosine kinase 1 (SphK1) and calcium dependent ERK1/2 activation downstream of VEGFR2 in endothelial cells
- PMID: 28178265
- PMCID: PMC5298229
- DOI: 10.1371/journal.pcbi.1005332
Computational investigation of sphingosine kinase 1 (SphK1) and calcium dependent ERK1/2 activation downstream of VEGFR2 in endothelial cells
Abstract
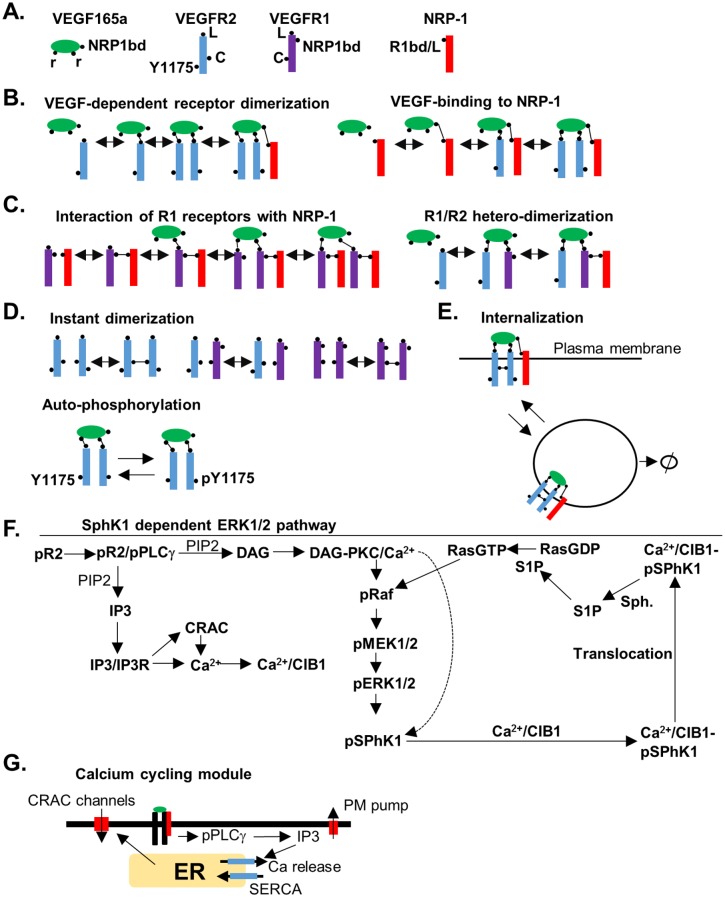
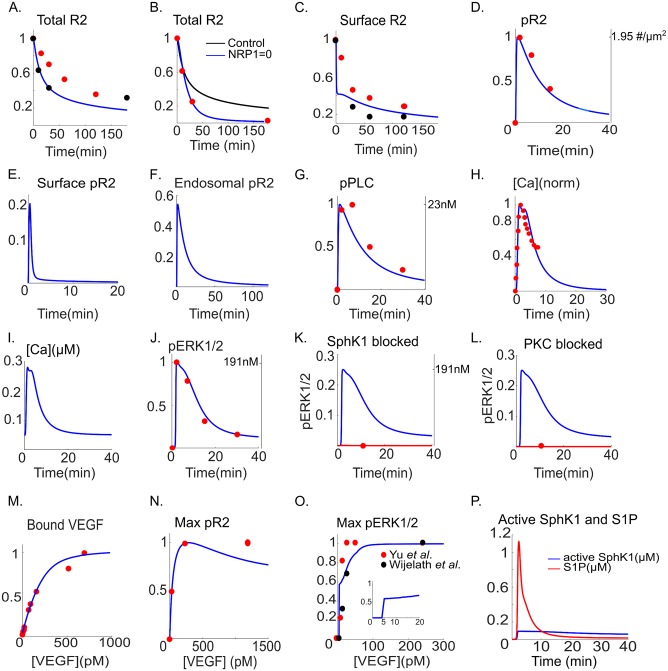
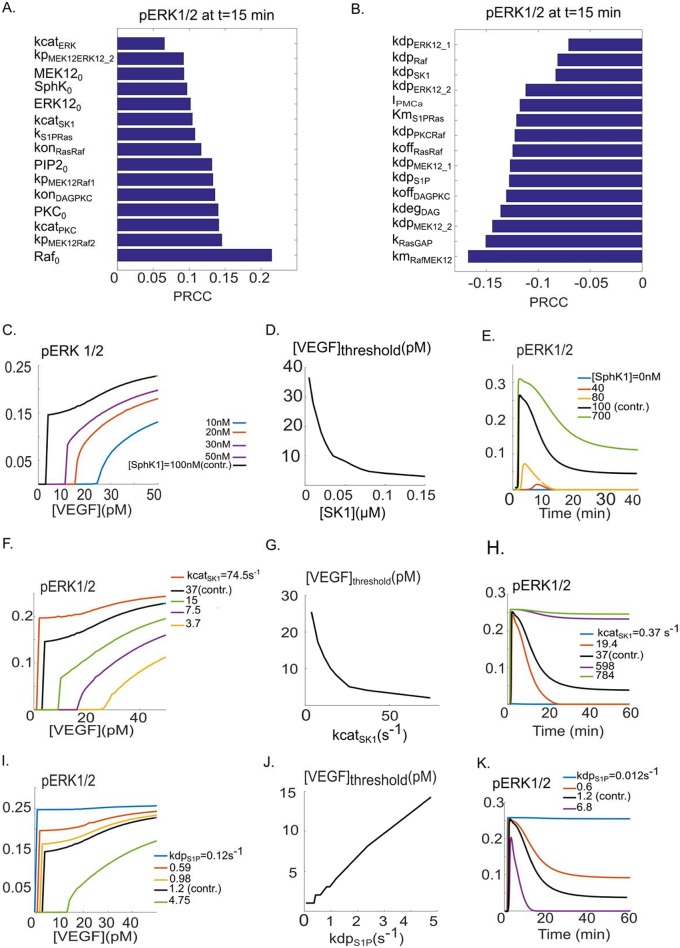
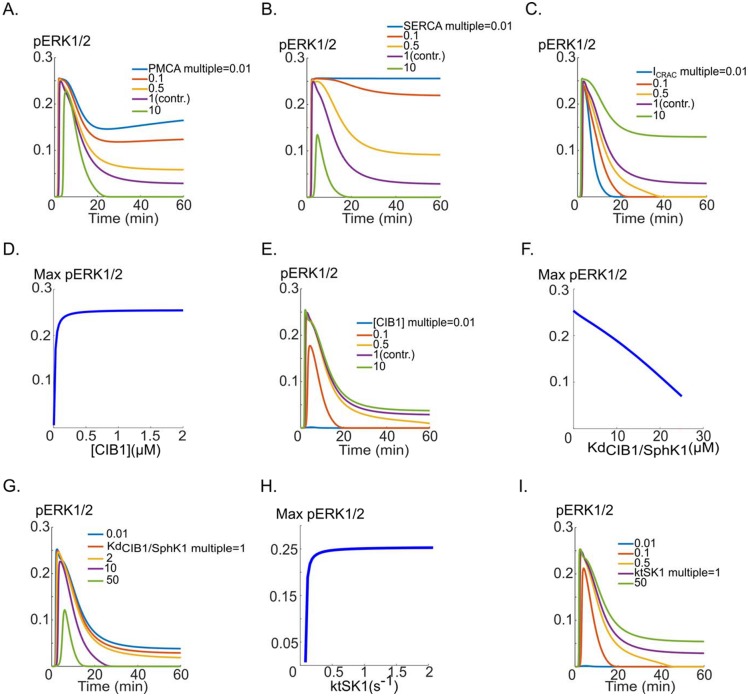
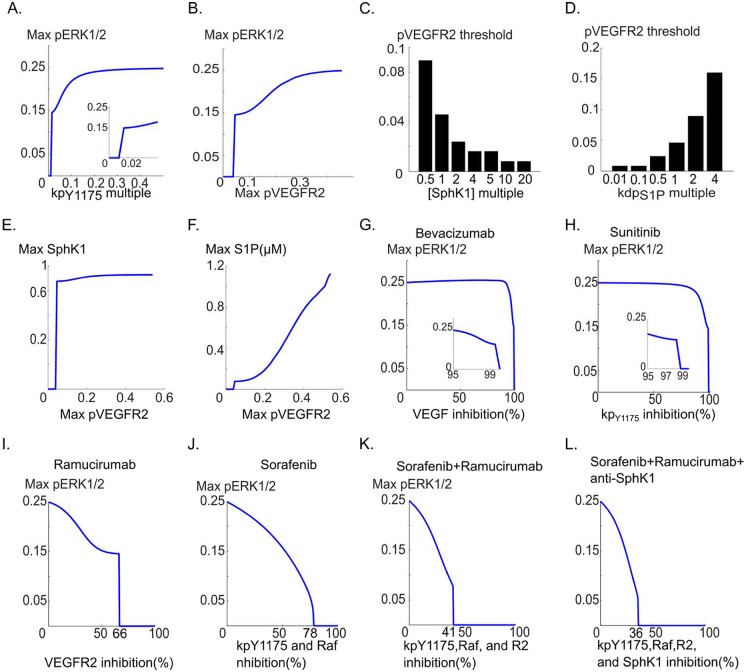
Vascular endothelial growth factor (VEGF) is a powerful regulator of neovascularization. VEGF binding to its cognate receptor, VEGFR2, activates a number of signaling pathways including ERK1/2. Activation of ERK1/2 is experimentally shown to involve sphingosine kinase 1 (SphK1) activation and its calcium-dependent translocation downstream of ERK1/2. Here we construct a rule-based computational model of signaling downstream of VEGFR2, by including SphK1 and calcium positive feedback mechanisms, and investigate their consequences on ERK1/2 activation. The model predicts the existence of VEGF threshold in ERK1/2 activation that can be continuously tuned by cellular concentrations of SphK1 and sphingosine 1 phosphate (S1P). The computer model also predicts powerful effects of perturbations in plasma and ER calcium pump rates and the current through the CRAC channels on ERK1/2 activation dynamics, highlighting the critical role of intracellular calcium in shaping the pERK1/2 signal. The model is then utilized to simulate anti-angiogenic therapeutic interventions targeting VEGFR2-ERK1/2 axis. Simulations indicate that monotherapies that exclusively target VEGFR2 phosphorylation, VEGF, or VEGFR2 are ineffective in shutting down signaling to ERK1/2. By simulating therapeutic strategies that target multiple nodes of the pathway such as Raf and SphK1, we conclude that combination therapy should be much more effective in blocking VEGF signaling to EKR1/2. The model has important implications for interventions that target signaling pathways in angiogenesis relevant to cancer, vascular diseases, and wound healing.
Conflict of interest statement
The authors have declared that no competing interests exist.
Figures
Similar articles
-
Combining Multikinase Tyrosine Kinase Inhibitors Targeting the Vascular Endothelial Growth Factor and Cluster of Differentiation 47 Signaling Pathways Is Predicted to Increase the Efficacy of Antiangiogenic Combination Therapies.ACS Pharmacol Transl Sci. 2023 Apr 18;6(5):710-726. doi: 10.1021/acsptsci.3c00008. eCollection 2023 May 12. ACS Pharmacol Transl Sci. 2023. PMID: 37200806 Free PMC article.
-
Geniposide alleviates VEGF-induced angiogenesis by inhibiting VEGFR2/PKC/ERK1/2-mediated SphK1 translocation.Phytomedicine. 2022 Jun;100:154068. doi: 10.1016/j.phymed.2022.154068. Epub 2022 Mar 22. Phytomedicine. 2022. PMID: 35358930
-
Cryptotanshinone inhibits VEGF-induced angiogenesis by targeting the VEGFR2 signaling pathway.Microvasc Res. 2017 May;111:25-31. doi: 10.1016/j.mvr.2016.12.011. Epub 2016 Dec 28. Microvasc Res. 2017. PMID: 28040437
-
Vascular endothelial growth factor (VEGF)-Receptor2: its biological functions, major signaling pathway, and specific ligand VEGF-E.Endothelium. 2006 Mar-Apr;13(2):63-9. doi: 10.1080/10623320600697955. Endothelium. 2006. PMID: 16728325 Review.
-
VEGF-A-stimulated signalling in endothelial cells via a dual receptor tyrosine kinase system is dependent on co-ordinated trafficking and proteolysis.Biochem Soc Trans. 2009 Dec;37(Pt 6):1193-7. doi: 10.1042/BST0371193. Biochem Soc Trans. 2009. PMID: 19909245 Review.
Cited by
-
Computational modeling of synergistic interaction between αVβ3 integrin and VEGFR2 in endothelial cells: Implications for the mechanism of action of angiogenesis-modulating integrin-binding peptides.J Theor Biol. 2018 Oct 14;455:212-221. doi: 10.1016/j.jtbi.2018.06.029. Epub 2018 Jul 20. J Theor Biol. 2018. PMID: 30036530 Free PMC article.
-
Mechanistically detailed systems biology modeling of the HGF/Met pathway in hepatocellular carcinoma.NPJ Syst Biol Appl. 2019 Aug 16;5:29. doi: 10.1038/s41540-019-0107-2. eCollection 2019. NPJ Syst Biol Appl. 2019. PMID: 31452933 Free PMC article.
-
Modeling triple-negative breast cancer heterogeneity: Effects of stromal macrophages, fibroblasts and tumor vasculature.J Theor Biol. 2018 Sep 7;452:56-68. doi: 10.1016/j.jtbi.2018.05.003. Epub 2018 May 8. J Theor Biol. 2018. PMID: 29750999 Free PMC article.
-
Calcium as a signal integrator in developing epithelial tissues.Phys Biol. 2018 May 16;15(5):051001. doi: 10.1088/1478-3975/aabb18. Phys Biol. 2018. PMID: 29611534 Free PMC article. Review.
-
Endothelial Ca2+ Signaling, Angiogenesis and Vasculogenesis: just What It Takes to Make a Blood Vessel.Int J Mol Sci. 2019 Aug 14;20(16):3962. doi: 10.3390/ijms20163962. Int J Mol Sci. 2019. PMID: 31416282 Free PMC article. Review.
References
-
- Folkman J (2002) Role of angiogenesis in tumor growth and metastasis. Semin Oncol 29: 15–18. - PubMed
MeSH terms
Substances
Grants and funding
LinkOut - more resources
Full Text Sources
Other Literature Sources
Molecular Biology Databases
Research Materials
Miscellaneous
