

Influence of ocean acidification on plankton community structure during a winter-to-summer succession: An imaging approach indicates that copepods can benefit from elevated CO2 via indirect food web effects
- PMID: 28178268
- PMCID: PMC5298333
- DOI: 10.1371/journal.pone.0169737
Influence of ocean acidification on plankton community structure during a winter-to-summer succession: An imaging approach indicates that copepods can benefit from elevated CO2 via indirect food web effects
Abstract
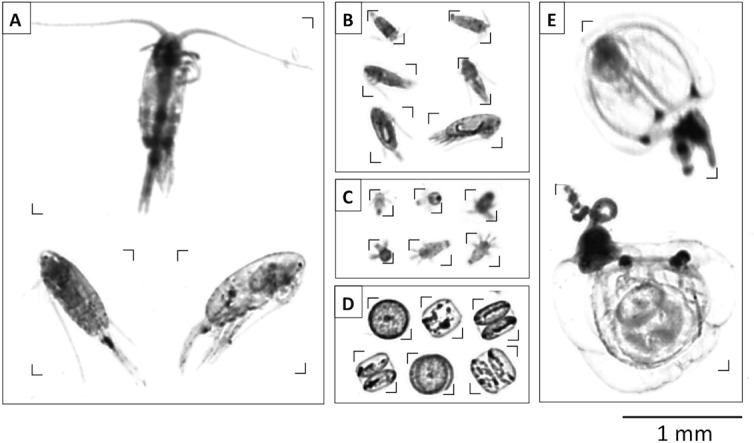
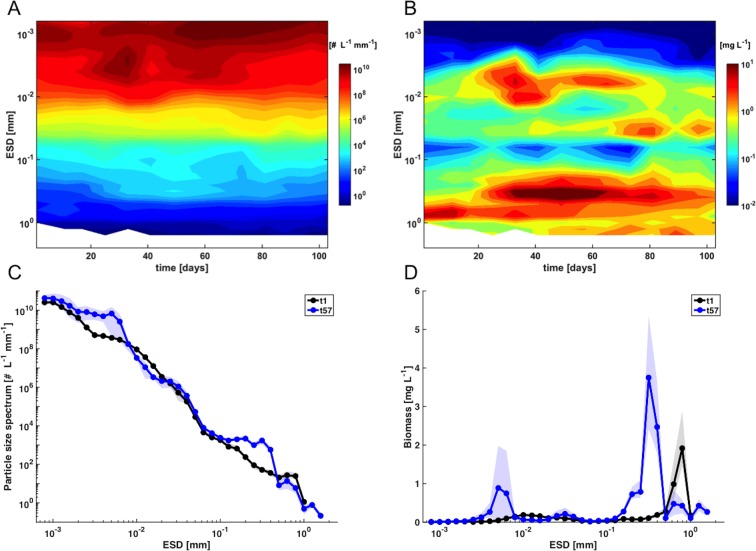
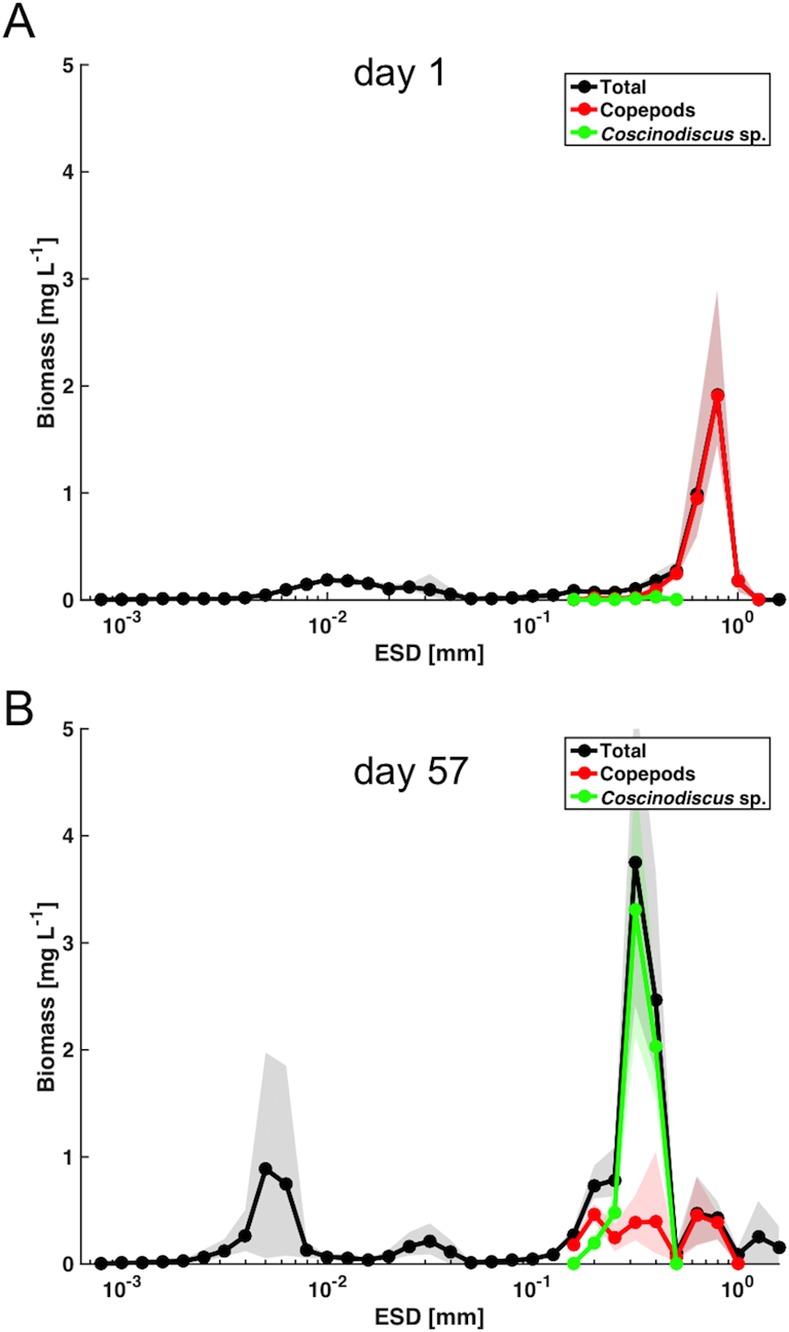
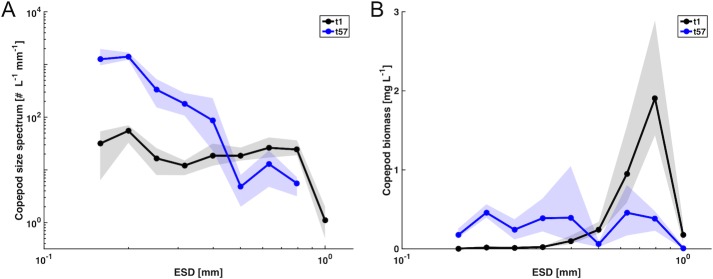
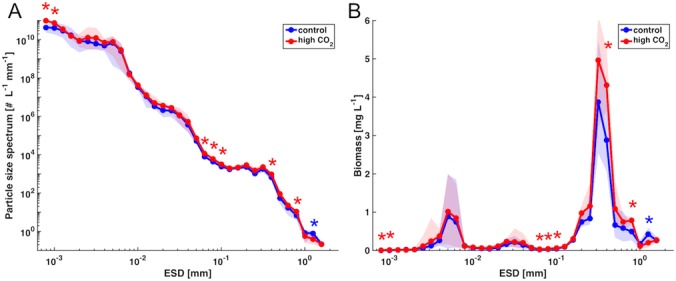
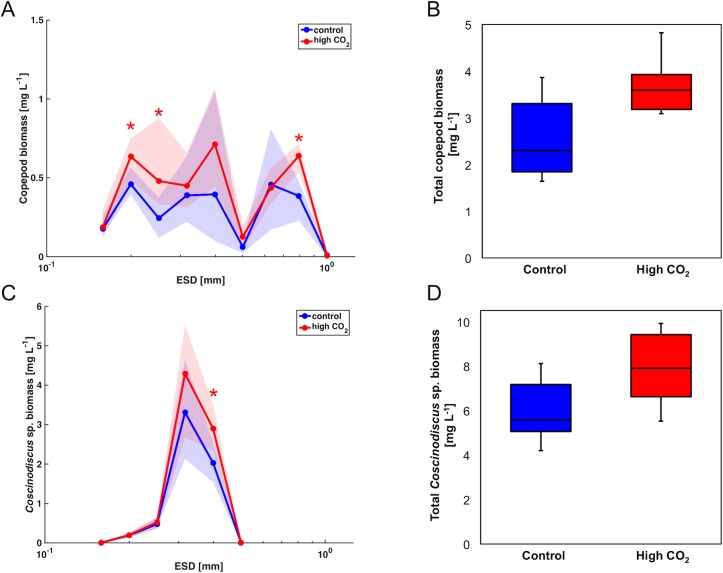
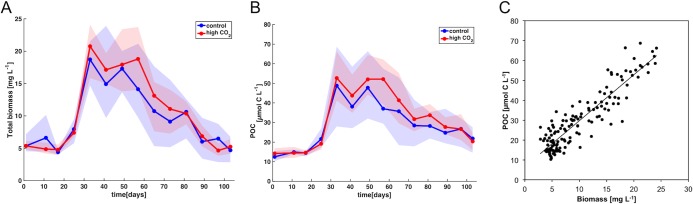
Plankton communities play a key role in the marine food web and are expected to be highly sensitive to ongoing environmental change. Oceanic uptake of anthropogenic carbon dioxide (CO2) causes pronounced shifts in marine carbonate chemistry and a decrease in seawater pH. These changes-summarized by the term ocean acidification (OA)-can significantly affect the physiology of planktonic organisms. However, studies on the response of entire plankton communities to OA, which also include indirect effects via food-web interactions, are still relatively rare. Thus, it is presently unclear how OA could affect the functioning of entire ecosystems and biogeochemical element cycles. In this study, we report from a long-term in situ mesocosm experiment, where we investigated the response of natural plankton communities in temperate waters (Gullmarfjord, Sweden) to elevated CO2 concentrations and OA as expected for the end of the century (~760 μatm pCO2). Based on a plankton-imaging approach, we examined size structure, community composition and food web characteristics of the whole plankton assemblage, ranging from picoplankton to mesozooplankton, during an entire winter-to-summer succession. The plankton imaging system revealed pronounced temporal changes in the size structure of the copepod community over the course of the plankton bloom. The observed shift towards smaller individuals resulted in an overall decrease of copepod biomass by 25%, despite increasing numerical abundances. Furthermore, we observed distinct effects of elevated CO2 on biomass and size structure of the entire plankton community. Notably, the biomass of copepods, dominated by Pseudocalanus acuspes, displayed a tendency towards elevated biomass by up to 30-40% under simulated ocean acidification. This effect was significant for certain copepod size classes and was most likely driven by CO2-stimulated responses of primary producers and a complex interplay of trophic interactions that allowed this CO2 effect to propagate up the food web. Such OA-induced shifts in plankton community structure could have far-reaching consequences for food-web interactions, biomass transfer to higher trophic levels and biogeochemical cycling of marine ecosystems.
Conflict of interest statement
The authors have declared that no competing interests exist.
Figures
Similar articles
-
Ocean acidification effects on mesozooplankton community development: Results from a long-term mesocosm experiment.PLoS One. 2017 Apr 14;12(4):e0175851. doi: 10.1371/journal.pone.0175851. eCollection 2017. PLoS One. 2017. PMID: 28410436 Free PMC article.
-
Influence of Ocean Acidification on a Natural Winter-to-Summer Plankton Succession: First Insights from a Long-Term Mesocosm Study Draw Attention to Periods of Low Nutrient Concentrations.PLoS One. 2016 Aug 15;11(8):e0159068. doi: 10.1371/journal.pone.0159068. eCollection 2016. PLoS One. 2016. PMID: 27525979 Free PMC article.
-
Enhanced transfer of organic matter to higher trophic levels caused by ocean acidification and its implications for export production: A mass balance approach.PLoS One. 2018 May 25;13(5):e0197502. doi: 10.1371/journal.pone.0197502. eCollection 2018. PLoS One. 2018. PMID: 29799856 Free PMC article.
-
Effects of ocean acidification on copepods.Aquat Toxicol. 2018 Mar;196:17-24. doi: 10.1016/j.aquatox.2018.01.004. Epub 2018 Jan 5. Aquat Toxicol. 2018. PMID: 29324394 Review.
-
Ocean acidification: the other CO2 problem.Ann Rev Mar Sci. 2009;1:169-92. doi: 10.1146/annurev.marine.010908.163834. Ann Rev Mar Sci. 2009. PMID: 21141034 Review.
Cited by
-
The Influence of pCO2-Driven Ocean Acidification on Open Ocean Bacterial Communities during A Short-Term Microcosm Experiment in the Eastern Tropical South Pacific (ETSP) off Northern Chile.Microorganisms. 2020 Dec 4;8(12):1924. doi: 10.3390/microorganisms8121924. Microorganisms. 2020. PMID: 33291533 Free PMC article.
-
A deep learning-enabled portable imaging flow cytometer for cost-effective, high-throughput, and label-free analysis of natural water samples.Light Sci Appl. 2018 Sep 19;7:66. doi: 10.1038/s41377-018-0067-0. eCollection 2018. Light Sci Appl. 2018. PMID: 30245813 Free PMC article.
-
Ecological and functional consequences of coastal ocean acidification: Perspectives from the Baltic-Skagerrak System.Ambio. 2019 Aug;48(8):831-854. doi: 10.1007/s13280-018-1110-3. Epub 2018 Dec 1. Ambio. 2019. PMID: 30506502 Free PMC article. Review.
-
Ocean Acidification and Human Health.Int J Environ Res Public Health. 2020 Jun 24;17(12):4563. doi: 10.3390/ijerph17124563. Int J Environ Res Public Health. 2020. PMID: 32599924 Free PMC article. Review.
-
Ocean acidification effects on mesozooplankton community development: Results from a long-term mesocosm experiment.PLoS One. 2017 Apr 14;12(4):e0175851. doi: 10.1371/journal.pone.0175851. eCollection 2017. PLoS One. 2017. PMID: 28410436 Free PMC article.
References
-
- IPCC. Climate Change 2013: The physical science basis. Working Group I Contribution to the Fifth Assessment Report of the Intergovernmental Panel on Climate Change. Stocker TF, Qin D, Plattner GK, Tignor M, Allen SK, Boschung J, et al., editors. Cambridge, United Kingdom and New York, NY, USA: Cambridge University Press; 2014.
-
- Le Quéré C, Raupach MR, Canadell JG, Marland G, Bopp L, Ciais P, et al. Trends in the sources and sinks of carbon dioxide. Nature Geoscience. 2009;2(12):831–6.
-
- Zeebe RE, Wolf-Gladrow D. CO2 in Seawater: Equilibrium, Kinetics, Isotopes: Equilibrium, Kinetics, Isotopes: Access Online via Elsevier; 2001.
-
- IPCC. Climate Change 2014: Impacts, Adaptation, and Vulnerability. Part A: Global and Sectoral Aspects. Contribution of Working Group II to the Fifth Assessment Report of the Intergovernmental Panel on Climate Change. Field CB, Barros VR, Dokken DJ, Mach KJ, Mastrandrea MD, Bilir TE, et al., editors. Cambridge, United Kingdom and New York, NY, USA: Cambridge University Press; 2014. 1132 p.
MeSH terms
Substances
LinkOut - more resources
Full Text Sources
Other Literature Sources
