. 2017 Feb 8;12(2):e0171594.
doi: 10.1371/journal.pone.0171594. eCollection 2017.

Identification of a vacuolar proton channel that triggers the bioluminescent flash in dinoflagellates

Affiliations

Identification of a vacuolar proton channel that triggers the bioluminescent flash in dinoflagellates

Juan D Rodriguez et al. PLoS One. .

Abstract

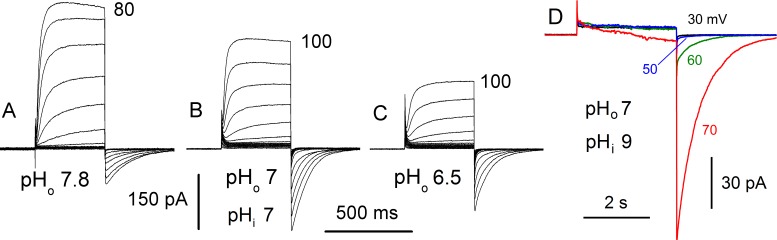
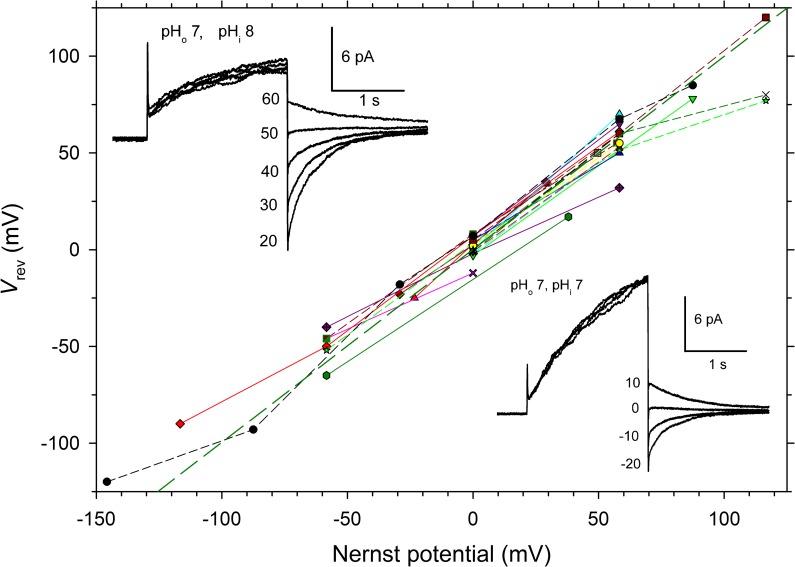
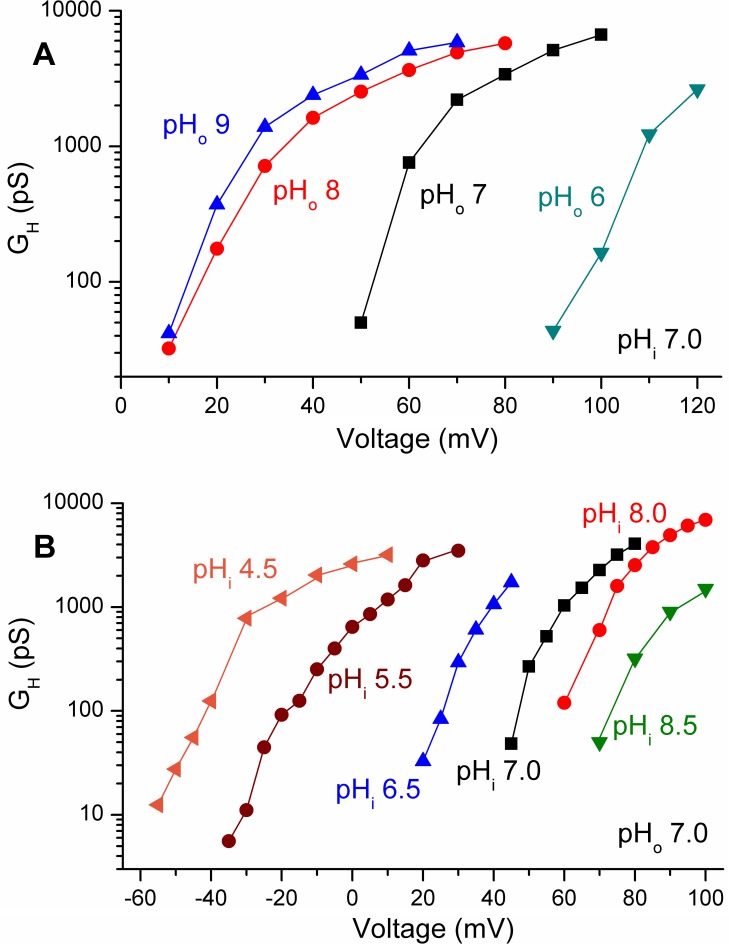
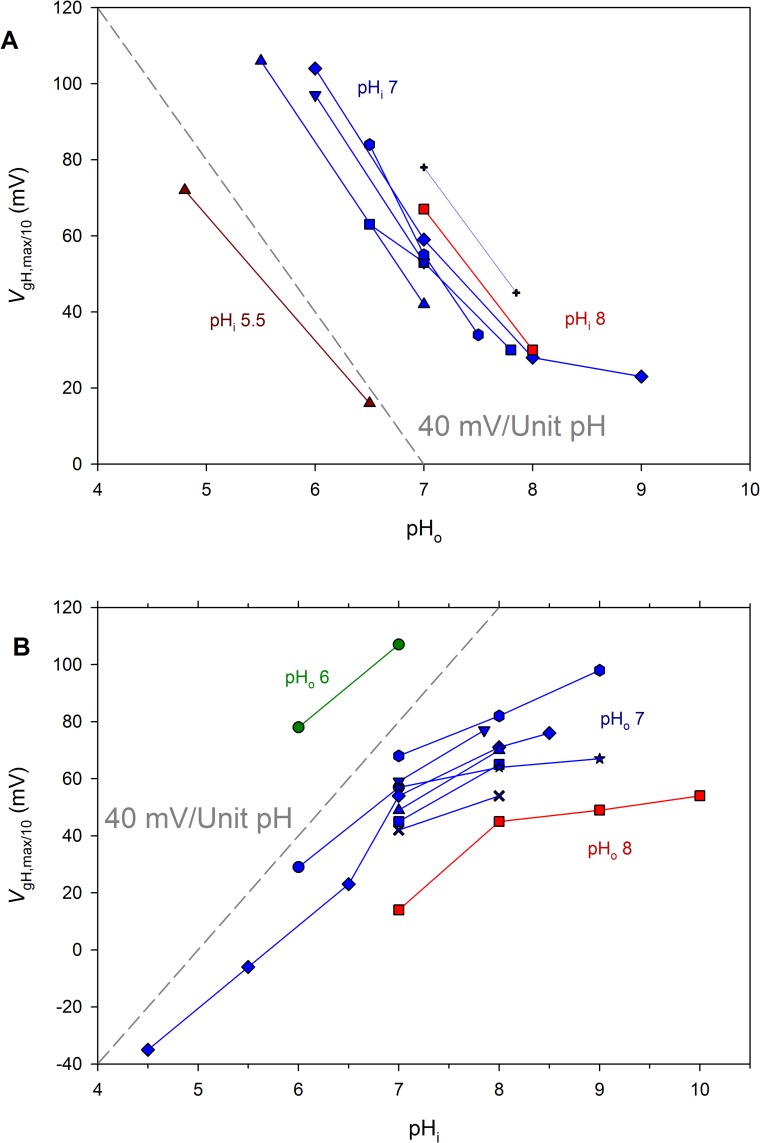
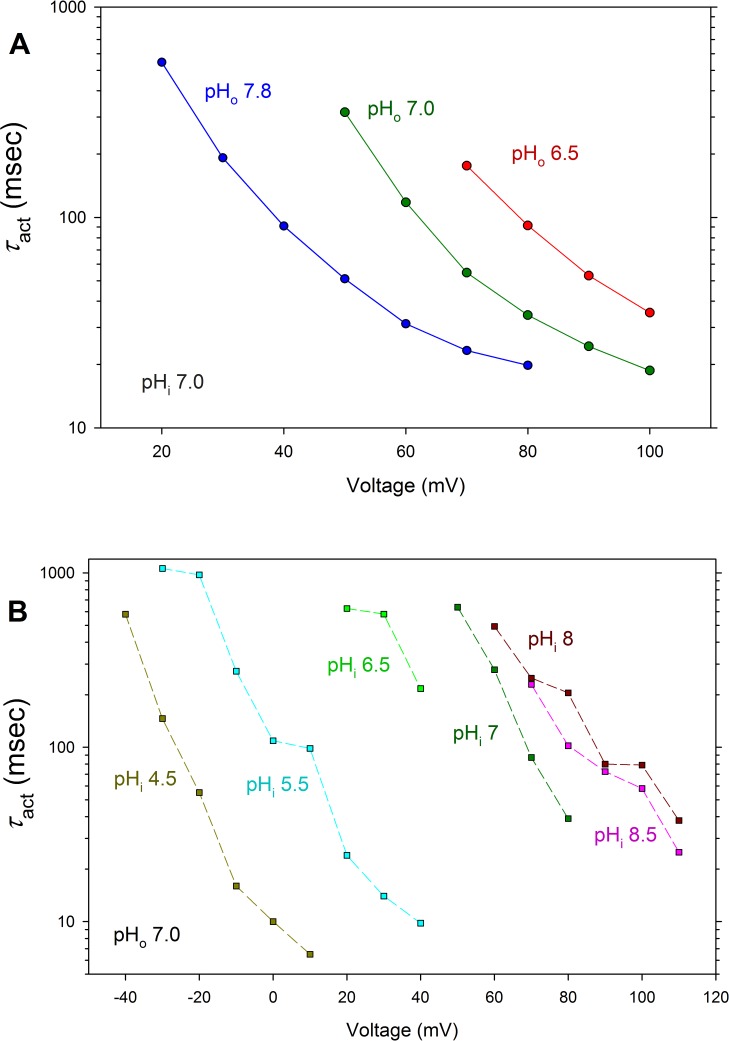
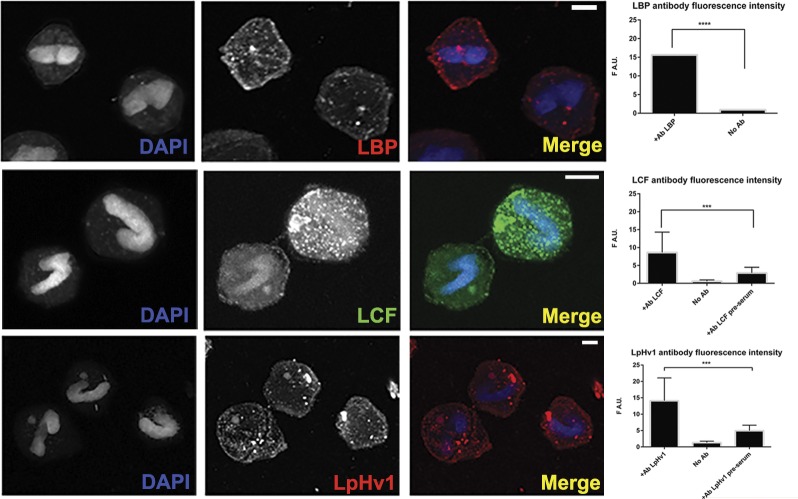
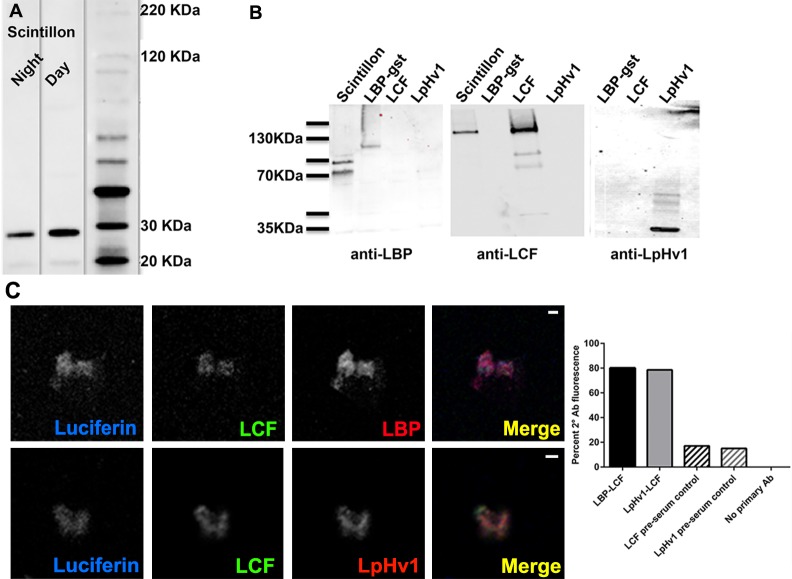
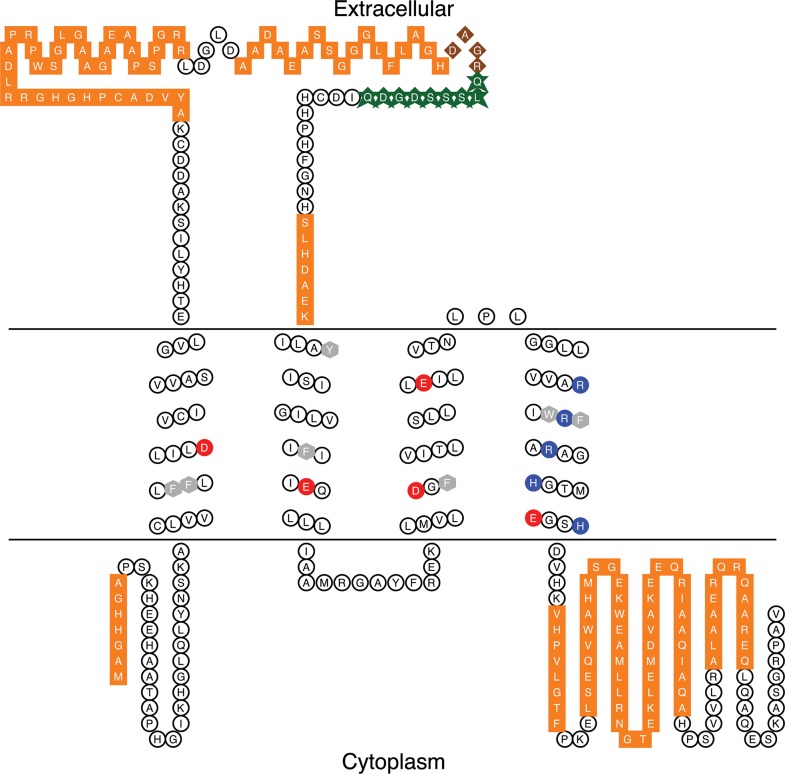
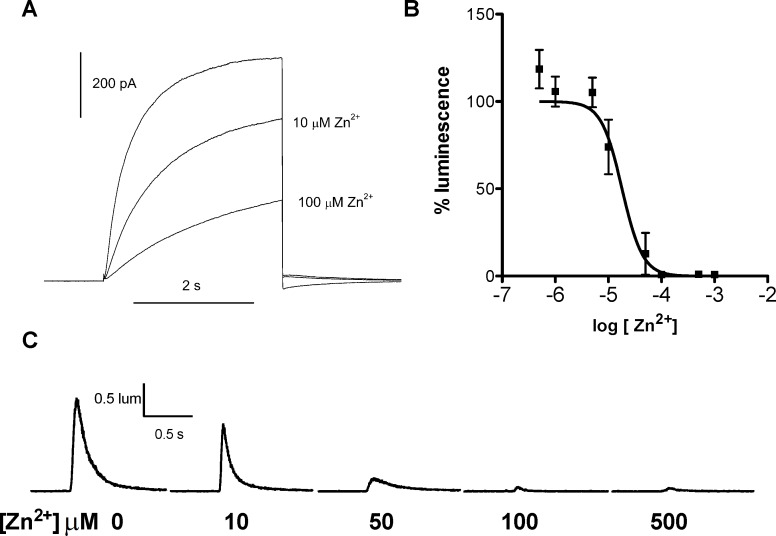
In 1972, J. Woodland Hastings and colleagues predicted the existence of a proton selective channel (HV1) that opens in response to depolarizing voltage across the vacuole membrane of bioluminescent dinoflagellates and conducts protons into specialized luminescence compartments (scintillons), thereby causing a pH drop that triggers light emission. HV1 channels were subsequently identified and demonstrated to have important functions in a multitude of eukaryotic cells. Here we report a predicted protein from Lingulodinium polyedrum that displays hallmark properties of bona fide HV1, including time-dependent opening with depolarization, perfect proton selectivity, and characteristic ΔpH dependent gating. Western blotting and fluorescence confocal microscopy of isolated L. polyedrum scintillons immunostained with antibody to LpHV1 confirm LpHV1's predicted organellar location. Proteomics analysis demonstrates that isolated scintillon preparations contain peptides that map to LpHV1. Finally, Zn2+ inhibits both LpHV1 proton current and the acid-induced flash in isolated scintillons. These results implicate LpHV1 as the voltage gated proton channel that triggers bioluminescence in L. polyedrum, confirming Hastings' hypothesis. The same channel likely mediates the action potential that communicates the signal along the tonoplast to the scintillon.


Conflict of interest statement

The authors have declared that no competing interests exist.

Figures

Fig 1
Fig 1. LpHV1 is a voltage gated proton channel.
(A-C) Families of whole-cell proton currents at different pHo in a cell transfected with LpHV1, with pHi 7.0. Voltage pulses were applied from a holding potential of -60 mV (A, B), or -40 mV (C), in 10 mV increments up to the voltage indicated. (D) Inward H+ currents can be seen with large inward pH gradients. Currents are shown during pulses to 30, 50, 60, and 70 mV as indicated, in an inside-out patch with pHo 7 (pipette) and pHi 9 (bath), according to the standard convention in which downward deflections indicate inward current flow. From the tail currents upon repolarization to the holding potential of -40 mV, it is clear that the gH was already activated detectably by the pulse to 50 mV, with small inward current evident during the pulse to 60 mV, and larger inward current at 70 mV.
Fig 2
Fig 2. LpHV1 is a proton selective channel.
The reversal potential (Vrev) was measured, usually by tail currents (as shown in the examples in the insets), in both whole-cell (n = 10) and excised, inside-out patch configurations (n = 10) over a wide range of pH (pHo 4.5–9.0; pHi 4.5–10.0). Measurements at multiple pH in individual cells or patches are connected by lines. The heavy dashed green line indicates Vrev = EH, which would indicate perfect proton selectivity. Whole-cell data are plotted as triangles, diamonds, or hexagons, and pink Xs, connected by solid lines; other symbols are from inside-out patches, connected by dashed lines. Insets show tail current measurements from the same inside-out patch, with pHo 7 in the pipette, and pHi 8 or 7, as indicated, in the bath. Vrev shifts from -2 mV at pHi 7 to 53 mV at pHi 8, a change of 55 mV, near the Nernst expectation of 58 mV for perfect H+ selectivity.
Fig 3
Fig 3. LpHV1 exhibits classical ΔpH dependent gating.
The gH-V relationships calculated from LpHV1 currents in whole cell measurements (A) or inside-out patches (B) are strongly affected by pHo or pHi, respectively. The proton conductance, gH, was usually calculated from the measured reversal potential, Vrev, and the amplitude of a single rising exponential fitted to the current. In some cases, for example with test pulses near Vrev, the amplitude of the tail current was used, after appropriate scaling.
Fig 4
Fig 4. LpHV1 exhibits ΔpH dependent gating.
The position of the gH-V relationship was established from gH-V relationship plots by measuring the voltage at which gH was 10% of gH,max. Measurements in individual cells or patches at several pH are connected by lines. Color coding indicates pHi for whole cell measurements (A) or pHo for inside-out patch measurements (B). As a reference, the arbitrarily positioned dashed line in each panel shows the slope that corresponds to a shift of 40 mV/unit change in either pHo or pHi. Except at high pHo or pHi, the data are roughly parallel to the reference lines, indicating a slope of 40 mV/unit pH. The slope decreases at pH>8, indicating saturation of ΔpH dependence.
Fig 5
Fig 5. Voltage and pH dependence of LpHV1 activation kinetics.
A. Voltage and pHo dependence of LpHV1 activation kinetics. Currents were fitted by single rising exponentials to obtain the time constant of channel opening (activation, τact). These measurements were made in the same cell with pHi 7.0, studied at three different pHo. B. Voltage and pHi dependence of LpHV1 activation kinetics. These measurements were made in the same inside-out patch of membrane with pHo 7.0, studied at six different pHi.
Fig 6
Fig 6. LpHV1 distribution is consistent with scintillon localization.
Fixed whole L. polyedrum were probed with antibodies to LBP, LCF, and LpHV1, stained with fluorescently labeled secondary antibodies to appropriate IgG, and visualized via confocal microscopy. Maximum projection of a representative Z-stack for each primary antibody is shown. Scale bars in all panels = 10 μM. Images were analyzed for per area fluorescence from each secondary antibody using Zen software tools. Bars represent means +/- S.D. of fluorescence from 20–30 individual cells from 2–5 separate preparations; significant differences from no-antibody or pre-serum controls are indicated with asterisks. Images of negative controls are presented in S1 Fig.
Fig 7
Fig 7. LpHV1 localizes to the scintillon.
(A) Total protein from isolated L. polyedrum scintillons were Western blotted and probed with anti-LpHV1. (B) Total protein from isolated L. polyedrum scintillons, and also purified recombinant LCF, LpHV1, and GST-labeled LBP, were Western blotted and probed with the antibody indicated. (C) Isolated scintillons were fixed and immunostained as in Fig 6. Scale bars in all panels = 2 μm. Scintillons in different treatments were identified by their native luciferin fluorescence; the percentage of scintillons in each treatment that exhibited secondary antibody fluorescence is shown. Number of scintillons scored for each treatment: LBP-LCF, n = 55; LpHV1-LCF n = 55; LCF preserum, n = 41; LpHV1 pre-serum, n = 15; no primary antibody, n = 35. Images of negative controls are presented in S2 Fig.
Fig 8
Fig 8. Isolated scintillon preparations contain peptides matching the LpHV1 sequence.
The sequence and predicted secondary structure acid of LpHV1 is shown (Johns S.J., TOPO2, Transmembrane protein display software, http://www.sacs.ucsf.edu/TOPO2/). Acidic residues in the transmembrane helices are shown in red, basic residues in dark blue, and aromatic residues in gray. Brown diamonds indicate the overlap of peptide sequences found by mass spectrometry analysis of isolated scintillons and the epitope to which the antibody against LpHV1 was raised; otherwise peptide sequences are shown in orange squares and the epitope is shown in green stars.
Fig 9
Fig 9. Zn2+ inhibits LpHV1 proton currents and scintillon luminescence.
(A) Proton currents at +60 mV at pHo 7.0 were reduced by Zn2+. The mean reduction of current by 100 μM Zn2+ was 63 ± 11% (mean ± SEM, n = 4). (B) Luminescence of L. polyedrum scintillons stimulated by 50 mM acetate and measured in a plate reader was inhibited by Zn2+. (C) Zn2+ sensitivity of luminescence of L. polyedrum scintillons stimulated by 50 mM acetate and measured with a photometer generously provided by J. W. Hastings.

Similar articles

Cited by

References

    1. Fogel M, Hastings JW. Bioluminescence: mechanism and mode of control of scintillon activity. Proc Natl Acad Sci U S A. 1972;69: 690–3. Available: http://www.pubmedcentral.nih.gov/articlerender.fcgi?artid=426536&tool=pm... - PMC - PubMed
    1. Thomas RC, Meech RW. Hydrogen ion currents and intracellular pH in depolarized voltage-clamped snail neurones. Nature. 1982;299: 826–828. - PubMed
    1. Barish ME, Baud C. A voltage-gated hydrogen ion current in the oocyte membrane of the axolotl, Ambystoma. J Physiol. 1984;352: 243–263. Available: http://www.ncbi.nlm.nih.gov/entrez/query.fcgi?cmd=Retrieve&db=PubMed&dop... - PMC - PubMed
    1. DeCoursey TE. Hydrogen ion currents in rat alveolar epithelial cells. Biophys J. Elsevier; 1991;60: 1243–1253. 10.1016/S0006-3495(91)82158-0 - DOI - PMC - PubMed
    1. Kapus A, Romanek R, Qu AY, Rotstein OD, Grinstein S. A pH-sensitive and voltage-dependent proton conductance in the plasma membrane of macrophages. J Gen Physiol. 1993;102: 729–760. - PMC - PubMed

LinkOut - more resources