. 2017 Feb 7;18(6):1366-1382.
doi: 10.1016/j.celrep.2017.01.034.

Chromatin States in Mouse Sperm Correlate with Embryonic and Adult Regulatory Landscapes

Affiliations

Chromatin States in Mouse Sperm Correlate with Embryonic and Adult Regulatory Landscapes

Yoon Hee Jung et al. Cell Rep. .

Abstract

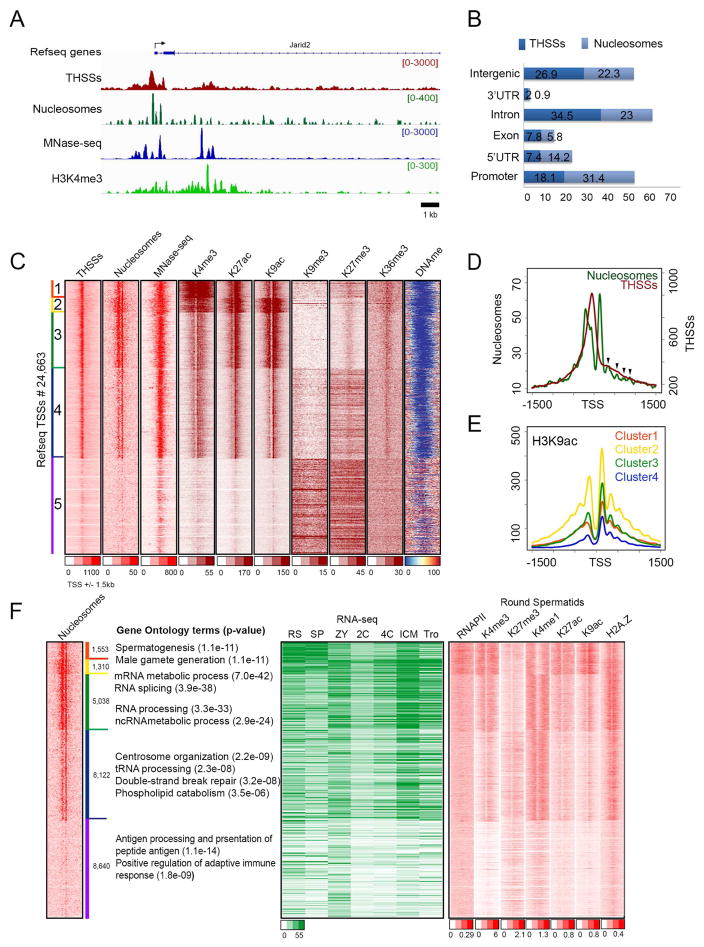
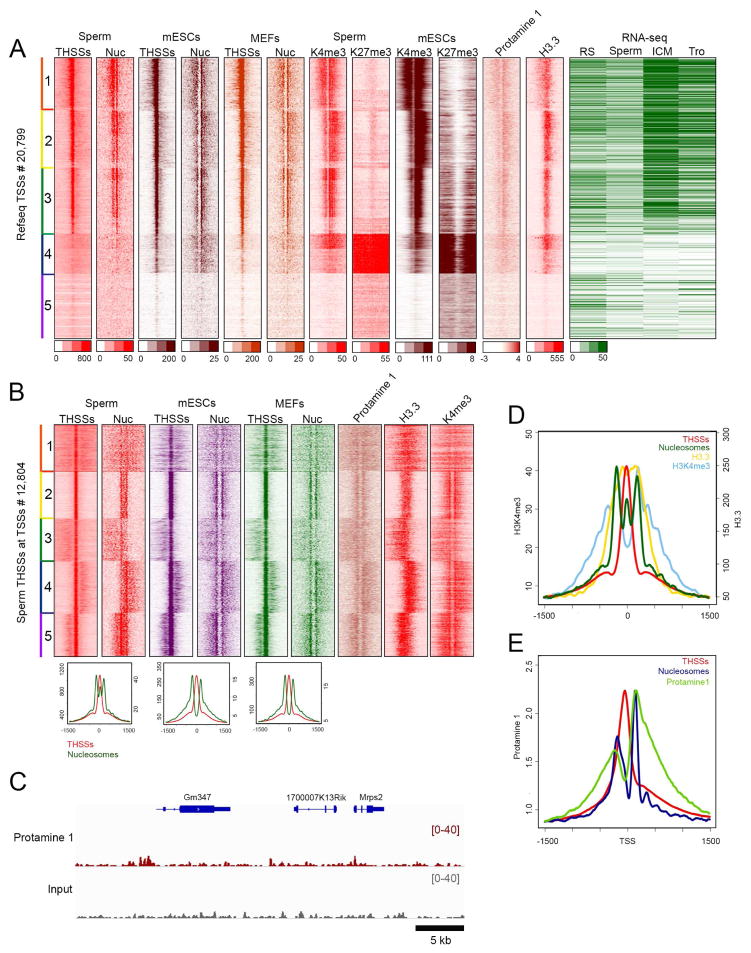
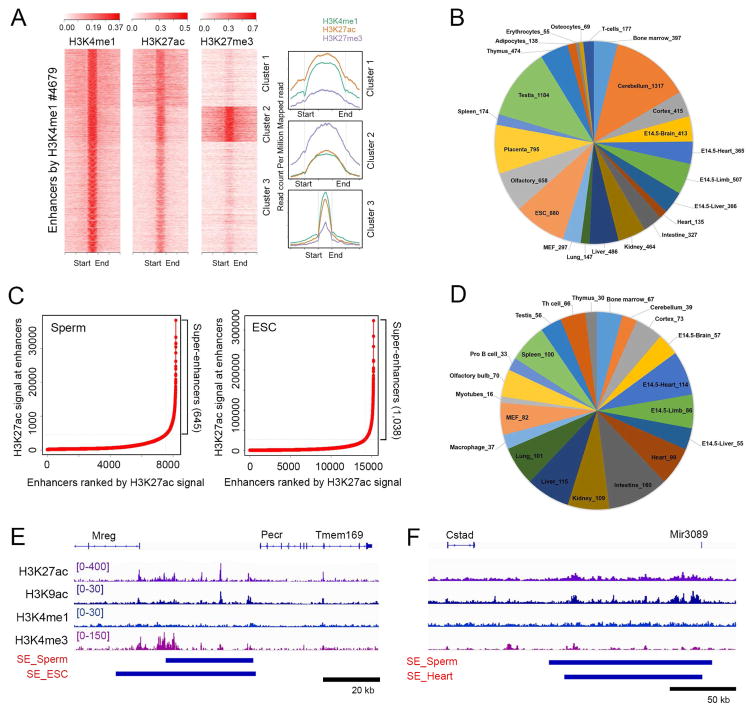
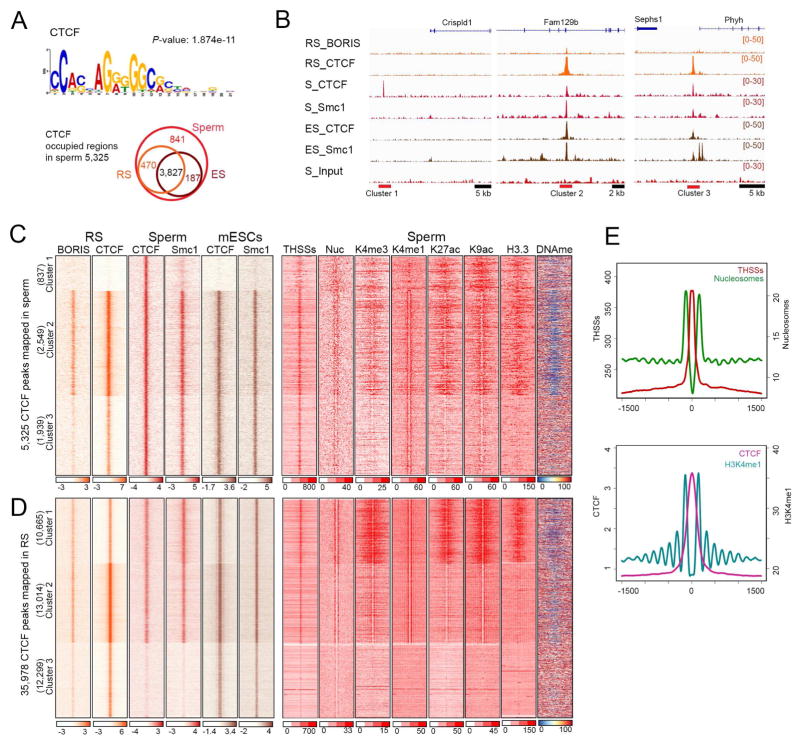
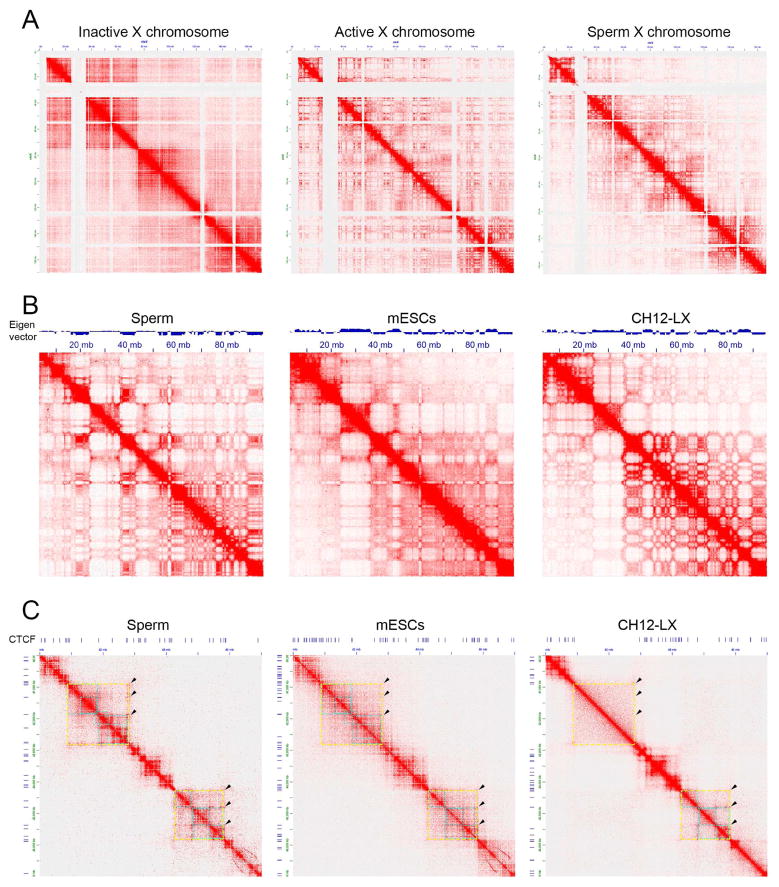
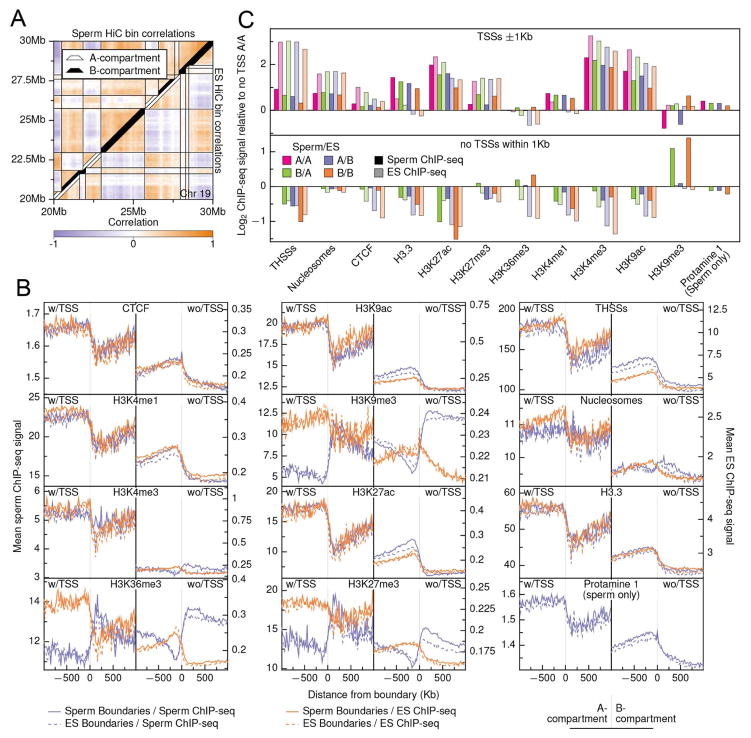
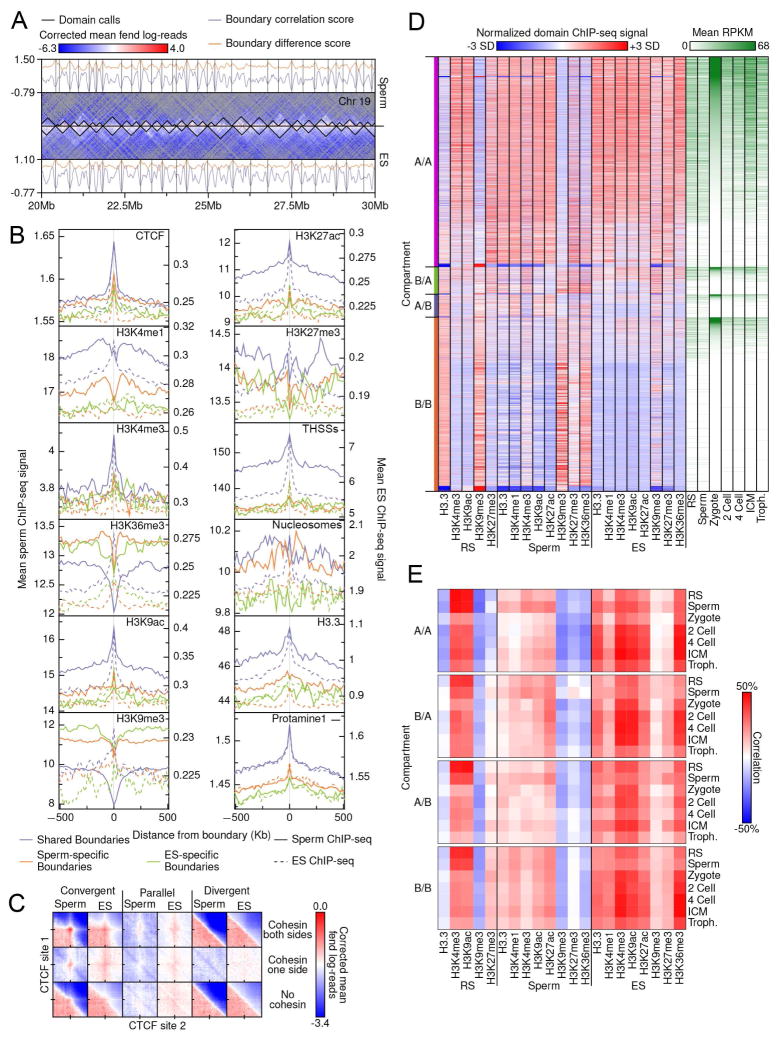
The mammalian sperm genome is thought to lack substantial information for the regulation of future expression after fertilization. Here, we show that most promoters in mouse sperm are flanked by well-positioned nucleosomes marked by active histone modifications. Analysis of these modifications suggests that many enhancers and super-enhancers functional in embryonic and adult tissues are already specified in sperm. The sperm genome is bound by CTCF and cohesin at sites that are also present in round spermatids and embryonic stem cells (ESCs). These sites mediate interactions that organize the sperm genome into domains and compartments that overlap extensively with those found in mESCs. These results suggest that sperm carry a rich source of regulatory information, encoded in part by its three-dimensional folding specified by CTCF and cohesin. This information may contribute to future expression during embryonic and adult life, suggesting mechanisms by which environmental effects on the paternal germline are transmitted transgenerationally.

Keywords: CTCF; TAD; chromatin; pluripotency; stem cell; transcription.


Figures

Figure 1
Figure 1. Epigenetic profiles of sperm chromatin at transcription start sites (TSS)
(A) Track view of THSS and nucleosome reads obtained using ATAC-seq, as well as ChIP-seq signal for H3K4me3 and RNAPII-Ser2ph around the Jarid2 TSS. MNase-seq data (Brykczynska, et al., 2010) is shown for comparison. (B) Genome-wide distribution of THSSs and nucleosomes identified from sperm ATAC-seq. TSS ± 2 kb are listed as promoters. (C) Heatmaps showing chromatin features around TSSs (± 1.5 kb). Sites are ordered by nucleosome and THSS signal from ATAC-seq. (D) Average THSS (red) and nucleosome (green) ATAC-seq enrichment profiles relative to TSSs. Arrow heads indicate the position of nucleosomes downstream of the TSS. (E) Average profiles of H3K9ac ChIP-seq for each cluster shown in panel C. (F) Comparison of sperm nucleosome-occupied TSSs with gene ontology terms obtained using the GREAT tool, gene expression (RPKM from RNA-seq), and round spermatid chromatin state. RS=round spermatid; SP=sperm; ZY=zygote; 2C= 2 cell embryo; 4C= 4 cell embryo; ICM= inner cell mass; Tro= trophectoderm. See also Figures S1, S2 and S3
Figure 2
Figure 2. Comparison of THSSs and nucleosome positioning around TSSs among sperm, mESCs, and MEFs
(A) Heatmaps representing THSSs and nucleosomes occupancy between cell types after re-clustering TSSs present in cluster 3–5 of figure 1C by H3K4me3 and H3K27me3 of sperm and mESCs. Occupancy of protamine 1, H3.3, and RPKM value in round spermatids, sperm, ICM cells, and trophoblasts is also shown. Each panel represents 1.5 kb upstream and downstream of the TSS. (B) Heatmaps indicating THSSs and nuclesomes from ATAC-seq in sperm, mESCs, and MEFs at summit of sperm THSSs located at TSSs (± 1.5 kb). (C) Track view of protamine 1 and input enrichment in a typical region of the genome. (D) Average profile of THSSs, nucleosomes, H3.3, and H3K4me3 around THSSs in cluster 2 of panel B. (E) Average profile of THSSs, nucleosomes, and protamine 1 around TSSs in panel A. See also Figure S2
Figure 3
Figure 3. Putative enhancers and super-enhancers identified in sperm
(A) Sperm enhancers defined by the presence of H3K4me1 and H3K27ac. A subset in cluster 2 also contains H3K27me3. (B) Overlap of enhancers between sperm and other tissues. (C) Identification of super-enhancers by H3K27ac signal in sperm (left) and mESCs (right). (D) Overlap of super-enhancers between sperm and other tissues. (E) Track view of ChIP-seq binding profiles at a super enhancer present in sperm and mESCs. (F) Track view of ChIP-seq binding profiles at a super enhancer present in sperm and heart. See also Figure S2
Figure 4
Figure 4. Genomic profiling of CTCF occupancy in sperm
(A) CTCF consensus motif found in CTCF occupied site in sperm (left). Venn diagram showing the number of sperm CTCF occupied sites in round spermatids (RS) and mESCs. (B) Representative examples of CTCF and Smc1 occupancy in round spermatids (RS), sperm (S), and mESCs (ES) in each cluster shown in panel C. (C) Heatmaps showing a comparison of CTCF, BORIS and cohesin (Smc1) occupancy in round spermatids (RS), sperm, and mESCs at all CTCF occupied sites of sperm (± 1.5 kb) (D) Heatmaps showing a comparison of CTCF, BORIS, and cohesin (Smc1) occupancy in round spermatids (RS), sperm, and mESCs at all CTCF occupied sites of RS (± 1.5 kb) (E) Average profiles of THSSs and nuclesomes from ATAC-seq (left), and H3K4me1 (right) around CTCF binding sites from panel D. See also Figures S2, S4, and S6
Figure 5
Figure 5. Comparison of 3D organization between sperm, mESCs and B-cell lymphoma cells
(A) Organization of the X chromosome in sperm. Contact HiC maps are shown for the inactive, active, and sperm X chromosomes. (B)Compartment organization in sperm. Eigen vector and visualization of HiC maps suggest that while some compartment interactions are maintained among all three cell lines, sperm compartments are more closely conserved in mESCs. Figures correspond to mouse chromosome 17. (C) TAD organization in sperm. Figure shows a region of mouse chromosome 1 containing several TADs. Two of them are demarcated by yellow squares with sub-domains indicated by blue squares. Domains in the top left quadrant are established by interactions between CTCF sites and are conserved between sperm and mESCs but not in CH12-LX cells. Domains present in the bottom right quadrant are conserved in all three cell types. See also Figure S6
Figure 6
Figure 6. Comparison of genes, histone modifications and proteins across sperm and mESC chromatin compartments
(A) Chromatin compartment calls for sperm and ES cells overlaid on a heatmap of 10 kb bin pairwise correlations. (B) Average ChIP-seq signal centered on compartment boundaries +/− 1 Mb. Signals were binned in 20 kb bins and were truncated to at the 95th percentile of signal prior to finding means to remove outliers. All signals were oriented to go from an A-compartment (left) to a B-compartment (right) prior to finding the mean signal. Left-side plots show mean signal for bins containing at least one TSS while right-side plots show mean signal for all non-TSS containing bins. (C) Log-enrichments of mean ChIP-seq signals for each compartment class compared to the A/A TSS-free signal for each factor. Mean signals were found across all bases within a class that fell within one kb of a TSS within that class (top) and for all other bases in each class (bottom). See also Figures S5
Figure 7
Figure 7. Domain boundary comparison and associations in sperm and ES cells
(A) Domain calls and boundary metric scores for sperm and ES HiC data. Domain calls (black, center) are overlaid on fend-corrected HiC enrichment data, binned at 100 kb resolution. Bins with no observations are in gray. (B) Average ChIP-seq signal centered on domain boundaries +/− 500 kb. A union set of sperm and ES boundaries was used, collapsing boundaries occurring within 40 kb or each other together. Boundaries that did not overlap and were not collapsed across cell-types were considered cell-type specific. Signals were binned in 10 kb bins and were truncated at the 95th percentile of signal prior to finding means to remove outliers. (C) Enrichment of HiC signal at intersecting CTCF sites less than 500 kb apart. Interactions were partitioned based on CTCF motif orientation and the presence of a Smc1 peak within 500 bases of CTCF peak calls. CTCF sites less than 4 kb apart were excluded to avoid false signals. HiC signal was binned at 2 kb intervals and signal +/− 100 kb from site intersections were found. (D) The joint domain boundary set for ES and sperm cells was used to partition the genome and find ChIP-seq and RNA-seq mean signals for each interval. Intervals were sorted first by compartment class and then by mean ES expression level. (E) Correlations between mean ChIP-seq domain signals and mean RNA-seq expression levels for each pairwise combination.

References

    1. Balhorn R, Gledhill BL, Wyrobek AJ. Mouse sperm chromatin proteins: quantitative isolation and partial characterization. Biochemistry. 1977;16:4074–80. - PubMed
    1. Bannister AJ, Schneider R, Myers FA, Thorne AW, Crane-Robinson C, Kouzarides T. Spatial distribution of di- and tri-methyl lysine 36 of histone H3 at active genes. The Journal of biological chemistry. 2005;280:17732–6. - PubMed
    1. Battulin N, Fishman VS, Mazur AM, Pomaznoy M, Khabarova AA, Afonnikov DA, Prokhortchouk EB, Serov OL. Comparison of the three-dimensional organization of sperm and fibroblast genomes using the Hi-C approach. Genome biology. 2015;16:77. - PMC - PubMed
    1. Boskovic A, Bender A, Gall L, Ziegler-Birling C, Beaujean N, Torres-Padilla ME. Analysis of active chromatin modifications in early mammalian embryos reveals uncoupling of H2A.Z acetylation and H3K36 trimethylation from embryonic genome activation. Epigenetics. 2012;7:747–57. - PubMed
    1. Brykczynska U, Hisano M, Erkek S, Ramos L, Oakeley EJ, Roloff TC, Beisel C, Schubeler D, Stadler MB, Peters AH. Repressive and active histone methylation mark distinct promoters in human and mouse spermatozoa. Nature structural & molecular biology. 2010;17:679–87. - PubMed

Publication types