. 2017 Feb 7;18(6):1444-1457.
doi: 10.1016/j.celrep.2017.01.023.

MNK Controls mTORC1:Substrate Association through Regulation of TELO2 Binding with mTORC1

Affiliations

MNK Controls mTORC1:Substrate Association through Regulation of TELO2 Binding with mTORC1

Michael C Brown et al. Cell Rep. .

Abstract

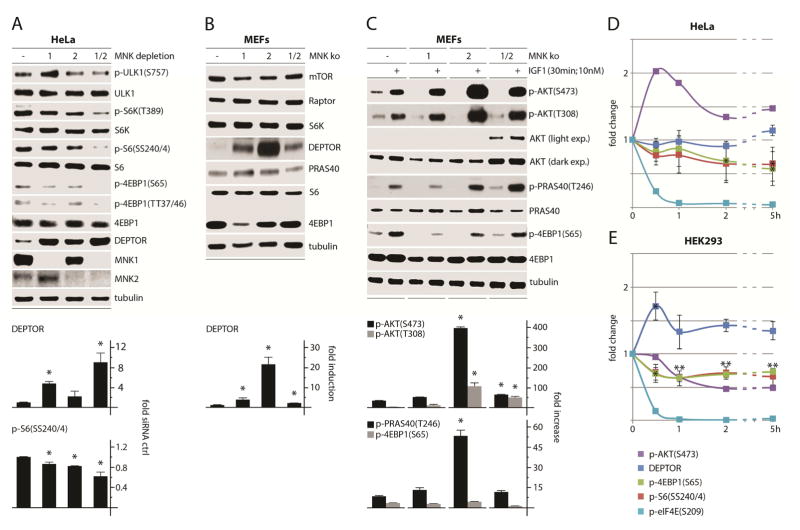
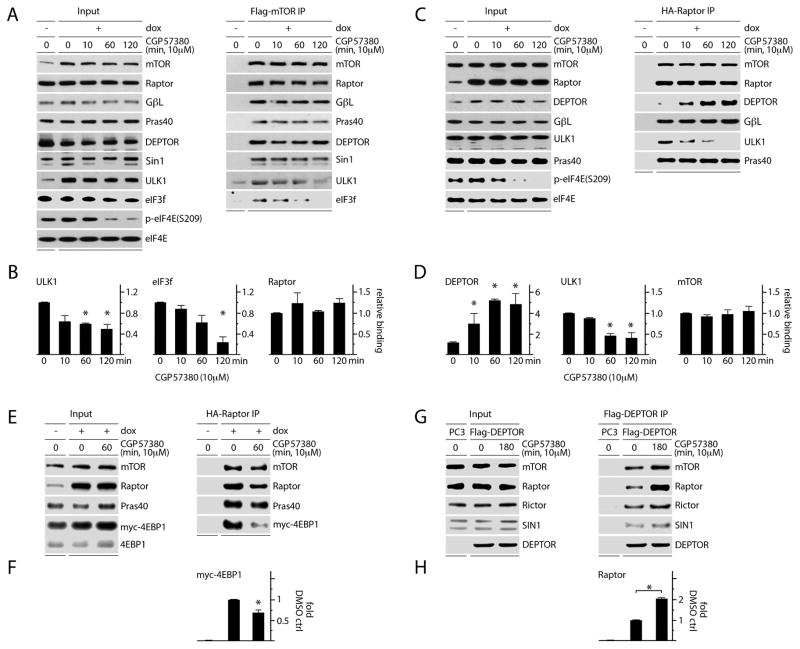
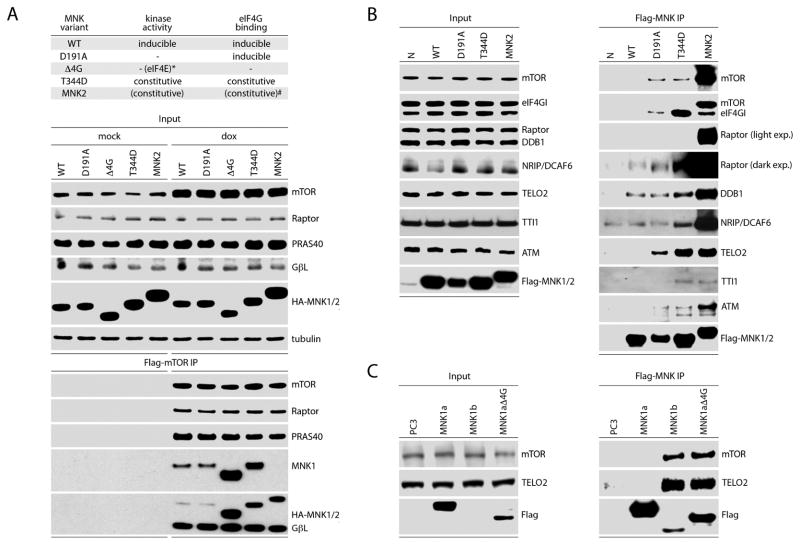
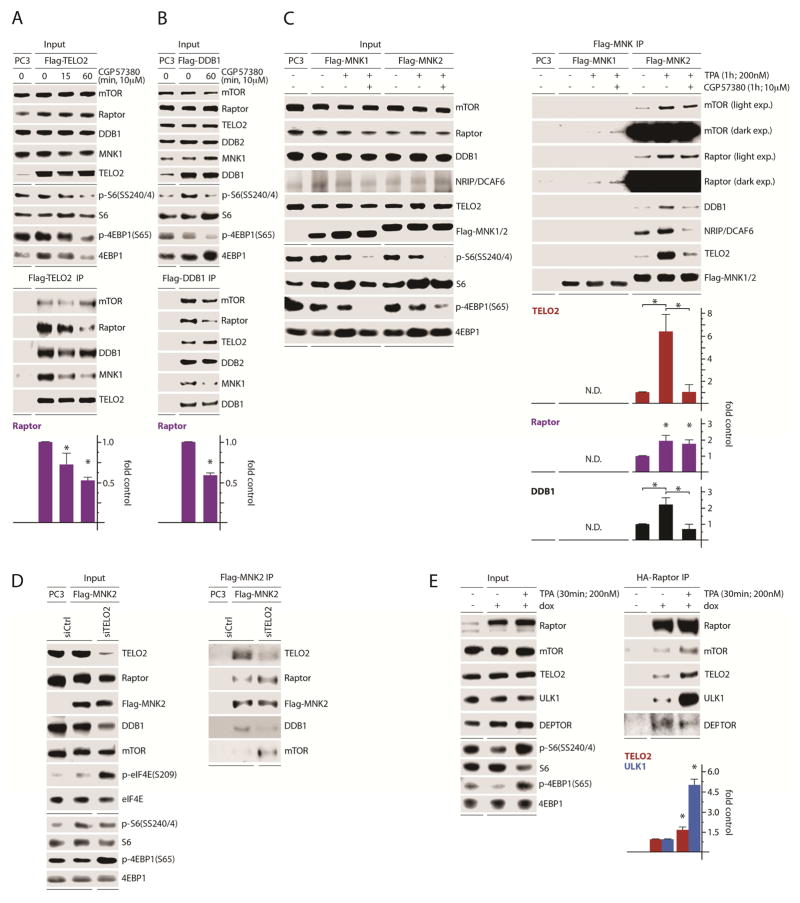
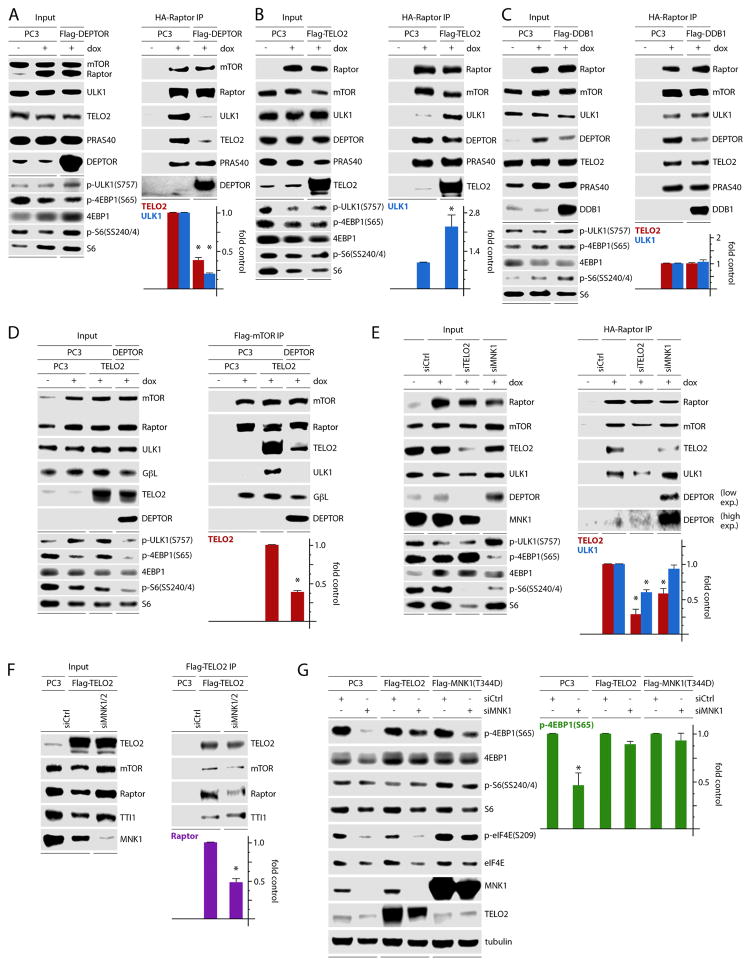
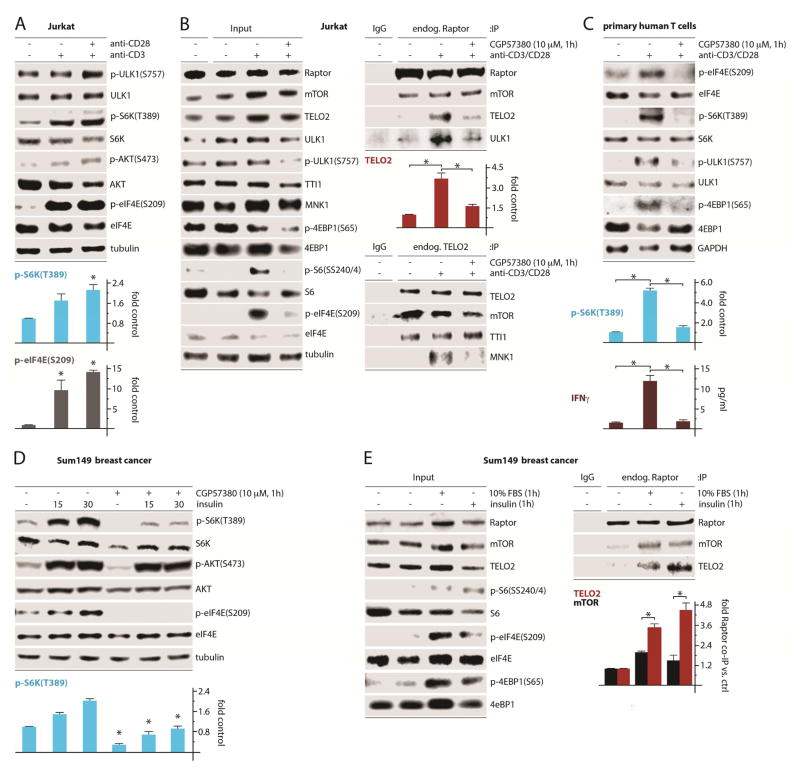
The mechanistic target of rapamycin (mTOR) integrates numerous stimuli and coordinates the adaptive response of many cellular processes. To accomplish this, mTOR associates with distinct co-factors that determine its signaling output. While many of these co-factors are known, in many cases their function and regulation remain opaque. The MAPK-interacting kinase (MNK) contributes to rapamycin resistance in cancer cells. Here, we demonstrate that MNK sustains mTORC1 activity following rapamycin treatment and contributes to mTORC1 signaling following T cell activation and growth stimuli in cancer cells. We determine that MNK engages with mTORC1, promotes mTORC1 association with the phosphatidyl inositol 3' kinase-related kinase (PIKK) stabilizer, TELO2, and facilitates mTORC1:substrate binding. Moreover, our data suggest that DEPTOR, the endogenous inhibitor of mTOR, opposes mTORC1:substrate association by preventing TELO2:mTORC1 binding. Thus, MNK orchestrates counterbalancing forces that regulate mTORC1 enzymatic activity.

Keywords: DDB1; DEPTOR; MNK; PIKK; S6 kinase; T cell; TELO2; mTOR; rapamycin; raptor.


Figures

Figure 1
Figure 1. Rapamycin and CGP57380 synergy in inhibiting mTORC1 in MEFs, cancer cells and T cells
(A) Wt and MNK1/2 dko MEFs or (B) malignant glioma (U87, Du54), breast cancer (MDA-MB231, Sum149) or melanoma (DM440, DM6) cells were treated with DMSO, rapamycin and CGP57380, harvested and analyzed by immunoblot as shown. Quantitations represent the average of two independent series normalized to the rapamycin-only control. (C, D) Primary mouse splenocytes were stimulated with TPA (100nM) and treated with rapamycin, torin2 and CGP57380 as shown. Cell pellets were lysed for immunoblot analyses (C) and supernatants were collected to test IL-2 and IFN-γ concentrations (ELISA; D). Quantitation of immunoblot and ELISA signals represent the average of two experiments. The quantitative values were normalized between experiments using non-stimulated, mock (DMSO)-treated controls at each time point.
Figure 2
Figure 2. MNK regulates mTORC1 signaling and DEPTOR abundance
(A) HeLa cells were treated with ctrl (−), MNK1, MNK2, or MNK1/2 siRNAs (72h), harvested and analyzed by immunoblot. Quantitation represents the average of three independent series normalized by setting ctrl siRNA values to 1. (B) Wt, MNK1, MNK2, and MNK1/2 dko MEFs were seeded into 35mm3 dishes (5 × 10⁵ cells per dish) and harvested the next day for analysis of mTORC1-relevant proteins by immunoblot; quantitation represents the average of four independent experiments. (C) MEFs plated as in (B) were treated with mock or IGF1 as shown, harvested, and analyzed for mTORC1 and AKT activity by immunoblot. Quantitation represents the average of two experiments normalized by setting each untreated control to 1. HeLa (D) or HEK 293 (E) cells were treated with CGP57380 (10μM) and analyzed at the designated intervals by immunoblot. Quantitations of p-S6(SS240/4), p-4EBP1(S65) and DEPTOR represents the average of three experiments (immunoblots for a representative assay are shown in Figure S1).
Figure 3
Figure 3. MNK inhibition reduces mTORC1 association with its substrates and increases DEPTOR association with mTORC1
(A, B) Dox-inducible Flag-mTOR expressing HEK293 cells were treated with mock (DMSO) or CGP57380 as shown. Lysates were subjected to Flag-IP and immunoblot; Raptor, ULK1, and eIF3f binding levels are quantitated in (B). (C) Dox-inducible HA-Raptor expressing HEK293 cells were treated as in (A) and lysates were subjected to HA-IP and immunoblot. Quantitation of DEPTOR, ULK1 and mTOR binding is shown in (D). (E) Dox-inducible HA-Raptor expressing HEK293 cells were transfected with myc-4EBP1, treated with DMSO or CGP5780, harvested, and the lysates used for HA-IP and immunoblot to detect co-IP of myc-4EBP1 with Raptor. HA-Raptor:myc-4EBP1 co-IP was quantitated (F). (G) HEK293 cells were transfected with Flag-DEPTOR, treated with DMSO or CGP57380, and subjected to Flag-IP and immunoblot to detect changes in mTORC1 vs. C2 interactions; Flag-DEPTOR:Raptor co-IP was quantitated (H). (B, D, F, H) Quantitation of immunoblot signals represent the average of 3 (B, D, F) or 2 (H) independent experiments. The values were normalized to the mock (DMSO), dox-induced control.
Figure 4
Figure 4. MNK1/2 associates with mTORC1 and mTOR-regulatory cofactors TELO2:DDB1
(A) Top panel: kinase activity and eIF4G-binding characteristics of MNK variants used. *MNK1(Δ4G) kinetic activity [phosphorylation of eIF4E(S209)] is abolished due to lack of eIF4G binding; #MNK2 lacks some auto-inhibitory features of MNK1 and, thus, exhibits high basal eIF4G-binding/eIF4E(S209) phosphorylation relative to MNK1 (Jauch et al., 2006; Shveygert et al., 2010). Bottom panel: dox-inducible Flag-mTOR expressing HEK293 cells were transfected with HA-tagged wt MNK1, MNK1(D191A), MNK1(Δ4G), MNK1(T344D), or wt MNK2 without (mock) or with dox induction. Lysates were subjected to Flag-IP and immunoblot. (B) HEK293 cells were transfected with empty vector, Flag-tagged wt MNK1, MNK1(D191A), MNK1(T344D), or wt MNK2. Lysates were subjected to Flag-IP and immunoblot to detect associations with Raptor, mTOR and other mTORC1 co-factors. (C) HEK293 cells were transfected with wt Flag-tagged MNK1-a, MNK1-a(Δ4G), or wt MNK1-b. Flag-IP was performed from lysates followed by immunoblot analysis to determine mTOR and TELO2 interactions. (A–C) Experiments were performed in 3 separate series; the results of representative assays are shown. See also Figures S2 and S3.
Figure 5
Figure 5. MNK regulates the association of TELO2:DDB1 with a complex containing MNK, mTOR, and Raptor
(A, B) Flag-TELO2 (A) or Flag-DDB1 (B) were transfected in HEK293 cells pretreated with DMSO or CGP57380 as shown. Lysates were subjected to Flag-IP and immunoblot. (C) HEK293 cells were transfected with empty vector (PC3), Flag-MNK1, or Flag-MNK2 and treated with DMSO, TPA, or TPA + CGP57380 as shown. Flag-IP of lysates and immunoblot analysis was performed to determine changes in MNK associations defined in Figure 4. (D) HEK293 cells were transfected with ctrl or TELO2-targeting siRNA followed by transfection with empty vector (PC3) or Flag-MNK2. MNK2 IP and immunoblot analysis were performed as in (C). The assay was performed 3 times; a representative series is shown. (E) Dox-inducible HA-Raptor expressing HEK293 cells were treated with mock (DMSO) or TPA, lysates were prepared and subjected to HA-IP, and immunoprecipitated proteins were analyzed by immunoblot as shown. (A–E) Quantitations are averages from 3 (A, C, E) or 2 (B) independent assays, normalizing control values to 1.
Figure 6
Figure 6. TELO2 controls mTORC1:substrate association and explains MNK regulation of mTORC1
(A–C) Dox-inducible, HA-Raptor expressing HEK293 cells were transfected with empty vector (PC3), Flag-DEPTOR (A), Flag-TELO2 (B), or Flag-DDB1 (C), lysed, and subjected to Flag-IP followed by immunoblot analysis. (D) Flag-mTOR IP of HEK293 cells transfected with empty vector (PC3), untagged TELO2, or untagged TELO2 and DEPTOR combined. Co-IP of relevant proteins was assessed by immunoblot. (E) Dox inducible, HA-Raptor expressing HEK293 cells were transfected with ctrl (-), TELO2, or MNK1-targeting siRNA. HA-Raptor IP was performed and associated proteins were analyzed by immunoblot. (F) HEK293 cells were transfected with ctrl (-) or MNK1 and 2-targeting siRNA, transfected with empty vector or flag-TELO2. Cell lysates were assessed by Flag-TELO2 IP and immunoblot. (G) HeLa cells were transfected with ctrl (-) or MNK1-targeting siRNA followed by transfection with empty vector (PC3), Flag-TELO2, or Flag-MNK1 (T344D). Lysates were analyzed by immunoblot for markers of mTORC1/MNK activation. Quantitation represents the average of two (A, C, D) or three (B, E, F, G) independent experiments normalized by setting empty vector (PC3) control to 1 (A–C), setting TELO2 + PC3 control to 1 (D), or by setting ctrl siRNA samples to 1 (E–G).
Figure 7
Figure 7. MNK regulation of TELO2:mTORC1 binding facilitates T cell activation and growth factor signaling
(A) Jurkat T cell leukemia cells were untreated or treated with anti-CD3 and anti-CD28 antibodies as shown, harvested to produce lysates, and tested for MNK and mTORC1 activation. (B) Jurkat T cells were untreated or treated as in (A) in the presence of DMSO (-) or CGP57380. Lysates were subjected to IP of endogenous proteins using control IgG, anti-Raptor IgG, or anti-TELO2 IgG followed by immunoblot analysis. The quantitation shown is for TELO2:(endogenous) Raptor co-IP (top panel). (C) Primary human T cells were treated as in (B), harvested, and analyzed for MNK and mTORC1 activation and IFNγ release (ELISA). (D) Sum149 cells were treated with insulin and or CGP57380 as shown. Cells were harvested, lysed, and analyzed by immunoblot. Statistics compare CGP57380 vs. DMSO control at each time point (ANOVA protected, Tukey’s HSD). (E) Sum149 cells were serum-starved (12h) followed by stimulation with fetal bovine serum or insulin as shown; cell lysates were subjected to endogenous Raptor IP followed by immunoblot as in (B). (A–E) Quantitations represent the average of 3 independent experiments, normalizing control values to 1.

Similar articles

Cited by

References

    1. Adesso L, Calabretta S, Barbagallo F, Capurso G, Pilozzi E, Geremia R, Delle Fave G, Sette C. Gemcitabine triggers a pro-survival response in pancreatic cancer cells through activation of the MNK2/eIF4E pathway. Oncogene. 2013;32:2848–2857. - PubMed
    1. Brown MC, Bryant JD, Dobrikova EY, Shveygert M, Bradrick SS, Chandramohan V, Bigner DD, Gromeier M. Induction of viral, 7-methyl-guanosine cap-independent translation and oncolysis by mitogen-activated protein kinase-interacting kinase-mediated effects on the serine/arginine-rich protein kinase. J Virol. 2014a;88:13135–13148. - PMC - PubMed
    1. Brown MC, Dobrikov MI, Gromeier M. Mitogen-activated protein kinase-interacting kinase regulates mTOR/AKT signaling and controls the serine/arginine-rich protein kinase-responsive type 1 internal ribosome entry site-mediated translation and viral oncolysis. J Virol. 2014b;88:13149–13160. - PMC - PubMed
    1. Carracedo A, Ma L, Teruya-Feldstein J, Rojo F, Salmena L, Alimonti A, Egia A, Sasaki AT, Thomas G, Kozma SC, et al. Inhibition of mTORC1 leads to MAPK pathway activation through a PI3K-dependent feedback loop in human cancer. J Clin Invest. 2008;118:3065–3074. - PMC - PubMed
    1. Chrestensen CA, Eschenroeder A, Ross WG, Ueda T, Watanabe-Fukunaga R, Fukunaga R, Sturgill TW. Loss of MNK function sensitizes fibroblasts to serum-withdrawal induced apoptosis. Genes to cells : devoted to molecular & cellular mechanisms. 2007;12:1133–1140. - PubMed

MeSH terms

Substances