. 2017 Feb 28;8(9):15744-15762.
doi: 10.18632/oncotarget.14999.

Stromal fibroblasts present in breast carcinomas promote tumor growth and angiogenesis through adrenomedullin secretion

Affiliations

Stromal fibroblasts present in breast carcinomas promote tumor growth and angiogenesis through adrenomedullin secretion

Zohra Benyahia et al. Oncotarget. .

Abstract

Tumor- or cancer-associated fibroblasts (TAFs or CAFs) are active players in tumorigenesis and exhibit distinct angiogenic and tumorigenic properties. Adrenomedullin (AM), a multifunctional peptide plays an important role in angiogenesis and tumor growth through its receptors calcitonin receptor-like receptor/receptor activity modifying protein-2 and -3 (CLR/RAMP2 and CLR/RAMP3). We show that AM and AM receptors mRNAs are highly expressed in CAFs prepared from invasive breast carcinoma when compared to normal fibroblasts. Immunostaining demonstrates the presence of immunoreactive AM and AM receptors in the CAFs (n = 9). The proliferation of CAFs is decreased by anti-AM antibody (αAM) and anti-AM receptors antibody (αAMR) treatment, suggesting that AM may function as a potent autocrine/paracrine growth factor. Systemic administration of αAMR reduced neovascularization of in vivo Matrigel plugs containing CAFs as demonstrated by reduced numbers of the vessel structures, suggesting that AM is one of the CAFs-derived factors responsible for endothelial cell-like and pericytes recruitment to built a neovascularization. We show that MCF-7 admixed with CAFs generated tumors of greater volume significantly different from the MCF-7 xenografts in nude mice due in part to the induced angiogenesis. αAMR and AM22-52 therapies significantly suppressed the growth of CAFs/MCF-7 tumors. Histological examination of tumors treated with AM22-52 and aAMR showed evidence of disruption of tumor vasculature with depletion of vascular endothelial cells, induced apoptosis and decrease of tumor cell proliferation. Our findings highlight the importance of CAFs-derived AM pathway in growth of breast carcinoma and in neovascularization by supplying and amplifying signals that are essential for pathologic angiogenesis.

Keywords: adrenomedullin; breast cancer; invasion; myofibroblasts; tumor growth.


Conflict of interest statement

CONFLICTS OF INTEREST

The authors have no potential conflicts of interest to disclose.

Figures
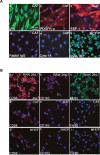
Figure 1
Figure 1. Fibroblastic properties of primary human fibroblasts prepared from human breast cancer tissues
A. Immunofluorescent staining of cultured CAFs (a, b, c, d, and e) and MCF-7 cells (f) using anti-vimentin (a), anti-PDGFRα (b), anti-FSP1 (c), anti-cytokeratin 18 (e and f) antibodies. Secondary antibody anti-rabbit was used as control (d). Scale bar, 50 μm. B. Immunocytochemical staining with CD68, CD163, and F4/80 antibodies. Fluorescent microscopy images indicating expressions of CD68, CD163, and F4/80 in macrophage/monocyte RAW264.7 cells (a, b, and c). In CAFs and NHDFs, barely detectable expression is seen for CD68 (d, g); meanwhile no expression can be detected for CD163 (e, h) and F4/80 (f, i).
Figure 2
Figure 2. CAFs exhibit characteristic of “Myofibroblasts”
A. NHDFs (a) and CAF1, 2 and 3 cells (b, c and d) were cultured in DMEM/F12 with 10% FBS and immunostained with anti-α-SMA antibody. Scale bar, 50 μm. B. α-SMA-positive cell counts as a fraction of total cell numbers (> 100 counted cells) were evaluated in ten independent fields from four different wells of each fibroblast type under a fluorescence microscope (P < 0.05).
Figure 3
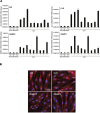
Figure 3. Expression of AM and its receptors in CAFs and NHDFs
A. expression of AM, CLR, RAMP2, and RAMP3 mRNAs in NHDFs and CAFs. Total RNA (1 μg, DNA-free) prepared from NHDFs (n = 3) and CAFs (n = 9) was transcribed into cDNA and subjected to real-time quantitative reverse transcriptase-polymerase chain reaction for the estimation of the relative ratios of AM, CLR, RAMP2, and RAMP3 mRNAs to glyceraldehyde-3-phosphate dehydrogenase (GAPDH) mRNA. Each bar depicts the mean ± standard error of the mean of the two independent experiments from two independent preparations of total RNA from NHDFs and CAFs. B. immunofluorecsence for AM, CLR, RAMP2, and RAMP3 in CAFs where strong cytoplasmic staining is observed.
Figure 4
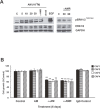
Figure 4. Effect of AM and AM signaling blockade on growth of CAFs in vitro
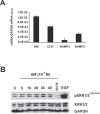
A. intracellular-signaling pathway induced by AM in CAFs. CAFs were treated with AM (10−7 M) for the indicated amounts of time in minutes and then immunoblotted for pERK1/2 and ERK1/2. MEK inhibitor (U0126) inhibited AM induced phosphorylation of ERK (10 μM, 30 min). EGF was used as a positive control to stimulate the phosphorylation of ERK1/2. AM-induced phosphorylation of ERK1/2 is inhibited upon pre-incubation of CAFs with αAMRs for 30 min. β-GAPDH was used as a loading control. B. AM system blockade inhibits CAFs growth in vitro. Cells were seeded at a density of 2 × 10³ cells per well in 24 multiwell plates in the presence of medium containing 2% FBS. Cells were treated for 6 days with AM (10−7 M), αAM (70 μg/ml), αAMRs (70 μg/ml), or control IgG (70 μg/ml). For each treatment, six wells were prepared for MTT assay. Each bar represents the mean ± standard error of the mean of three independent experiments. Significant differences between the growth of cells treated with αAM, αAMRs, and that of untreated controls were determined by a one-way analysis of variance test (**p < 0.01; ***p < 0.001).
Figure 5
Figure 5. αAMR inhibit the angiogenesis and lymphangiogenesis induced-CAFs in an in vivo Matrigel plug bioassay
A. C57BL/6 mice were injected s.c. at the abdominal midline with 0.4 ml of growth factor-depleted Matrigel admixed to NHDFs (1.5 × 10⁶ cells) (a, b, and c) or to CAFs (1.5 × 10⁶ cells) (d, e, and f). αAMRs (g, h, and i) or control IgG (j, k, and l) was administered i.p. to C57BL/6 mice with Matrigel admixed to CAFs every three days, starting 24h after Matrigel injection, for 15 days. Matrigel plugs were isolated and fixed with formalin, embedded, and sectioned for immunohistochemical. Microphotographs of histochemical-stained Matrigel sections for H&E are shown (a, d, and g). Staining of blood vessels with anti-CD31 antibody (b, e, and h) and lymphatic vessels with anti-LYVE-1 antibody (c, f, and i) of the Matrigel plugs admixed with NHDFs or CAFs is shown. Panels are representative of multiple fields from five or six plugs per group. Scale bar, 50 μm. B & C. quantitative assessment of the density of cells that stained positive for CD31 (B), or LYVE-1 (C) was conducted for the entire surface of the corresponding slides using CALOPIX Software. MBF_Image J 1.43U software was used for the analysis. The values shown represent the means ± standard error of the mean (***p < 0.001). D. after 15 days of treatment of three independent groups, mice were injected i.v. with FITC-dextran (150, 000); Matrigel plugs were removed, and the volume of new blood vessels was assessed by measurement of intravascular FITC-dextran content (normalized to FITC-dextran in the circulating plasma). Values are averages ± SE of six animals (***p < 0. 001).
Figure 6
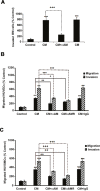
Figure 6. Effect of AM signaling blockade on CAF3-CM induced migration and invasion of cells in vitro
A, B & C. CAF3-CM regulates migration and invasion of HUVECs and HUVSMCs and invasion of BMDCs in vitro. The bottom wells of all chambers were filled with CAF3-CM and the control well was filled with DMEM containing 2% FBS (control). To neutralize the ir-AM secreted in the CAF3-CM, it was pretreated for 30 minutes with αAM (70 μg/ml). Bone Marrow cells (A, 5 × 10⁵ cells), HUVECs (B, 3 × 10⁴ cells), or HUVSMCs (C, 3 × 10⁴ cells) pretreated for 30 min with 23 μg/ml each of αCLR, αRAMP2 and αRAMP3 (αAMRs), or control IgG (70 μg/ml) were placed in the upper chamber and incubated as described in the Materials and Methods. The cells that migrated were stained with DAPI and counted at 50x magnification using a microscope. Data are expressed as the number of migrated cells in 10 high-power fields, and the values represent the mean ± SEM of three independent experiments, each performed in triplicate. The asterisk (*) is used for comparison to control cells (**p < 0. 01; ***p < 0. 001) and the plus symbol (+) is used in comparison to CM-treated cells (++p < 0. 01; +++p < 0. 001).
Figure 7
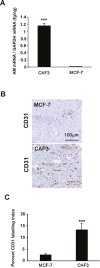
Figure 7. MCF-7 cells showed barely detectable angiogenesis compared to CAFs in an in vivo Matrigel plug bioassay
A. Expression of AM mRNA in MCF-7 cells and CAF3. Total RNA (1 μg, DNA-free) prepared from MCF-7 cells and CAF3 was transcribed into cDNA and subjected to RT-qPCR as described in the Figure 3A (***p < 0.001). B. C57BL/6 mice were injected s.c. at the abdominal midline with 0.4 ml of growth factor-depleted Matrigel admixed to MCF-7 (1.5 × 10⁶ cells) or to CAFs (1.5 × 10⁶ cells) for 15 days. Matrigel plugs were processed as described in Figure 5. Staining of blood vessels with anti-CD31 antibody of the Matrigel plugs admixed with MCF-7 cells or CAFs is shown. Panels are representative of multiple fields from five or six plugs per group. Scale bar, 50 μm. C. quantitative assessment of the density of cells that stained positive for CD31 was conducted for the entire surface of the corresponding slides using CALOPIX Software. MBF_Image J 1.43U software was used for the analysis. The values shown represent the means ± standard error of the mean (***p < 0.001).
Figure 8
Figure 8. MAPK pathway is activated by AM in MCF7 cells
A. expression of AM, CLR, RAMP2, and RAMP3 mRNAs in MCF7 cells. Total RNA (1 μg, DNA-free) prepared from MCF7 cells was transcribed into cDNA and subjected to real-time quantitative reverse transcriptase-polymerase chain reaction for the estimation of the relative ratios of AM, CLR, RAMP2, and RAMP3 mRNAs to glyceraldehyde-3-phosphate dehydrogenase (GAPDH) mRNA. Each bar depicts the mean ± standard error of the mean of the three independent experiments from three independent preparations of total RNA from MCF7 cells. B. intracellular-signaling pathway induced by AM in MCF7 cells. MCF cells were treated with AM (10−7 M) for the indicated amounts of time in minutes and then immunoblotted for pERK1/2 and ERK1/2. MEK inhibitor (U0126) inhibited AM induced phosphorylation of ERK (10 μM, 30 min). EGF was used as a positive control to stimulate the phosphorylation of ERK1/2. β-GAPDH was used as a loading control.
Figure 9
Figure 9. Enhanced tumor growth kinetics of MCF-7 breast cancer cells comingled with CAF3
A. MCF-7 cells (1 × 10⁶ cells) were injected alone or coinjected with myofibroblasts (CAF3) (3 × 10⁶ cells) subcutaneously into nude mice. Tumor volume was ploted in indicated days (**p < 0.01; ***p < 0.001). B & C. MCF-7 cells/CAF3 xenograft sections were immunostained with anti-α-SMA and anti-vimentin (B) with a merged view shown, or anti-AM and anti-α-SMA antibodies (C). AM+ α-SMA+ myofibroblasts are shown in a merged view (C, arrows). Scale bar, 50 μM. D. AM signaling blockade inhibited the growth of MCF-7 cells/CAF3 xenografts in vivo. MCF-7 cells (1 × 10⁶ cells) admixed to CAF3 (3 × 10⁶ cells) were injected subcutaneously into the flanks of athymic nude mice (6 weeks old) (n = 10 in each group). Mice with tumor volume averaging ~200 mm3 received i.p. injections of αAMRs (12 mg/kg) every 3 days or AM22-52 peptide (50 μg/mouse) daily. Control mice were treated with 12 mg/kg of nonspecific isotype control IgG. Tumor size was measured every 3 days, and significant differences between the animals treated with αAMRs and AM22-52 and those treated with control IgG were determined by a one-way analysis of variance test (**p < 0.01; ***p < 0.001). E. tumors were weighed immediately after excision and the average tumor weight is indicated as the mean ± SEM (n = 10).
Figure 10
Figure 10. AM blockade induces apoptosis and impairs angiogenesis in MCF-7/CAFs tumor xenografts
A. representative images of tumors from the animals treated with control IgG, αAMRs, and AM22-52. Tumor sections were stained with H&E, Ki-67, cleaved caspase-3, and CD31. Cleaved caspase-3- and Ki-67-positive cells are shown; they were analyzed on the basis of 10 magnification fields (400x) per section. Immunohistochemical staining of the endothelial cell surface marker CD31 was used to determine the microvessel density. Quantitative assessment of the density of cells that stained positive for Ki-67 B. cleaved caspase-3 C. or CD31 D. was conducted for the entire surface of the corresponding slides using CALOPIX Software. MBF_Image J 1.43U software was used for analysis. The values shown represent the mean ± SEM (** p < 0. 01; *** p < 0. 001).

References

    1. Bissell MJ, Radisky D. Putting tumours in context. Nat Rev Cancer. 2001;1:46–54. - PMC - PubMed
    1. Hanahan D, Weinberg RA. Hallmarks of cancer: the next generation. Cell. 2011;144:646–674. - PubMed
    1. Bhowmick NA, Chytil A, Plieth D, Gorska AE, Dumont N, Shappell S, Washington MK, Neilson EG, Moses HL. TGF-beta signaling in fibroblasts modulates the oncogenic potential of adjacent epithelia. Science. 2004;303:848–851. - PubMed
    1. Coussens LM, Werb Z. Inflammation and cancer. Nature. 2002;420:860–867. - PMC - PubMed
    1. Jacobs TW, Byrne C, Colditz G, Connolly JL, Schnitt SJ. Radial scars in benign breast-biopsy specimens and the risk of breast cancer. N Engl J Med. 1999;340:430–436. - PubMed

MeSH terms