

Up-regulation of cerebral cytochrome-c-oxidase and hemodynamics by transcranial infrared laser stimulation: A broadband near-infrared spectroscopy study
- PMID: 28178891
- PMCID: PMC5718323
- DOI: 10.1177/0271678X17691783
Up-regulation of cerebral cytochrome-c-oxidase and hemodynamics by transcranial infrared laser stimulation: A broadband near-infrared spectroscopy study
Abstract
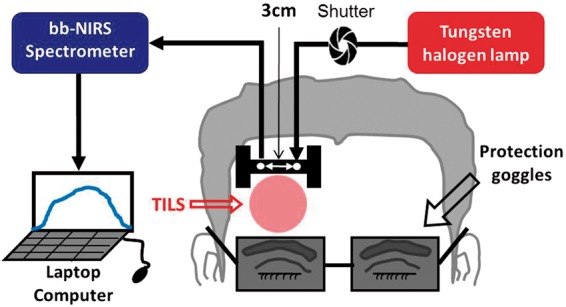
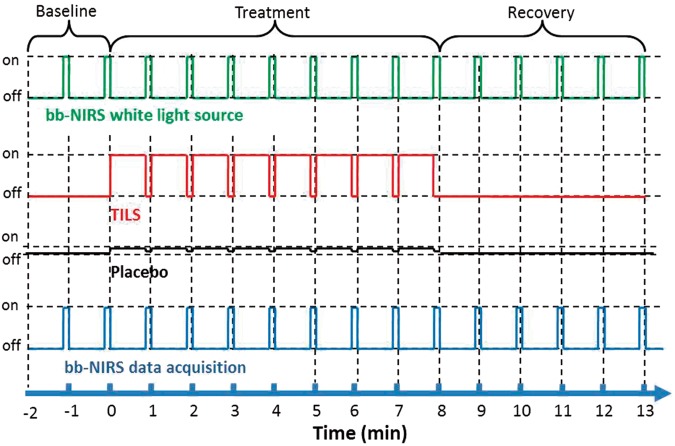
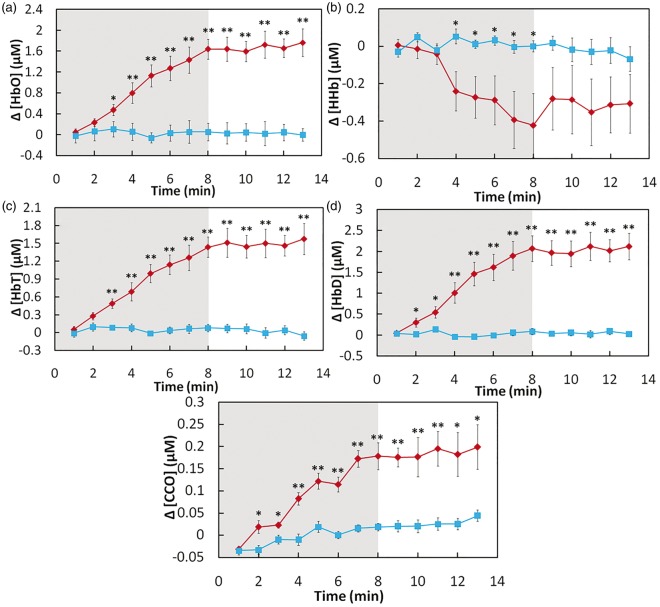
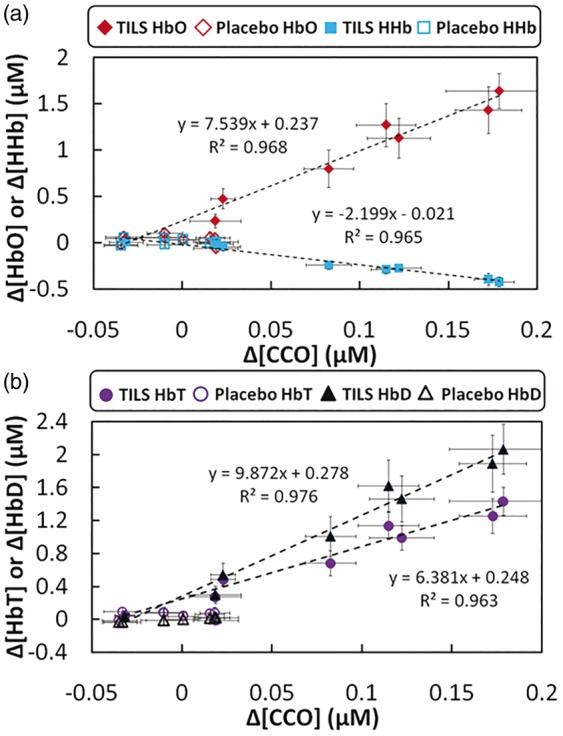
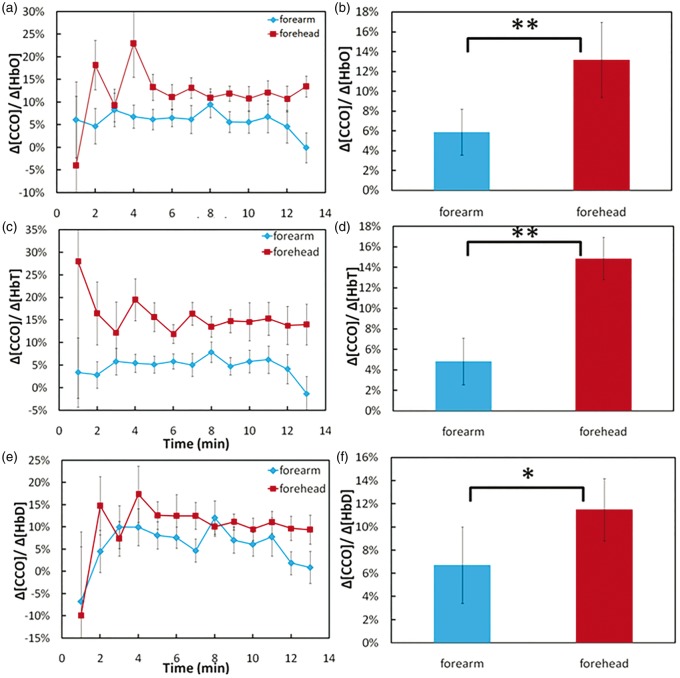
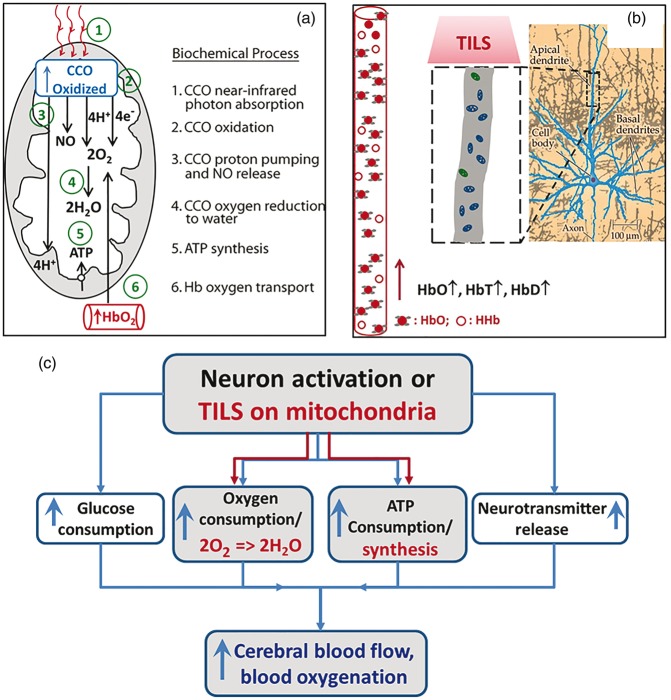
Transcranial infrared laser stimulation (TILS) is a noninvasive form of brain photobiomulation. Cytochrome-c-oxidase (CCO), the terminal enzyme in the mitochondrial electron transport chain, is hypothesized to be the primary intracellular photoacceptor. We hypothesized that TILS up-regulates cerebral CCO and causes hemodynamic changes. We delivered 1064-nm laser stimulation to the forehead of healthy participants ( n = 11), while broadband near-infrared spectroscopy was utilized to acquire light reflectance from the TILS-treated cortical region before, during, and after TILS. Placebo experiments were also performed for accurate comparison. Time course of spectroscopic readings were analyzed and fitted to the modified Beer-Lambert law. With respect to the placebo readings, we observed (1) significant increases in cerebral concentrations of oxidized CCO (Δ[CCO]; >0.08 µM; p < 0.01), oxygenated hemoglobin (Δ[HbO]; >0.8 µM; p < 0.01), and total hemoglobin (Δ[HbT]; >0.5 µM; p < 0.01) during and after TILS, and (2) linear interplays between Δ[CCO] versus Δ[HbO] and between Δ[CCO] versus Δ[HbT]. Ratios of Δ[CCO]/Δ[HbO] and Δ[CCO]/Δ[HbT] were introduced as TILS-induced metabolic-hemodynamic coupling indices to quantify the coupling strength between TILS-enhanced cerebral metabolism and blood oxygen supply. This study provides the first demonstration that TILS causes up-regulation of oxidized CCO in the human brain, and contributes important insight into the physiological mechanisms.
Keywords: Cerebral hemodynamics; energy metabolism; mitochondria; near-infrared spectroscopy; neuroprotection.
Figures
Similar articles
-
Interplay between up-regulation of cytochrome-c-oxidase and hemoglobin oxygenation induced by near-infrared laser.Sci Rep. 2016 Aug 3;6:30540. doi: 10.1038/srep30540. Sci Rep. 2016. PMID: 27484673 Free PMC article. Clinical Trial.
-
Directed physiological networks in the human prefrontal cortex at rest and post transcranial photobiomodulation.Sci Rep. 2024 May 3;14(1):10242. doi: 10.1038/s41598-024-59879-7. Sci Rep. 2024. PMID: 38702415 Free PMC article.
-
Investigation of in vivo measurement of cerebral cytochrome-c-oxidase redox changes using near-infrared spectroscopy in patients with orthostatic hypotension.Physiol Meas. 2007 Feb;28(2):199-211. doi: 10.1088/0967-3334/28/2/008. Epub 2006 Dec 19. Physiol Meas. 2007. PMID: 17237591
-
Measurement of cytochrome oxidase and mitochondrial energetics by near-infrared spectroscopy.Philos Trans R Soc Lond B Biol Sci. 1997 Jun 29;352(1354):669-76. doi: 10.1098/rstb.1997.0048. Philos Trans R Soc Lond B Biol Sci. 1997. PMID: 9232854 Free PMC article. Review.
-
From Jöbsis to the present day: a review of clinical near-infrared spectroscopy measurements of cerebral cytochrome-c-oxidase.J Biomed Opt. 2016 Sep;21(9):091307. doi: 10.1117/1.JBO.21.9.091307. J Biomed Opt. 2016. PMID: 27170072 Review.
Cited by
-
Photobiomodulation for the treatment of neuroinflammation: A systematic review of controlled laboratory animal studies.Front Neurosci. 2022 Sep 20;16:1006031. doi: 10.3389/fnins.2022.1006031. eCollection 2022. Front Neurosci. 2022. PMID: 36203812 Free PMC article.
-
Lights on for Autism: Exploring Photobiomodulation as an Effective Therapeutic Option.Neurol Int. 2022 Oct 27;14(4):884-893. doi: 10.3390/neurolint14040071. Neurol Int. 2022. PMID: 36412693 Free PMC article. Review.
-
Transcranial photobiomodulation prevents PTSD-like comorbidities in rats experiencing underwater trauma.Transl Psychiatry. 2021 May 5;11(1):270. doi: 10.1038/s41398-021-01389-5. Transl Psychiatry. 2021. PMID: 33953158 Free PMC article.
-
Transcranial Photobiomodulation Improves Cognitive Performance in Young Healthy Adults: A Systematic Review and Meta-Analysis.Photobiomodul Photomed Laser Surg. 2019 Oct;37(10):635-643. doi: 10.1089/photob.2019.4673. Epub 2019 Sep 24. Photobiomodul Photomed Laser Surg. 2019. PMID: 31549906 Free PMC article.
-
Transcranial photobiomodulation with 1064-nm laser modulates brain electroencephalogram rhythms.Neurophotonics. 2019 Apr;6(2):025013. doi: 10.1117/1.NPh.6.2.025013. Epub 2019 Jun 13. Neurophotonics. 2019. PMID: 31259198 Free PMC article.
References
-
- Eells JT, Wong-Riley MT, VerHoeve J, et al. Mitochondrial signal transduction in accelerated wound and retinal healing by near-infrared light therapy. Mitochondrion 2004; 4: 559–567. - PubMed
-
- Wong-Riley MT, Liang HL, Eells JT, et al. Photobiomodulation directly benefits primary neurons functionally inactivated by toxins: Role of cytochrome c oxidase. J Biol Chem 2005; 280: 4761–4771. - PubMed
-
- Barrett DW, Gonzalez-Lima F. Transcranial infrared laser stimulation produces beneficial cognitive and emotional effects in humans. Neuroscience 2013; 230: 13–23. - PubMed
-
- Lampl Y, Zivin JA, Fisher M, et al. Infrared laser therapy for ischemic stroke: A new treatment strategy: results of the NeuroThera Effectiveness and Safety Trial-1 (NEST-1). Stroke 2007; 38: 1843–1849. - PubMed
-
- Zivin JA, Albers GW, Bornstein N, et al. Effectiveness and safety of transcranial laser therapy for acute ischemic stroke. Stroke 2009; 40: 1359–1364. - PubMed
MeSH terms
Substances
Grants and funding
LinkOut - more resources
Full Text Sources
Other Literature Sources
