. 2017 Feb;7(2):160274.
doi: 10.1098/rsob.160274.

Ninein is essential for apico-basal microtubule formation and CLIP-170 facilitates its redeployment to non-centrosomal microtubule organizing centres

Affiliations

Ninein is essential for apico-basal microtubule formation and CLIP-170 facilitates its redeployment to non-centrosomal microtubule organizing centres

Deborah A Goldspink et al. Open Biol. 2017 Feb.

Abstract

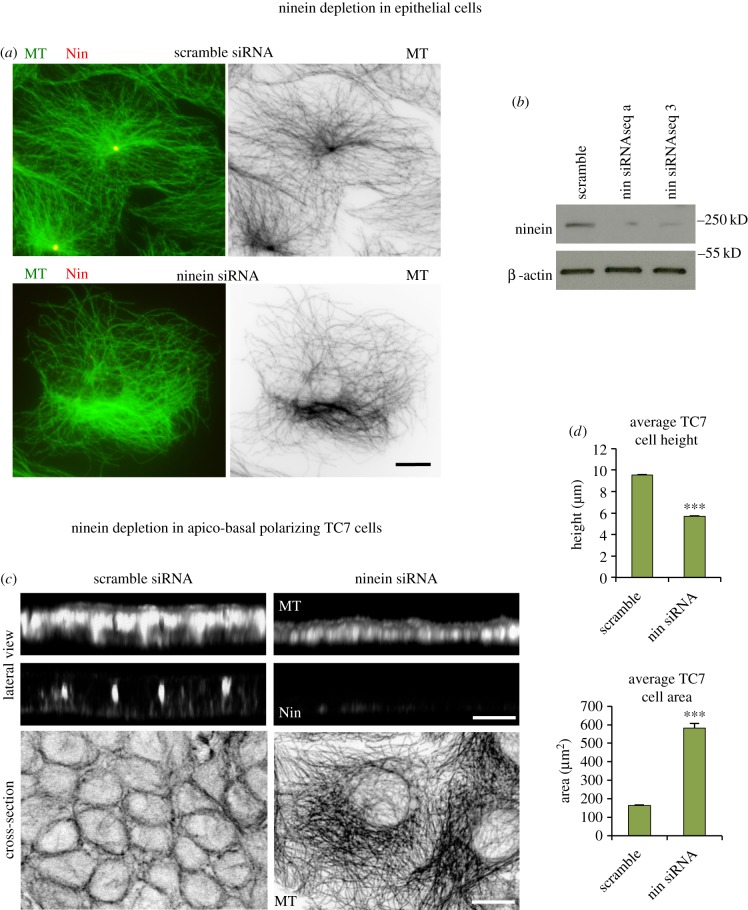
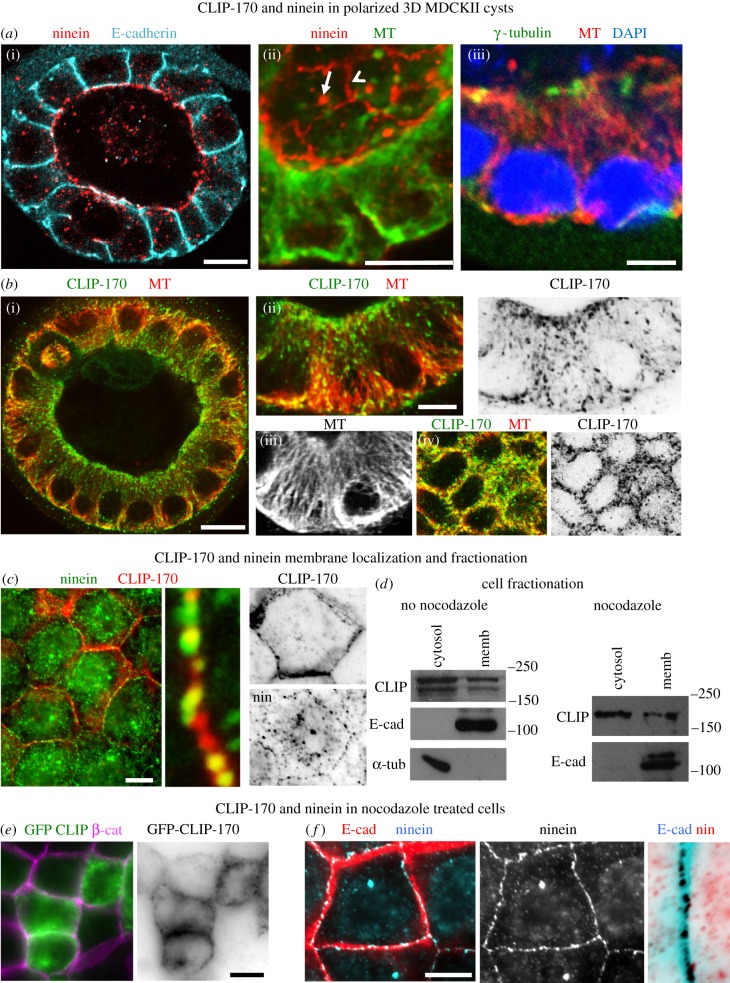
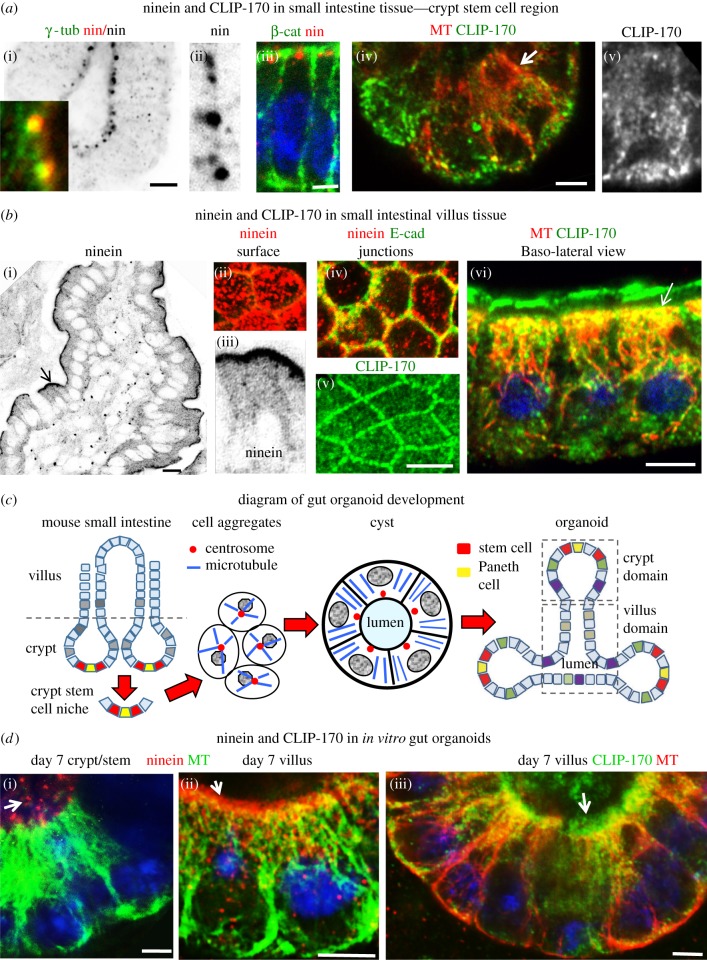
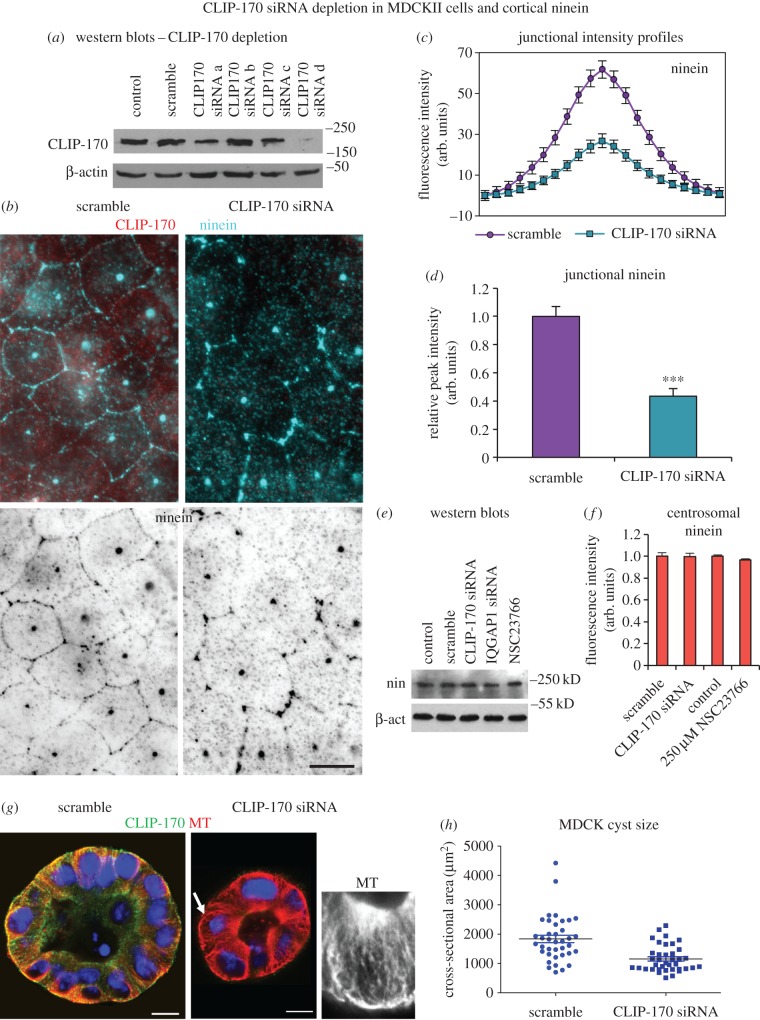
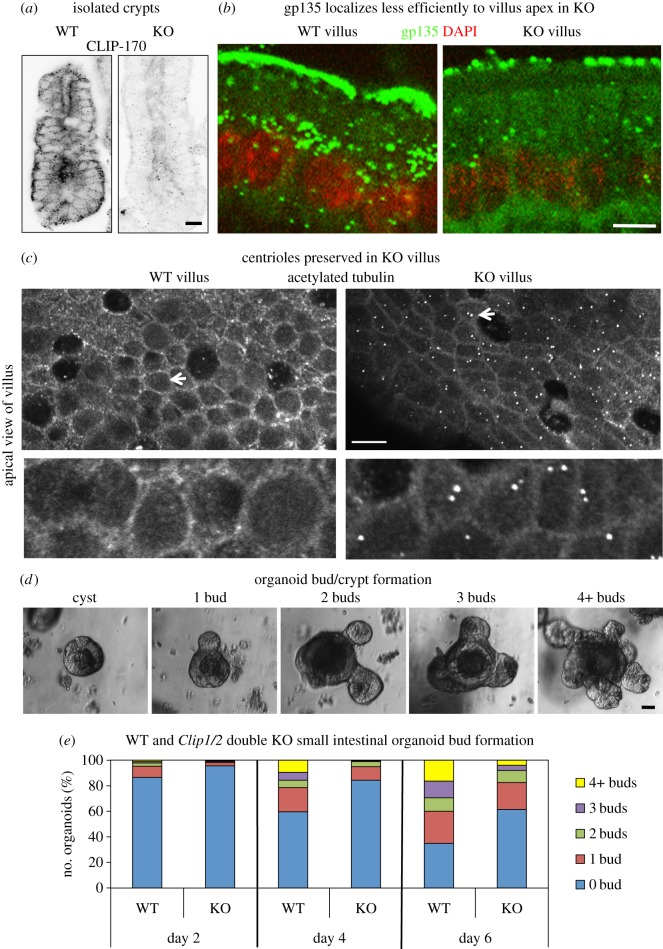
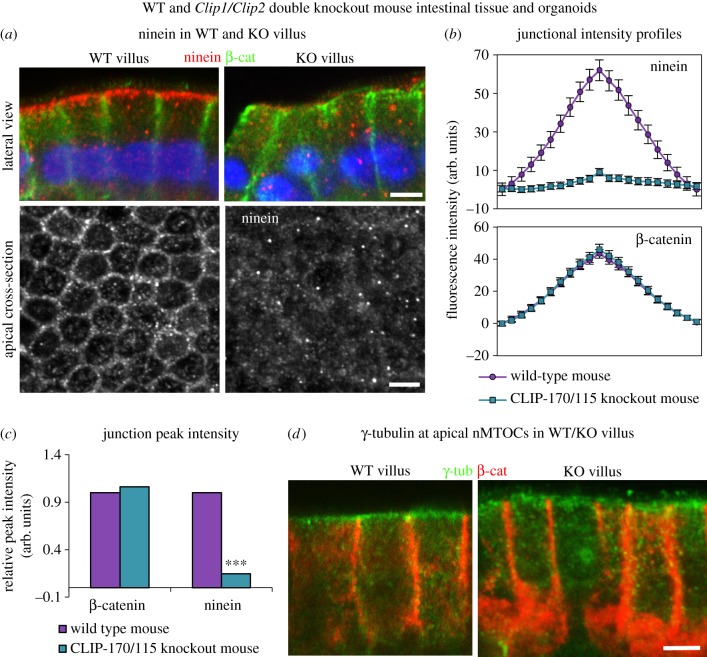
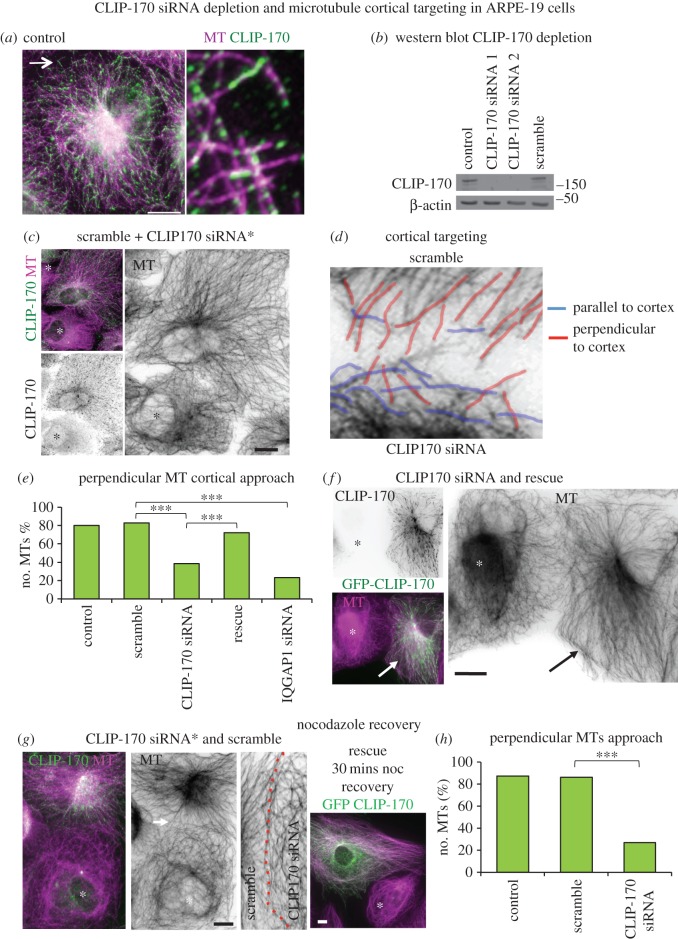
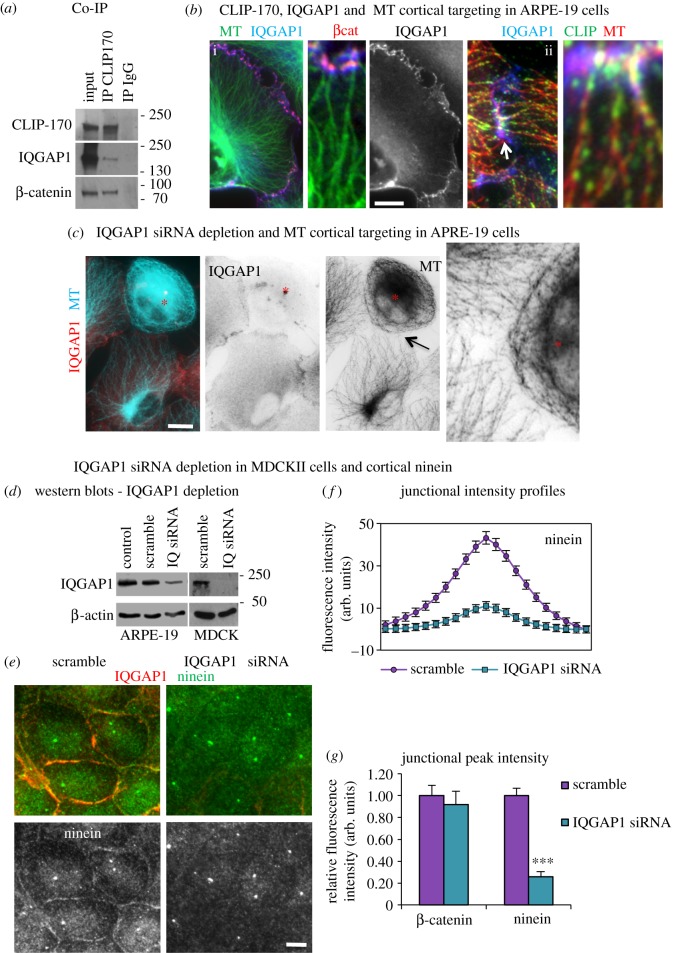
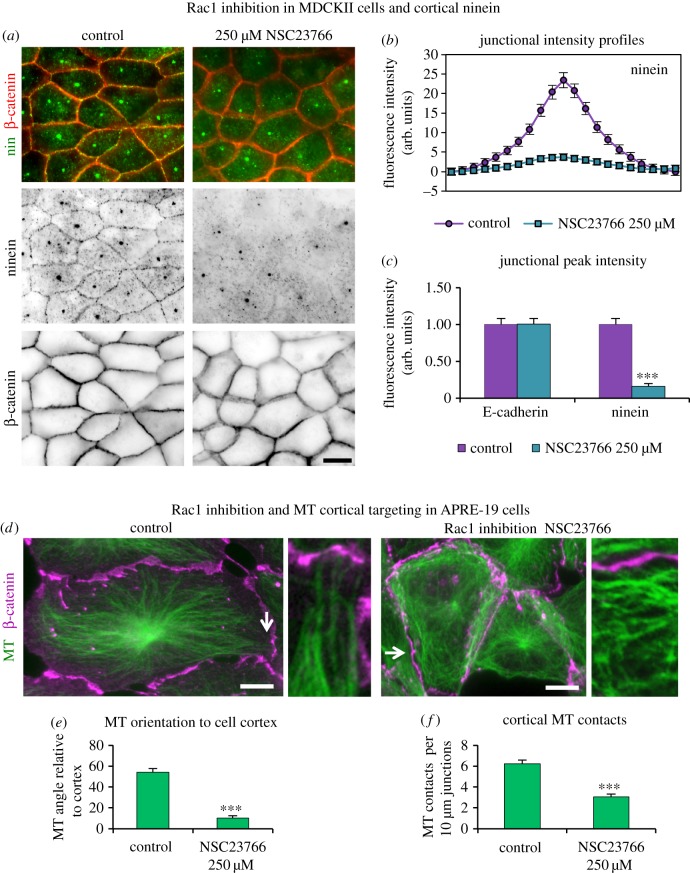
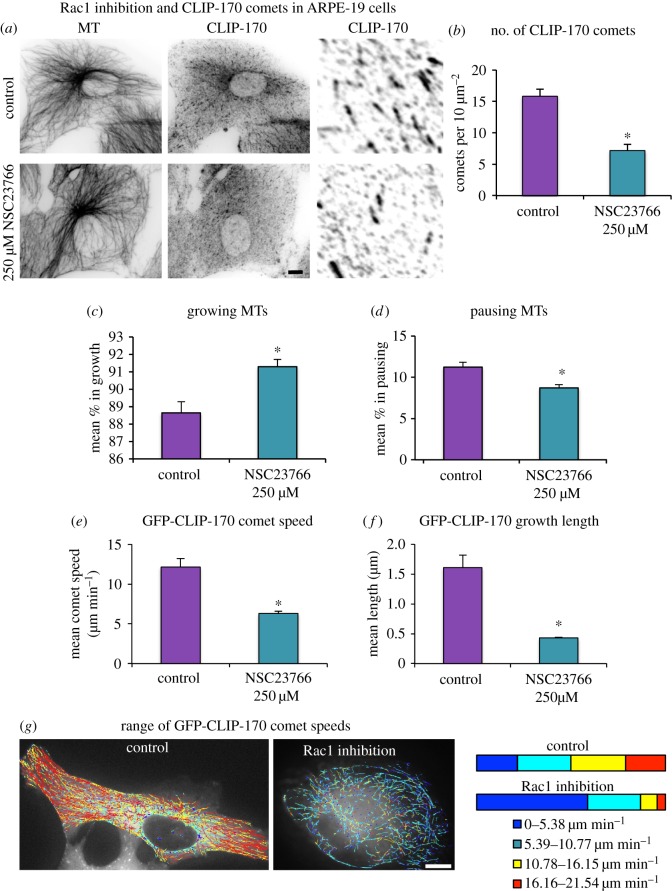
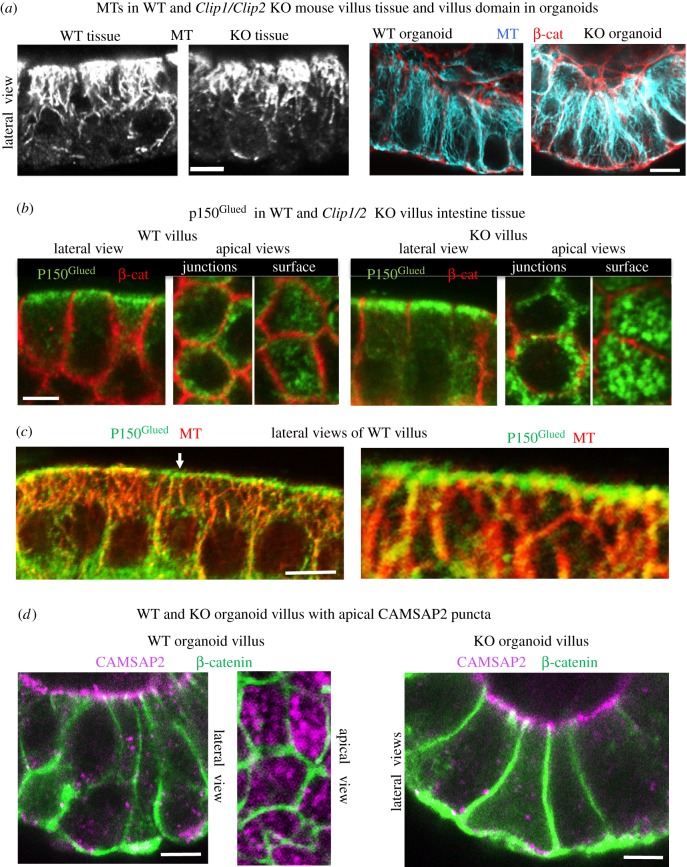
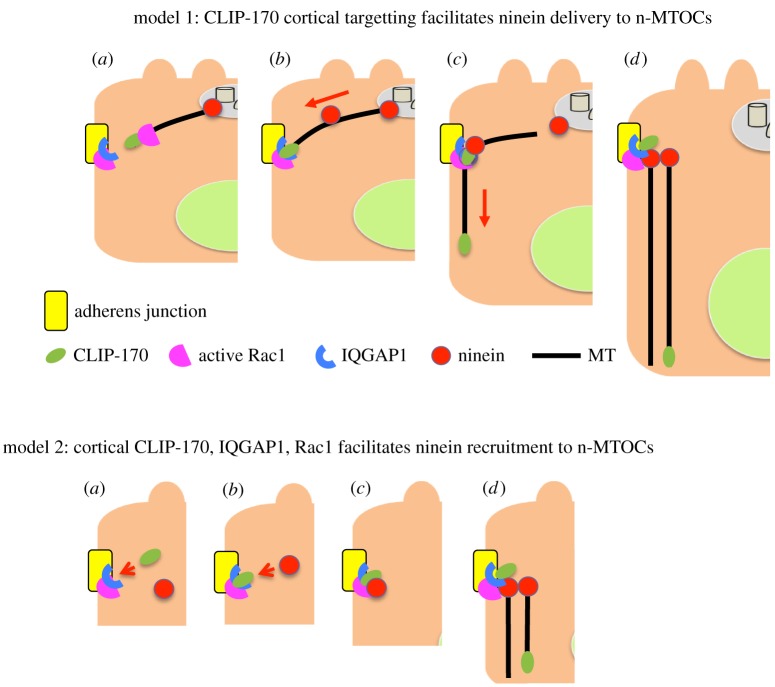
Differentiation of columnar epithelial cells involves a dramatic reorganization of the microtubules (MTs) and centrosomal components into an apico-basal array no longer anchored at the centrosome. Instead, the minus-ends of the MTs become anchored at apical non-centrosomal microtubule organizing centres (n-MTOCs). Formation of n-MTOCs is critical as they determine the spatial organization of MTs, which in turn influences cell shape and function. However, how they are formed is poorly understood. We have previously shown that the centrosomal anchoring protein ninein is released from the centrosome, moves in a microtubule-dependent manner and accumulates at n-MTOCs during epithelial differentiation. Here, we report using depletion and knockout (KO) approaches that ninein expression is essential for apico-basal array formation and epithelial elongation and that CLIP-170 is required for its redeployment to n-MTOCs. Functional inhibition also revealed that IQGAP1 and active Rac1 coordinate with CLIP-170 to facilitate microtubule plus-end cortical targeting and ninein redeployment. Intestinal tissue and in vitro organoids from the Clip1/Clip2 double KO mouse with deletions in the genes encoding CLIP-170 and CLIP-115, respectively, confirmed requirement of CLIP-170 for ninein recruitment to n-MTOCs, with possible compensation by other anchoring factors such as p150Glued and CAMSAP2 ensuring apico-basal microtubule formation despite loss of ninein at n-MTOCs.

Keywords: CLIP-170; IQGAP1; Rac1; microtubules; ninein; non-centrosomal MTOCs.


Figures

Figure 1.
Figure 1.
Ninein depletion in epithelial cells. (a) Scramble and ninein siRNA (seq a) depleted TC7 cells methanol fixed and stained for MTs (mAb YL1/2; green; invert) and ninein (mAb N5; red), showing loss of radial MT organization and centrosomal focus in depleted cell. (b) Western blot of cell lysates of scramble and ninein (seq a and 3) siRNA showing ninein (mAb Bethyl) and β-actin expression. (c) Confocal optical sections and three-dimensional reconstructions of scramble and ninein siRNA (seq a) depleted TC7 cells seeded for apico-basal MT array formation, fixed in methanol and labelled for MTs (mAb YL1/2) and ninein (pAb Pep3). (d) Analysis of cell height (scramble n = 284, nin siRNA seq a = 251) and cross-sectional area (scramble n = 190, nin siRNA seq a = 200) in scramble and ninein siRNA-treated TC7 cells show decreased cell height and increased area in depleted cell (Mann–Whitney U-test, ***p < 0.001). Scale bars, 10 µm.
Figure 2.
Figure 2.
CLIP-170 and ninein in confluent and fully differentiated MDCKII cysts. (a,b) Cells grown in Matrigel to form three-dimensional cysts. (a) Optical sections of cysts fixed in methanol and stained for ninein (pAb Pep3; red) and E-cadherin (mAb, blue) showing apical localization in (a(i)) and cyst regions showing apico-basal MTs (mAb YL1/2, green in (a(ii)); pAb α-tubulin, red in (a(iii))). Optical oblique section though cyst region in (a(ii)) shows both apical and baso-lateral views with ninein (pAb N5; red) at apical cortex (arrowhead) and centrosomes (arrow) in polarized epithelial cells. Baso-lateral view of cyst epithelial cells in (a(iii)) shows γ-tubulin (green, (a(iii))) at centrosomes. (b) Optical section of cyst fixed in formaldehyde–methanol and stained for CLIP-170 (pAb, green) and MTs (mAb YL1/2, red) (b(i)) and cyst regions revealing apico-basal MTs (red; (b(ii));(b(iii))) and apical concentration of CLIP-170 colocalizing with MTs at apical cortex (b(iv)). (c) Confluent cells fixed in methanol and labelled for ninein (pAb Pep3, green) and CLIP-170 (mAb F-3, red) showing some colocalization (yellow) at cortical regions. (d) Western blots of fractionated control and nocodazole-treated cell lysates showing cytosol and membrane fractions, blots probed for CLIP-170 (pAb), E-cadherin (mAb) and α-tubulin (pAb). Note that the double band for CLIP-170 is absent in the nocodazole-treated cell extract and this is most likely due to nocodazole-induced dephosphorylation [33]. (e) Nocodazole-treated cells expressing GFP-CLIP-170 (green) fixed in methanol and labelled for β-catenin (pAb, purple) showing cortical rings of GFP-CLIP-170. (f) Nocodazole-treated cells fixed in methanol and stained for ninein (pAb Pep3, blue) and E-cadherin (mAb, red). Enlarged inverted junctional region showing cortical ninein remains at the cell cortex following nocodazole treatment. Scale bars, 10 µm except for (a(iii)) and (b(ii)), 5 µm.
Figure 3.
Figure 3.
Ninein and CLIP-170 in mouse small intestinal tissue and organoids. (a) Isolated basal region of small intestine crypts fixed in methanol (a(i–iii)) or formaldehyde–methanol (a(iv,v)) and stained for ninein (pAB Pep3, red) (a(i–iii)), γ-tubulin (mAb, green in (a(i))), β-catenin (mAb, green in (a(iii))), CLIP-170 (pAb, green; arrow in (a(iv)) enlarged region in (a(v))) and MTs (mAb YL1/2, red in (a(iv))). Apico-basal MTs are evident in cells of the stem cell region (a(iv)) but ninein is concentrated at the apical centrosome ((a(i–iii))), where it colocalizes with γ-tubulin (inset in (a(i))). CLIP-170 is present as comets in cells within the stem cell region (a(iv,v)). (b) Confocal images of small intestine villus fixed in methanol (b(i–iv)) or formaldehyde–methanol (b(v,vi)) and stained for ninein (pAb Pep3, red) and CLIP-170 (pAb, green) localized at n-MTOCs at cell apices. (b(i,iii)) Cryostat section of villus with apical ninein localization (invert, arrow enlarged region in (b(iii))). (b(ii,iv)) Optical sections through whole mount villus showing apical views of apical surface (b(ii)) and junctions (b(iv)) (E-cadherin, mAb, green) with ninein (pAb Pep3, red) puncta at apical surface and AJ-associated n-MTOCs. (b(v,vi)) Optical sections of whole mount villus stained for CLIP-170 (pAb, green) and MTs (mAb YL1/2, red) showing cross-sectional view (b(v)) of CLIP-170 at apical junctional n-MTOCs and lateral view (b(vi)) of villus cells with CLIP-170 concentrated at apical surface n-MTOCs (arrow) and along length of MTs. (c) Diagram showing small intestine with crypt and villus regions and organoid generation from isolated mouse small intestinal stem cells initially leading to the formation of cell aggregates that develop into cysts and then into organoids with crypt and villus domains. (d) MTs (mAb YL1/2, green in (d(i,ii)) and red in (d(iii)), Ninein (pAb Pep3, red) and CLIP-170 (pAb, green) in 7-day cultured gut organoids showing apico-basal MT (mAb YL1/2) arrays in both crypt and villus domains, with ninein concentrated at apical centrosomes (arrow in (d(i))) in stem cell region of crypt and ninein (arrow in (d(ii)) and CLIP-170 (arrow in (d(iii))) at apical surface n-MTOCs in villus-domain cells. Scale bars, 5 µm except for (b(i)), 10 µm.
Figure 4.
Figure 4.
CLIP-170 siRNA knockdown in MDCKII cells leads to reduced cortical ninein and smaller cysts. (a) Western blot of lysates of control, scramble and canine CLIP-170 siRNA sequences (ad) showing CLIP-170 and β-actin expression. (b) Scramble and CLIP-170 siRNA-treated cells fixed in methanol and stained for ninein (pAb N5, blue and invert) and CLIP-170 (mAb, red). (c) Junction fluorescence intensity profile analyses (n = 128) of ninein in scramble and CLIP-170-depleted cells. (d) Relative peak intensities of ninein at junctions in scramble and CLIP-170 siRNA-depleted cells reveal a significant decrease in ninein intensity in depleted cells (Mann–Whitney U-test, ***p < 0.05). (e) Western blot of lysates of control, scramble, CLIP-170 siRNA, IQGAP1 siRNA and Rac1 inhibitor NSC23766 (250 µM) treatments showing ninein (pAb Bethyl) and β-actin (pAb) expression. (f) Relative centrosomal ninein fluorescence intensity (n = 50) in control, scramble, CLIP-170 siRNA and Rac1 inhibitor NSC23766 (250 µM) treated cells revealing no significant difference (unpaired t-test). (g) Scramble and CLIP-170 siRNA-treated cells grown in Matrigel to induce cyst formation and fixed in formaldehyde–methanol and stained for MTs (mAb YL1/2, red) and CLIP-170 (pAb, green) at day 6 showing apico-basal MTs in both scramble and knockdown cysts. Note the marked decrease in cyst size in CLIP-170 siRNA-treated cysts. Inset shows MTs in depleted cell (arrow). (h) Cyst sizes in scramble and CLIP-170-depleted cells based on cross-sectional areas in μm2 with bars indicating averages showing significantly smaller cyst area in knockdown (Mann–Whitney U-test, ***p < 0.001). Scale bars, 10 µm.
Figure 5.
Figure 5.
Small intestine of the Clip1/Clip2 double knockout mouse. (a) Confocal optical sections of small intestinal crypts of WT and Clip1/Clip2 KO mice fixed in formaldehyde–methanol and stained for CLIP-170 (pAb, invert) showing loss of CLIP-170 staining in knockout crypt. (b) Confocal images showing lateral views of paraformaldehyde fixed villus cells labelled for gp135 (rat mAb, green) and stained for DNA with DAPI (red) indicating markedly less apical gp135 in the KO compared with WT. (c) Optical sections at the level of the apical centrosome in WT and KO villus cells fixed in formaldehyde–methanol and labelled for acetylated tubulin (mAb) showing centrioles in KO cells but no evidence of centrioles in WT (arrows). The arrowed regions are enlarged in inset below. (d) Phase contrast images showing different stages of organoid (WT) development from cyst formation with no buds to fully formed organoids with several crypts (buds). (e) Graph showing the percentage of organoids with 0, 1, 2, 3 or 4 or more buds at day 2, 4 and 6 of development in organoids generated from WT and KO small intestine. Note that the formation of crypts (buds) is much slower in the KO compared to WT. Scale bars: (a,c) 10 µm, (b) 5 µm, (d) 20 µm. Two-way ANOVA statistical testing WT versus KO, day 2, day 4, day 6, p < 0.05.
Figure 6.
Figure 6.
Loss of ninein at n-MTOCs in Clip1/Clip2 double knockout mouse intestine. (a) Confocal images of methanol-fixed villus cells stained for ninein (pAb Pep3, red) and β-catenin (mAb, green) showing baso-lateral and apical cross-sectional views and revealing almost total absence of ninein at apical surface n-MTOCs in KO. (b) Fluorescence intensity profiles for β-catenin (n = 112) and ninein (n = 112) at junctions in WT and KO villus. (c) Relative peak fluorescence intensities for β-catenin and ninein at junctional sites in WT and KO villus revealing no significant difference in junctional β-catenin but a significant reduction in ninein (Mann–Whitney U-test, ***p < 0.001). (d) Confocal sections showing baso-lateral views of methanol-fixed villus cells stained for γ-tubulin (mAb, green) and β-catenin (pAb, red) revealing γ-tubulin at apical n-MTOCs in both WT and KO. Scale bars, 5 µm.
Figure 7.
Figure 7.
CLIP-170 siRNA depletion leads to compromised MT cortical targeting. (a) ARPE-19 cell methanol fixed and labelled for MTs (mAb YL1/2, purple) and CLIP-170 (pAb, green; enlarged region arrowed). (b) Western blot of lysates from control, scramble and CLIP-170 siRNA (human seq 1 and 2) ARPE-19 cells showing CLIP-170 (pAb) and β-actin expression. (c) Mixed culture showing a scramble cell next to a CLIP-170 siRNA-depleted cell (*) stained for CLIP-170 (pAb, green, invert) and MTs (mAb YL1/2, purple, invert). (d) Cell–cell contact between a scramble (top) cell and a CLIP-170-depleted (bottom) cell with perpendicular cortical targeting MTs highlighted in red and MTs parallel to the cell cortex in blue. (e) Graph showing the mean (n = 30) percentage of MTs with a perpendicular approach to cell–cell contacts in control, scramble, CLIP-170 siRNA, GFP-CLIP-170 rescue and IQGAP1 siRNA-treated cells. A non-parametric one-way ANOVA with Dunn's multiple comparison post-test was used and revealed no significance between control and scramble and between scramble and CLIP-170 rescue but significant differences between scramble and CLIP-170 siRNA, between scramble and IQGAP1 siRNA and between CLIP-170 siRNA and CLIP-170 rescue (***p < 0.001). (f) GFP-CLIP-170 (green, invert) expressing ARPE-19 cell (arrow) next to a CLIP-170-depleted cell (*), showing rescue of radial MT (purple, invert) organization. (g) Mixed culture of scramble and CLIP-170 siRNA (*) cells fixed 30 min following nocodazole removal and stained for MTs (purple, invert) and CLIP-170 green). The enlarged region of cell–cell contact (dotted red line) between scramble (right) and CLIP-170-depleted (left) cells shows lack of perpendicular MT approach in depleted cell. GFP-CLIP-170 (green) expressing ARPE-19 cell next to a CLIP-170-depleted cell (*) showing rescue of radial MT (purple) organization 30 min after nocodazole removal. (h) Graph showing the mean (n = 30) percentage of MTs with perpendicular approach to cell–cell contacts following nocodazole washout in control, scramble and CLIP-170 siRNA cells showing no significance between control and scramble but significant differences between control and CLIP-170 siRNA and between scramble and CLIP-170 siRNA (Mann–Whitney U-test, ***p < 0.001). Scale bars, 5 µm. Except for (a) 10 µm.
Figure 8.
Figure 8.
IQGAP1 siRNA depletion leads to loss of MT cortical targeting and reduced ninein at n-MTOCs. (a) Western blot of Co-IP experiments using either CLIP-170 or IgG as bait to pull down protein complexes in TC7 cells showing CLIP-170 pulls down endogenous CLIP-170, IQGAP1 and β-catenin but not the IgG control lanes (CLIP-170 pAb was used for probing but mAb used as bait). (b) ARPE-19 cells methanol fixed and stained for IQGAP1 (mAb), MTs (YL1/2) and β-catenin (pAb), purple in b(i) indicating colocalization and nocodazole recovery. (b(ii)) showing CLIP-170-bound MTs targeting cortical IQGAP1 located on the inner face of junctional β-catenin puncta. The arrow indicates region enlarged in the inset to the left. (c) Mixed culture of ARPE-19 cells fixed in methanol showing a scramble cell next to a IQGAP1-depleted cell (*) stained for IQGAP1 (mAb, red, invert) and MTs (rab α-tubulin, blue, invert). Enlarged region (arrow) showing lack of cortical MT targeting in IQGAP1-depleted cell. (d) Western blots of lysates of control, scramble and IQGAP1 siRNA ARPE-19 and MDCKII cells showing IQGAP1 and β-actin expression. (e) Scramble and IQGAP1 siRNA-treated cells methanol fixed and stained for ninein (pAb Pep3, green) and IQGAP1 (mAb, red) showing less cortical ninein in depleted cells. (f) Junctional fluorescence intensity profile (n = 92) for ninein in scramble and IQGAP1 siRNA-treated cells. (g) Relative peak fluorescence intensities for β-catenin and ninein at junctions in scramble and IQGAP1 siRNA-treated cells showing no significance in β-catenin intensities (unpaired t-test) but a significant reduction in ninein (non-parametric Mann–Whitney U-test, ***p < 0.001). Scale bars, 10 µm except (b(ii)), 2 µm.
Figure 9.
Figure 9.
Rac1 inhibition leads to reduced cortical ninein and MT junctional targeting. (a) Control and Rac1-inhibited (250 µM NSC23766) cells methanol fixed and stained for ninein (pAb N5, green, invert) and β-catenin (mAb, red, invert) showing a marked reduction in cortical ninein in Rac1-inhibited cells. (b) Junctional fluorescence intensity profile for ninein (n = 112) in control and Rac1-inhibited cells. (c) Relative peak fluorescence intensity of E-cadherin and ninein at junctions in control and Rac1-inhibited cells showing no significance in E-cadherin but in ninein (non-parametric Mann–Whitney U-test, ***p < 0.001). (d) Control and Rac1-inhibited (250 µM NSC23766) ARPE-19 cells methanol fixed and stained for β-catenin (mAb, purple) and MTs (pAb α-tubulin, green), with enlarged regions (arrowed) highlighting cortical MT approaches. Note several MTs aligned parallel to the cortex in Rac1-inhibited cells. (e) Graph showing the mean MT orientation to cell junctions (n = 30), using FibrilTool [42] revealing significant (***) deviation from perpendicular targeting in inhibited cells (non-parametric Mann–Whitney U-test, ***p < 0.001). (f) Graph showing the mean (n = 30) number of MT contacts per 10 µm, junctional β-catenin staining revealing significantly fewer cortical contacts in inhibited cells (unpaired t-test, ***p < 0.001). Scale bars, 10 µm.
Figure 10.
Figure 10.
Rac1 inhibition leads to fewer and slower CLIP-170 comets and decreased pausing events. (a) Control and Rac1-inhibited (250 µM NSC23766) ARPE-19 cells fixed in formaldehyde–methanol and stained for CLIP-170 (pAb) and MTs (mAb YL1/2) with enlargements of comets. (b) Graph showing the mean number of CLIP-170 comets (n = 30) for each treatment showing a reduction in comets with Rac1 inhibition. (cg) GFP-CLIP-170 dynamics in control and Rac1-inhibited ARPE-19 cells. (c,d) The mean (n = 4) percentage of composite tracks defined as growing or pausing. Only top part of graph is shown in (c). (e,f) Analysis of the mean (n = 4) GFP-CLIP-170 comet speed and growth length. (g) Plots of GFP-CLIP-170 growth tracks colour coded according to speed with bar plot showing the mean (n = 4) percentage of tracks in each speed group. See also the electronic supplementary material, movies S1 and S2. Scale bars, 10 µm. (bf) Non-parametric Mann–Whitney U-test, *p < 0.05.
Figure 11.
Figure 11.
Apico-basal MTs and CAMSAP2 and p150Glued at n-MTOCs in both WT and KO villus cells. (a) Formaldehyde–methanol-fixed isolated villus epithelial tissue (right) stained for MTs (mAb YL1/2) and organoid villus-domain epithelial cells (left) stained for MTs (blue) and β-catenin (pAb, red) showing apico-basal MTs in both WT and KO. (b) Villus stained for p150Glued (mAb, green) and β-catenin (pAb, red) showing apical surface and junction localization in both WT and KO. (c) Isolated WT villus tissue labelled for p150Glued (mAb, green) and MTs (pAb α-tubulin, red) showing apical concentration of 150Glued at n-MTOCs and apico-basal MTs with minus-ends targeting p150Glued puncta (arrow indicates enlarged area to right). (d) Organoid villus-domain cells stained for CAMSAP2 (pAb, purple) and β-catenin (mAb, green) showing CAMSAP2 puncta at apical surface n-MTOCs in organoids generated from both WT and KO small intestine. Scale bars, 5 µm.
Figure 12.
Figure 12.
Models for ninein redeployment to n-MTOCs during epithelial differentiation. Model 1: (a) CLIP-170 (green) bound MTs elongate and target IQGAP1 (blue) at adherens junctions (yellow) in a process promoted by active Rac1 (pink). (b) CLIP-170, IQGAP1 and active Rac1 facilitate MT capture at adherens junction-associated n-MTOCs, and ninein (red) is transported along MTs. (c) Ninein and CLIP-170 bind to adherens junctions, MT minus-ends are released from centrosome and plus-ends elongate towards the cell base. (d) Ninein anchors MT minus-ends at n-MTOCs at adherens junctions while plus-ends elongate towards cell base thus generating the apico-basal array. Model 2: (a) CLIP-170 (green) is recruited to apical adherens junctions (yellow) and forms a complex with IQGAP1 (blue) and active Rac1 (pink). (b) Cortical receptor complex IQGAP1, CLIP-170 and active Rac1 recruits ninein (red) to apical adherens junctions. (c) Ninein accumulates at forming n-MTOCs associated with apical adherens junctions. (d) MT (black) minus-ends are captured by ninein at n-MTOCs and plus-ends elongated towards the cell base.

References

    1. Bacallao R, Antony C, Dotti C, Karsenti E, Stelzer EH, Simons K. 1989. The subcellular organization of Madin-Darby canine kidney cells during the formation of a polarized epithelium. J. Cell Biol. 109, 2817–2832. (doi:10.1083/jcb.109.6.2817) - DOI - PMC - PubMed
    1. Meads T, Schroer TA. 1995. Polarity and nucleation of microtubules in polarized epithelial cells. Cell Motil. Cytoskeleton 32, 273–288. (doi:10.1002/cm.970320404) - DOI - PubMed
    1. Mogensen MM, Tucker JB, Stebbings H. 1989. Microtubule polarities indicate that nucleation and capture of microtubules occurs at cell surfaces in Drosophila. J. Cell Biol. 108, 1445–1452. (doi:10.1083/jcb.108.4.1445) - DOI - PMC - PubMed
    1. Sanchez AD, Feldman JL. In press. Microtubule-organizing centers: from the centrosome to non-centrosomal sites. Curr. Opin. Cell Biol. (doi:10.1016/j.ceb.2016.09.003) - DOI - PMC - PubMed
    1. Mogensen MM, Tucker JB, Mackie JB, Prescott AR, Nathke IS. 2002. The adenomatous polyposis coli protein unambiguously localizes to microtubule plus ends and is involved in establishing parallel arrays of microtubule bundles in highly polarized epithelial cells. J. Cell Biol. 157, 1041–1048. (doi:10.1083/jcb.200203001) - DOI - PMC - PubMed

Publication types

Substances

LinkOut - more resources