. 2017 Feb 6:3:16064.
doi: 10.1038/cddiscovery.2016.64. eCollection 2017.

iPS-derived MSCs from an expandable bank to deliver a prodrug-converting enzyme that limits growth and metastases of human breast cancers

Affiliations

iPS-derived MSCs from an expandable bank to deliver a prodrug-converting enzyme that limits growth and metastases of human breast cancers

M Ullah et al. Cell Death Discov. .

Erratum in

Abstract

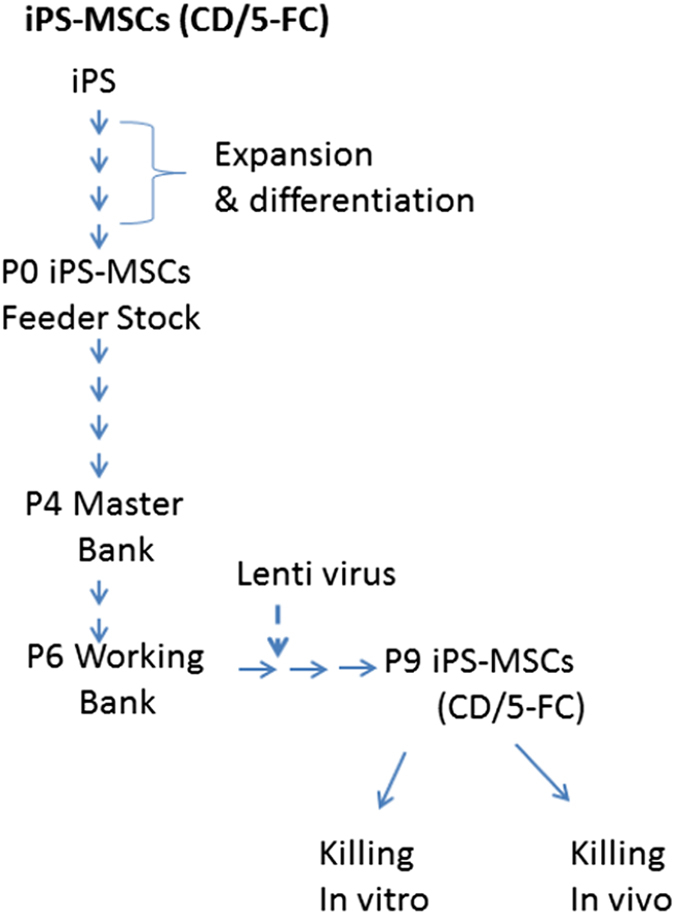
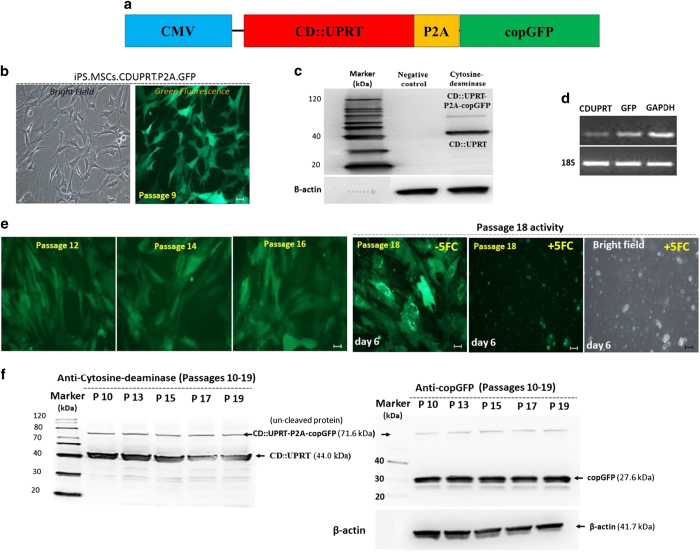
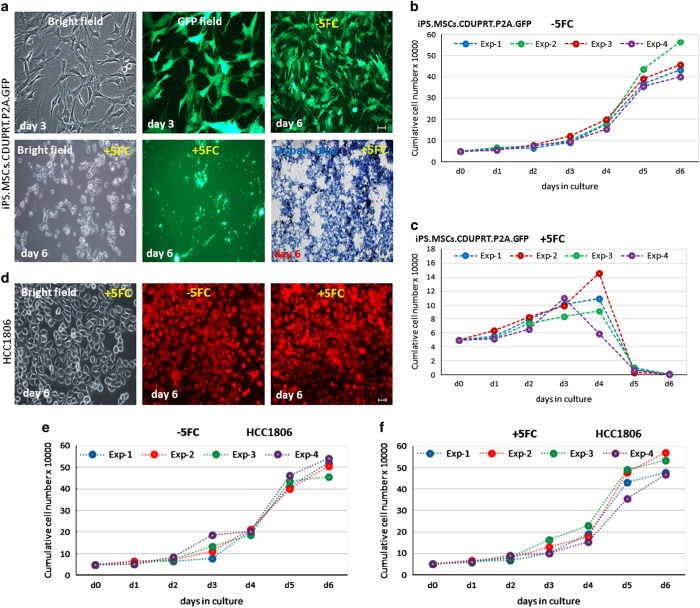
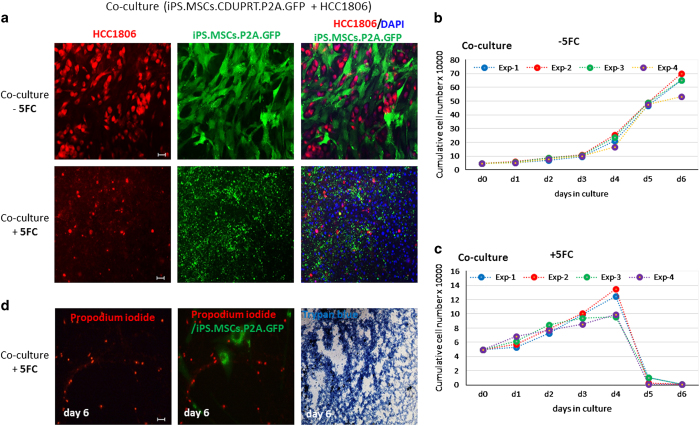
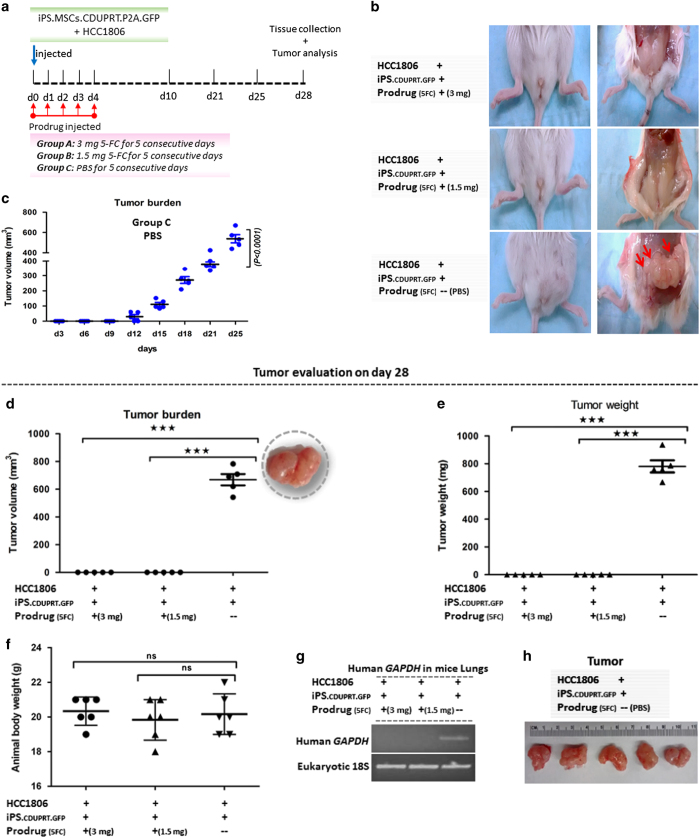
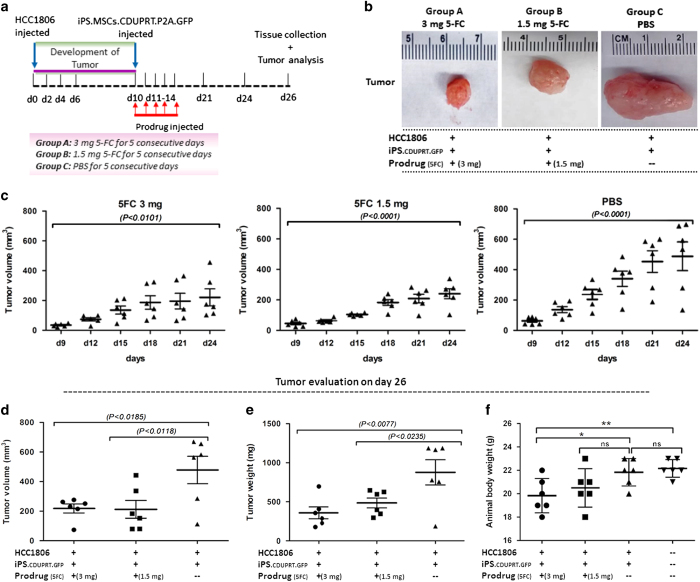
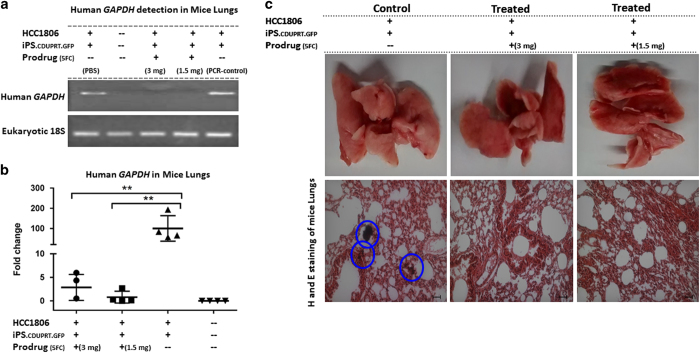
One attractive strategy to treat cancers is to deliver an exogenous enzyme that will convert a non-toxic compound to a highly toxic derivative. The strategy was tested with viral vectors but was disappointing because the efficiency of transduction into tumor cells was too low. Recent reports demonstrated that the limitation can be addressed by using tissue-derived mesenchymal stromal cells (MSCs) to deliver enzyme/prodrug systems that kill adjacent cancer cells through bystander effects. Here we addressed the limitation that tissue-derived MSCs vary in their properties and are difficult to generate in the large numbers needed for clinical applications. We prepared a Feeder Stock of MSCs from induced pluripotent stem cells (iPSs) that provided an extensively expandable source of standardized cells. We then transduced the iPS-derived MSCs to express cytosine deaminase and injected them locally into a mouse xenogeneic model of human breast cancer. After administration of the prodrug (5-fluorocytosine), the transduced iPS-MSCs both limited growth of preformed tumors and decreased lung metastases.


Figures

Figure 1
Figure 1
Schematic representation of the Master Bank cells. iPS-derived MSCs were expanded from the P0 Feeder Bank to generate cells for the P6 Working Bank. Cells from the P6 Working Bank were expanded to P7 cells and then P7 cells were transfected with a lentivirus designed to express genes for CD gene and UPRT (CD::UPRT). As indicated in the text, cells from the P0 Feeder Bank could be expanded about 106-fold to generate cells for the P6 Working Bank as needed.
Figure 2
Figure 2
Transduced iPS-MSCs. (a) Map of CMV promotor driving expression of the CD::UPRT genes linked with copGFP by P2A sequence for cleavage of the two proteins after translation. (b) Representative images of iPS-MSCs-CD cells expanded to passage 9 after transduction at passage 7. (c) Western blotting of passage 9 iPS-MSCs-CD cells demonstrated the expression of CD::UPRT together with a small amount of the uncleaved proteins. (d) RT-PCR assays confirmed the expression of the transduced genes. (e) Representative images of iPS-MSCs-CD cells demonstrating the expression of GFP after expansion to passages 12, 14 and 18. The passage 18 cells were killed by incubation for 6 days in the presence of 300 μM 5-FC. (f) Western blotting analyses demonstrated that both the GFP gene and the CD::UPRT genes continued to be expressed as the iPS-MSCs-CD cells were expanded through passage 19. Scale bar: 50 μm.
Figure 3
Figure 3
Effects of 5-FC on iPS-MSCs-CDs and HCC1806 in culture. iPS-MSCs-CDs or HCC1806 were cultured for 6 days with or without 300 μM 5-FC. (a) Photomicrographs of iPS-MSCs-CDs cultured±5-FC. (b) iPS-MSCs-CD cells cultured in the absence of 5-FC. (c) iPS-MSCs-CD cells cultured in the presence of 5-FC. (d) Photomicrographs of HCC1806 (labeled with CellTracker Red) cultured±5-FC. (e) HCC1806 cells cultured in the absence of 5-FC. (f) HCC1806 cells cultured in the presence of 5-FC. Scale bar: 50 μm.
Figure 4
Figure 4
Effects of 5-FC on co-cultures of iPS-MSCs-CD and HCC1806. iPS-MSCs-CD and HCC1806 were co-cultured for 6 days with or without 300 μM 5-FC. (a) Representative microscopic images of co-cultures. (b) Growth curve of co-cultured cells in the absence of 5-FC. (c) Growth curve of co-cultured cells in the presence of 5-FC. (d) Photomicrographs of HCC1806 (labeled with propodium iodide) cultured±5-FC. Scale bar: 50 μm.
Figure 5
Figure 5
Effects on tumor growth in mice receiving co-injections of iPS-MSCs-CD and HCC1806. A mixture of 1×10⁶ HCC1806 cells and 1×10⁶ iPS-MSCs-CD were injected into a fourth mammary fat pad of each mouse and then 5-FC or PBS was injected i.p. for 5 consecutive days. (a) Schematic representation of the experiment. (b) Representative images of the mammary glands from treated and control mice before and after killing followed by exposure of the fat pad. (c) Growth curve of the tumor burden for 25 days in mice that received PBS instead of 5-FC. (d) Tumor volume of the treated and control groups on day 28. (e) Tumor weight of the treated and control groups on day 28. (f) Body weights of mice from the treated and control groups on day 28. (g) RT-PCR assays for human GAPDH signal in the mice lungs of the treated and control groups on day 28. (h) Excised tumors of control mice on day 28. Mean (±S.E.M.) tumor growth over time in mice (n=5–6 per group) injected with tumor cells and treated as indicated (***P<0.001; NS, not significant).
Figure 6
Figure 6
Effects of injecting iPS-MSCs-CD cells into preformed tumors. HCC1806 (1×10⁶) injected into the fat pads of mice and tumors were allowed to grow for 10 days. Then iPS-MSCs-CD (1×10⁶) were injected into the same fat pad or adjacent tissue followed by five daily i.p. injections of 5-FC or PBS. (a) Schematic representation of the experiment. (b) Representative images of the tumor in the treated and control groups. (c) Tumor burden overtime for 24 days in the treated and control groups. (d) Tumor volume of the treated and control groups on day 26. (e) Tumor weight of the treated and control groups on day 26. (f) Body weight of the anaimals of the treated and control groups on day 26. Mean (±S.E.M.) tumor growth over time in mice (n=6–7 per group) injected with tumor cells and treated as indicated (*P<0.05; **P<0.01; NS, not significant).
Figure 7
Figure 7
Effects on lung metastases of injecting iPS-MSCs-CD cells into preformed mammary tumors. Assays were performed on the lungs from mice from the experiment described in Figure 6. (a) RT-PCR for human GAPDH in the lungs of the treated and control groups on day 26. (b) Real time RT-PCR assays of human GAPDH in the lungs of the treated and control groups on day 26. (c) Representative images of the whole lung, and H&E-stained sections from the treated and control groups. Tumor nodule-rich areas are encircled (blue) in the control group, while the treated groups shows significant inhibition of lung metastases. Mean (±S.E.M.) tumor growth over time in mice (n=6–7 per group) injected with tumor cells and treated as indicated (**P<0.01; NS, not significant), Scale bar: 50 μm.

References

    1. Portsmouth D, Hlavaty J, Renner M. Suicide genes for cancer therapy. Mol Aspects Med 2007; 28: 4–41. - PubMed
    1. Dachs GU, Hunt MA, Syddall S, Singleton DC, Patterson AV. Bystander or no bystander for gene directed enzyme prodrug therapy. Molecules 2009; 14: 4517–4545. - PMC - PubMed
    1. Pereboeva L, Komarova S, Mikheeva G, Krasnykh V, Curiel DT. Approaches to utilize mesenchymal progenitor cells as cellular vehicles. Stem Cells 2003; 21: 389–404. - PubMed
    1. Amara I, Touati W, Beaune P, de Waziers I. Mesenchymal stem cells as cellular vehicles for prodrug gene therapy against tumors. Biochimie 2014; 105: 4–11. - PubMed
    1. Ďuriniková E, Kučerová L, Matúšková M. Mesenchymal stromal cells retrovirally transduced with prodrug-converting genes are suitable vehicles for cancer gene therapy. Acta Virol 2014; 58: 1–13. - PubMed

LinkOut - more resources