. 2016 Nov 8;5(12):e1253656.
doi: 10.1080/2162402X.2016.1253656. eCollection 2016.

Fine-tuning the CAR spacer improves T-cell potency

Affiliations

Fine-tuning the CAR spacer improves T-cell potency

Norihiro Watanabe et al. Oncoimmunology. .

Abstract

The adoptive transfer of genetically engineered T cells expressing chimeric antigen receptors (CARs) has emerged as a transformative cancer therapy with curative potential, precipitating a wave of preclinical and clinical studies in academic centers and the private sector. Indeed, significant effort has been devoted to improving clinical benefit by incorporating accessory genes/CAR endodomains designed to enhance cellular migration, promote in vivo expansion/persistence or enhance safety by genetic programming to enable the recognition of a tumor signature. However, our efforts centered on exploring whether CAR T-cell potency could be enhanced by modifying pre-existing CAR components. We now demonstrate how molecular refinements to the CAR spacer can impact multiple biological processes including tonic signaling, cell aging, tumor localization, and antigen recognition, culminating in superior in vivo antitumor activity.

Keywords: CAR T cell; T cells.


Figures

Figure 1.
Figure 1.
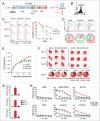
CAR-PSCA T cells exhibit antitumor activity in vitro but fail to exert in vivo antitumor effects when administered intravenously. (A) Schematic of prototype 2G.CAR.PSCA construct (P1.CAR). (B) P1.CAR expression on primary T cells from a representative donor (open: NT cells, filled: CAR T cells). (C) In vitro cytolytic activity of P1.CAR T cells as assessed in a 4-h 51Cr-release assay using PSCA+ (K562-PSCA and Capan-1) and PSCA targets (K562 and 293T cells). Data represents mean ± SE (n = 5). Significance was determined by two-way ANOVA. *p<0.05 compared with NT cells. (D) Tumor volume in NSG mice engrafted s.c. with Capan-1 and treated with either PBS or P1.CAR T cells (n = 3–5 animals/group). (E) In vivo T-cell distribution of GFP/FFluc (control) and GFP/FFluc.CAR T cells as measured by bioluminescence imaging. (F) Expression of FcγRs (types I, II, and III) on monocytes, macrophages and NK cells as assessed by FACS (black: isotype, red: FcγR). (G) Data from a representative donor (from 6 independent co-culture experiments) where T cells (CD3) and FcγR-expressing cells were quantified by FACS analysis on day 0 (co-culture initiation) and day 3 using counting beads.
Figure 2.
Figure 2.
Modification of the IgG derived-hinge-CH2CH3 spacer results in improved tumor localization (A) Representation of modified 2G.CAR.PSCA constructs (M1.CAR and M2.CAR)—vector map and schematics. (B) M1.CAR and M2.CAR expression on primary T cells shown for representative donor. (C) In vitro cytolytic activity of M1 and M2.CAR T cells as assessed in a 4-h 51Cr-release assay using PSCA+ (K562-PSCA and Capan-1) and PSCA targets (K562 and 293T cells). Data represents mean ± SE (n = 5). Significance was determined by two-way ANOVA. *p< 0.05 compared with NT cells. (D) Representative dot plots and summary FACS data (n = 6 independent co-culture experiments) quantifying T cells (CD3) and FcγR-expressing cells on day 3 of co-culture using counting beads. Significance was determined by an unpaired two-tailed t-test and *p< 0.05 when test conditions were compared with control (NT) cells. (E) In vivo T cell distribution of GFP/FFluc (control) and GFP/FFluc.CAR T cells as measured by bioluminescence imaging. (F) Tumor volume in NSG mice engrafted s.c. with Capan-1 and treated with PBS (open), P1.CAR (black), M1.CAR (blue) and M2.CAR T cells (red). Significance was determined by two-way ANOVA. *p < 0.05.
Figure 3.
Figure 3.
Accelerated cell senescence in CAR-modified T cells. (A) Cytolytic activity (as measured in a 4-h 51Cr-release assay; E:T = 40:1) of P1. CAR T cells in culture for 10, 20, or 30 d after transduction when cultured with 293T (PSCA-) and DU145 cells (PSCA+). The bar graph represents mean ± SE (n = 3). Significance was determined by one-way ANOVA for DU145; n.s: not significant. (B) Summary of FACS result of 3 independent co-culture experiments quantifying T cells and DU145 cells on day 6 of co-culture using counting beads. Significance was determined by one-way ANOVA with Bonferroni's multiple comparisons test and *p <0.05 when the test conditions were compared with day 10 T-cell co-cultures. (C) Volcano plot of microarray analysis performed on P1.CAR T cells cultured for 10 or 20 d with differentially expressed genes displayed (n = 3 donors). (D) Fold change of gene expression in P1.CAR T cells maintained in culture for either 20 or 30 d and compared with the gene profile of the same cells maintained in culture for 10 d. All listed genes were significantly upregulated or downregulated as determined by FDR-corrected ANOVA analysis (p < 0.05). (E) Surface phenotypes of CD8+ T cells were analyzed on days 10, 20, and 30 after transduction. The top panel shows representative data --CCR7/CD45RO (left) and CD27/CD28 (right), whereas the pie charts show summary data (mean ± SE; n = 6) on day 30 of culture. Significance was determined by an unpaired two tailed t-test. *p<0.05 compared with NT cells. Tnaive: naive, Tcm: central memory, Tem: effector memory, Temra: terminally differentiated.
Figure 4.
Figure 4.
Tonic signaling is responsible for accelerated T-cell aging (A) Representation of control (ΔCAR) construct—vector map and schematic. (B) ΔCAR expression on primary T cells shown for a representative donor. (C) Representative histogram (from a total of 6 donors analyzed) of phospho-CD247 (CD3ζ) staining performed on CAR-modified T cells. (D) Representative histogram of CD25 expression on CD8+ T cells (left panel) and summarized for 6 donors (right panel, mean ± SE). (E) Representative FACS plot showing cell cycle analysis. Cells were stained with 7AAD and Ki-67 on day 20 after transduction. The pie chart represents summary data (mean ± SE; n = 3). Significance was determined by an unpaired two-tailed t-test. *p < 0.05 compare with NT cells. (F) Fold-expansion of in vitro cultured cells as measured by cell counting using trypan blue exclusion (open: NT cells, gray: ΔCAR, black: P1.CAR, blue: M1.CAR, red: M2.CAR). (G) Cytokine production (GM-CSF, IFNγ, and TNFα) measured in cell supernatant from unstimulated CAR T cells using a Luminex assay (n = 3). Significance was determined by an unpaired two-tailed t-test. *p< 0.05 compared with NT cells.
Figure 5.
Figure 5.
The CH2CH3 spacer is responsible for tonic T-cell signaling (A) Representation of X2.CAR construct—vector map and schematic. (B) X2.CAR expression on primary T cells from a representative donor. (C) The representative histogram of CD25 expression on CD8+ T cells (left panel) and summarized for 6 donors (right panel, mean ± SE). (D) Representative FACS plot showing cell cycle analysis. The pie chart represents mean ± SE (n = 3). Significance was determined by an unpaired two-tailed t-test. *p< 0.05 compared with M2.CAR. (E) Fold-expansion of in vitro cultured cells (gray: ΔCAR, red: M2.CAR, green: X2.CAR). (F) The phenotype of CD8+ T cells was analyzed on days 10, 20, and 30 after transduction. Top panel shows representative data—CCR7/CD45RO (left) and CD27/CD28 (right), while the pie charts show summary data (mean ± SE; n = 6) on day 30 of culture. Significance was determined by an unpaired two-tailed t-test. *p< 0.05 compared with M2.CAR. (G) Cytokine production (GM-CSF, IFNγ, and TNFα) measured in cell supernatant from unstimulated CAR T cells using a Luminex assay (n = 3). Significance was determined by an unpaired two-tailed t-test. *p< 0.05 compared with M2.CAR. (H) The cytolytic activity of CAR T cells as measured in a 4-h 51Cr-release assay against PSCAbright (K562-PSCA and Capan-1), PSCAdim (DU145 and CFPAC-1), and PSCA (K562 and 293T cells) targets (n = 5; mean ± SE). Significance was determined by two-way ANOVA. *p < 0.05 compare with NT cells.
Figure 6.
Figure 6.
Deletion of CH2 results in decreased cell aging and enhanced cytolytic abilities (A) Representation of X32.CAR construct—vector map and schematic. (B) X32.CAR expression on primary T cells from a representative donor. (C) The cytolytic activity of CAR T cells as measured in a 4-h 51Cr-release assay against PSCAbright (K562-PSCA and Capan-1), PSCAdim (DU145 and CFPAC-1), and PSCA (K562 and 293T cells) targets (n = 5; mean ± SE). Significance was determined by two-way ANOVA. *p< 0.05 compared with NT cells. (D) Summary of CD25 expression on CD8+ (top) and CD4+ (bottom) T cells for 6 donors (mean ± SE). (E) Surface phenotypes of CD8+ (top) and CD4+ (bottom) T cells were analyzed on days 10, 20, and 30 after transduction. The pie charts show summary data (mean ± SE; n = 6) on day 30 of culture—CCR7/CD45RO (left) and CD27/CD28 (right). Significance was determined by an unpaired two-tailed t-test. *p< 0.05 compared with M2.CAR. (F) Representative FACS plot showing cell cycle analysis. The pie chart represents mean ± SE (n = 3). Significance was determined by an unpaired two-tailed t-test. *p < 0.05 compared with M2.CAR. (G) Fold-expansion of in vitro cultured cells (gray: ΔCAR, red: M2.CAR, green: X2.CAR, and purple: X32.CAR). (H) Cytokine production (GM-CSF, IFNγ, and TNFα) measured in cell supernatant from unstimulated CAR T cells using a Luminex assay (n = 3). Significance was determined by an unpaired two-tailed t-test. *p< 0.05 compared with M2.CAR.
Figure 7.
Figure 7.
In vivo CAR T-cell function is enhanced using our optimized X32.CAR (A) In vivo T-cell distribution as measured by bioluminescence imaging. (B) Total bioluminescence only at tumor site over time (mean ± SE; n = 5). (C) Total bioluminescence from the entire body on day 35 after T-cell injection (mean ± SE; n = 5). (D) Tumor volume in NSG mice engrafted s.c. with Capan-1 and treated with PBS (open), P1.CAR (black), M1.CAR (blue), M2.CAR (red), X2.CAR (green), and X32.CAR T cells (purple). Significance was determined by two-way ANOVA. *p < 0.05. (E) Overall survival of mice treated with the various CAR T cells. Significance was determined by log-rank test. *p < 0.05.

References

    1. Jensen MC, Riddell SR. Design and implementation of adoptive therapy with chimeric antigen receptor-modified T cells. Immunol Rev 2014; 257(1):127-44; PMID:24329794; http://dx.doi.org/10.1111/imr.12139 - DOI - PMC - PubMed
    1. Dotti G, Gottschalk S, Savoldo B, Brenner MK. Design and development of therapies using chimeric antigen receptor-expressing T cells. Immunol Rev 2014; 257(1):107-26; PMID:24329793; http://dx.doi.org/10.1111/imr.12131 - DOI - PMC - PubMed
    1. Maude SL, Frey N, Shaw PA, Aplenc R, Barrett DM, Bunin NJ, Chew A, Gonzalez VE, Zheng Z, Lacey SF et al.. Chimeric antigen receptor T cells for sustained remissions in leukemia. N Engl J Med 2014; 371(16):1507-17; PMID:25317870; http://dx.doi.org/2184948610.1056/NEJMoa1407222 - DOI - PMC - PubMed
    1. Brentjens RJ, Riviere I, Park JH, Davila ML, Wang X, Stefanski J, Taylor C, Yeh R, Bartido S, Borquez-Ojeda O et al.. Safety and persistence of adoptively transferred autologous CD19-targeted T cells in patients with relapsed or chemotherapy refractory B-cell leukemias. Blood 2011; 118(18):4817-28; PMID:21849486; http://dx.doi.org/10.1182/blood-2011-04-348540 - DOI - PMC - PubMed
    1. Eshhar Z. The T-body approach: redirecting T cells with antibody specificity. Handb Exp Pharmacol 2008(181):329-42; PMID:18071952; http://dx.doi.org/859360410.1007/978-3-540-73259-4_14 - DOI - PubMed

Publication types