. 2017 Jan 27;4(2):e321.
doi: 10.1212/NXI.0000000000000321. eCollection 2017 Mar.

Metabolomic signatures associated with disease severity in multiple sclerosis

Affiliations

Metabolomic signatures associated with disease severity in multiple sclerosis

Pablo Villoslada et al. Neurol Neuroimmunol Neuroinflamm. .

Abstract

Objective: To identify differences in the metabolomic profile in the serum of patients with multiple sclerosis (MS) compared to controls and to identify biomarkers of disease severity.

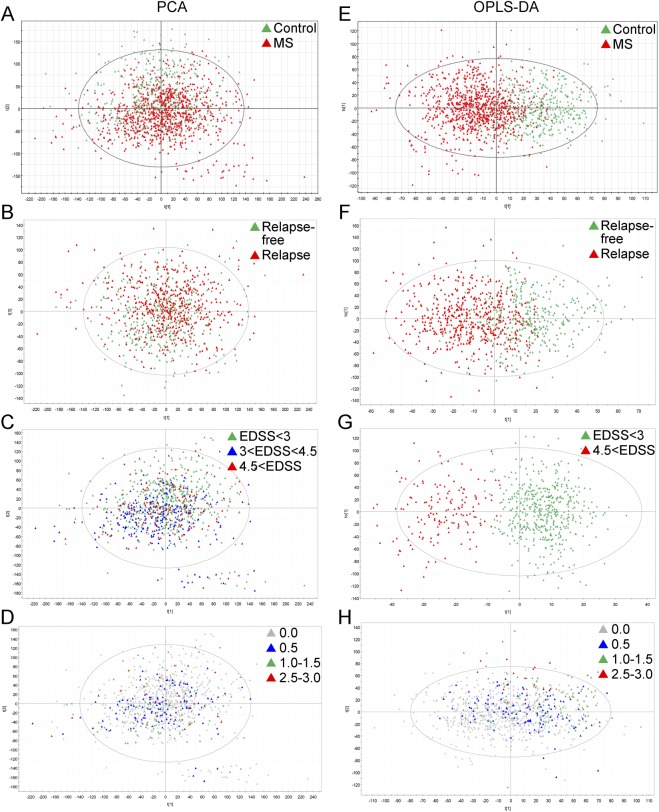
Methods: We studied 2 cohorts of patients with MS: a retrospective longitudinal cohort of 238 patients and 74 controls and a prospective cohort of 61 patients and 41 controls with serial serum samples. Patients were stratified into active or stable disease based on 2 years of prospective assessment accounting for presence of clinical relapses or changes in disability measured with the Expanded Disability Status Scale (EDSS). Metabolomic profiling (lipids and amino acids) was performed by ultra-high-performance liquid chromatography coupled to mass spectrometry in serum samples. Data analysis was performed using parametric methods, principal component analysis, and partial least square discriminant analysis for assessing the differences between cases and controls and for subgroups based on disease severity.

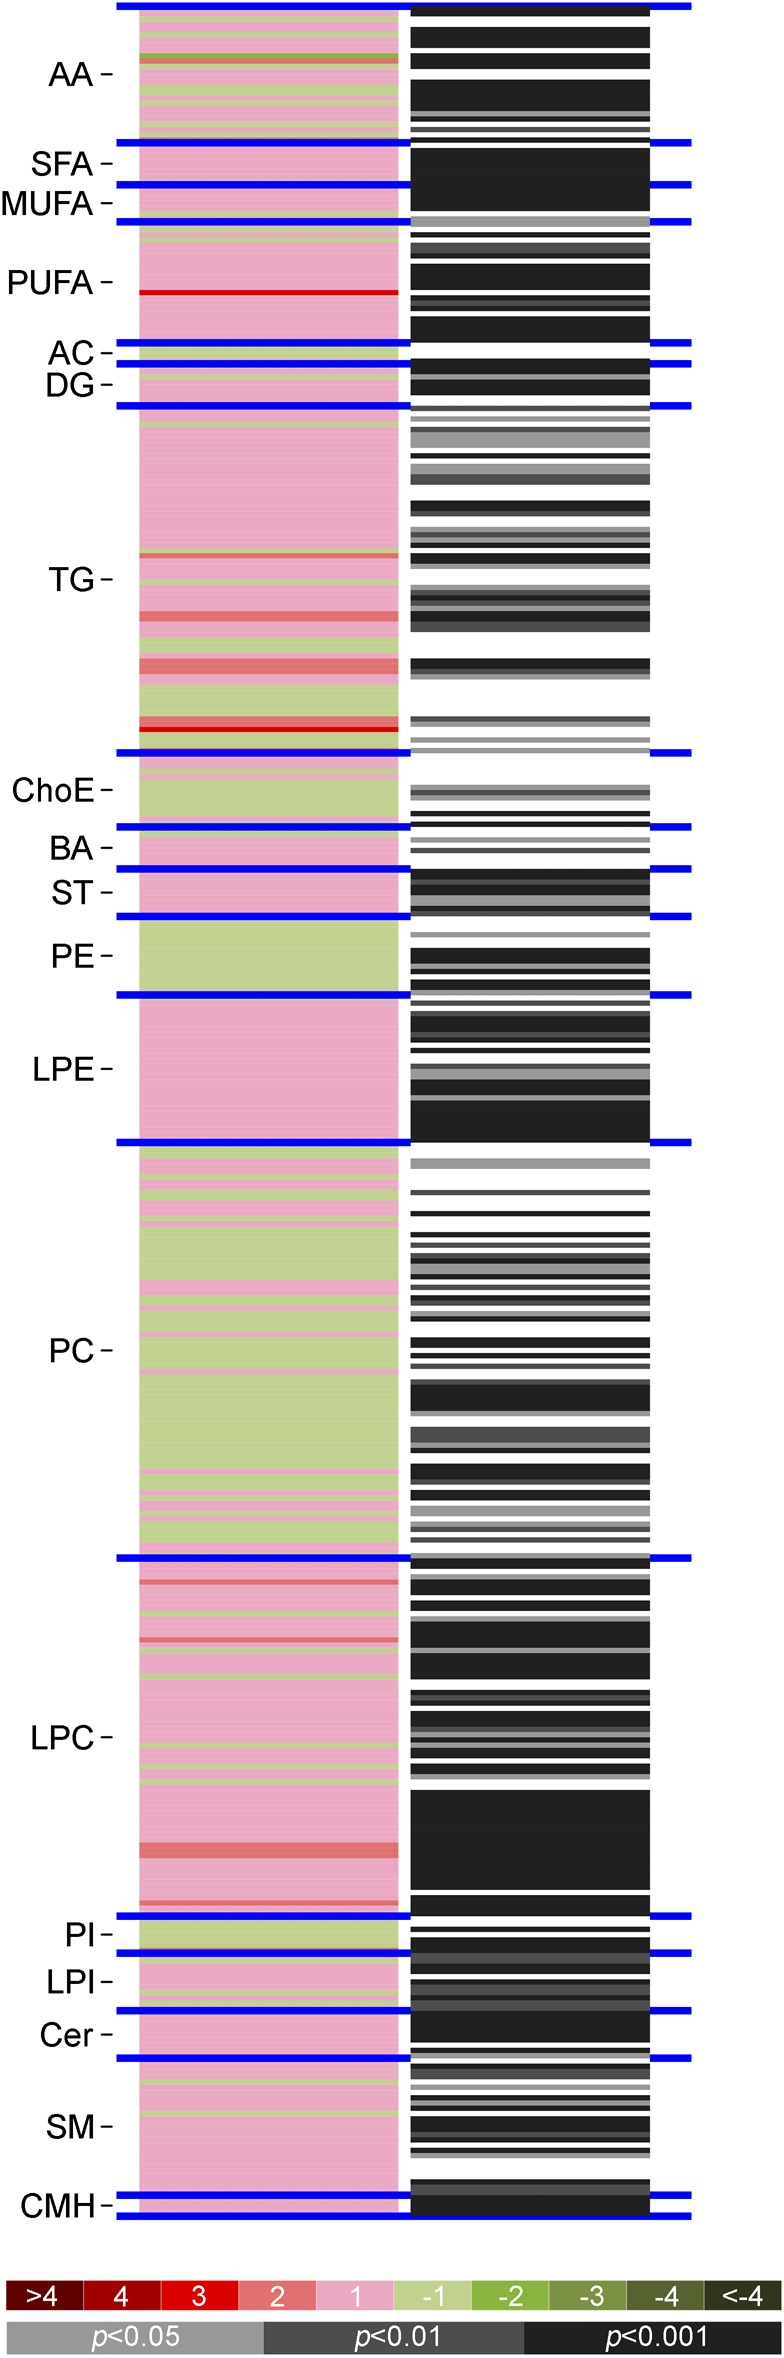
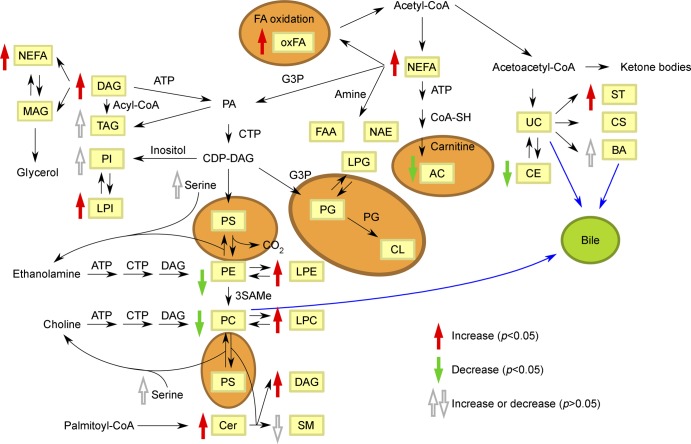
Results: We identified metabolomics signatures with high accuracy for classifying patients vs controls as well as for classifying patients with medium to high disability (EDSS >3.0). Among them, sphingomyelin and lysophosphatidylethanolamine were the metabolites that showed a more robust pattern in the time series analysis for discriminating between patients and controls. Moreover, levels of hydrocortisone, glutamic acid, tryptophan, eicosapentaenoic acid, 13S-hydroxyoctadecadienoic acid, lysophosphatidylcholines, and lysophosphatidylethanolamines were associated with more severe disease (non-relapse-free or increase in EDSS).

Conclusions: We identified metabolomic signatures composed of hormones, lipids, and amino acids associated with MS and with a more severe course.


Figures

Figure 1
Figure 1. Metabolic signatures in the longitudinal cohort
(A–D) Principal components analysis (PCA) models. Each model is a linear combination of the original retention time (Rt)–mass-to-charge (m/z) pair peak areas. Hotelling T2 statistic is shown on the plot, defining a 95% confidence ellipse for the samples included in the analysis. (A) Patients vs healthy controls (R2 = 0.247; Q2 = 0.128). (B) Patients with relapses during follow-up vs relapse-free patients (R2 = 0.380; Q2 = 0.128). (C) Patients reaching Expanded Disability Status Scale (EDSS) >4 from baseline to end of follow-up by month 24 (R2 = 0.380; Q2 = 0.126). (D) Patients with increase in the EDSS (ΔEDSS) from baseline to end of follow-up by month 24 (R2 = 0.381; Q2 = 0.129). R2 = Degree of fit (goodness of prediction); Q2 = predictive ability (goodness of prediction). (E–H) Orthogonal projection to latent structures (OPLS) models. (E) Patients vs healthy controls (R2X = 0.414; R2Y = 0.481; Q2Y = 0.348). (F) Patients with relapses during follow-up vs relapse-free patients (R2X = 0389; R2Y = 0.425; Q2Y = 0.231). (G) Patients reaching EDSS >4.0 from baseline to end of follow-up by month 24 (R2X = 0.512; R2Y = 0.756; Q2Y = 0.555). (H) Patients with ΔEDSS from baseline to end of follow-up by month 24 (R2X = 0.148; R2Y = 0.222; Q2Y = 0.036). R2X = degree of fit for X axis; R2Y = degree of fit for y-axis; Q2Y = predictive ability for y-axis. MS = multiple sclerosis.
Figure 2
Figure 2. Differential metabolomics profile in patients with multiple sclerosis and healthy controls
Heatmaps of the differences between patients (retrospective longitudinal cohort) and controls (vertical axis; ordered by metabolite chemical group and according to their carbon number and unsaturation degree of their esterified acyl chains). The log2 transformed ion abundance ratios (colors from green to red show drops or elevations of the metabolite levels in patients) and unpaired Student t test (or Welch t test where unequal variances were found) p values (gray lines correspond to significant fold changes of individual metabolites) per metabolite are displayed. AA = amino acids; AC = acylcarnitines; BA = bile acids; Cer = ceramides; ChoE = cholesteryl esters; CMH = monohexosylceramides; DG = diglycerols; LPC = lysophosphatidylcholines; LPE = lysophosphatidylethanolamines; LPI = lysophosphatidylinositols; MUFA = monounsaturated fatty acids; PC = phosphatidylcholines; PE = phosphatidylethanolamines; PI = phosphatidylinositols; PUFA = polyunsaturated fatty acids; SFA = saturated fatty acids; SM = sphingomyelins; ST = steroids; TG = triglycerides.
Figure 3
Figure 3. Metabolic pathways of the metabolites identified
Lipid biosynthesis. Fold-change (patients with multiple sclerosis/controls) trends are indicated in red, green, and gray arrows for significant upregulated, deregulated, and nonsignificant chemical classes in patients with MS, respectively. Areas in orange represent processes carried out in the mitochondria. AC = acylcarnitines; CE = cholesteryl esters; Cer = ceramides; CL = cardiolipins; CS = cholesterol sulfate; DAG = diacylglycerols; FAA = primary fatty amides; G3P = glycerol 3-phosphate; LPC = lysophosphatidylcholines; LPE = lysophosphatidylethanolamines; LPG = lysophosphatidylglycerols; LPI = lysophosphatidylinositols; MAG = monoacylglycerols; NAE = N-acylethanolamines; NEFA = nonesterified fatty acids; oxFA = oxidized fatty acids; PA = phosphatidic acids; PC = phosphatidylcholines; PE = phosphatidylethanolamines; PG = phosphatidylglycerols; PI = phosphatidylinositols; PS = phosphatidylserines; SAMe = S-adenosylmethionine; SM = sphingomyelins; ST = steroids; TAG = triacylglycerols; UC = unesterified cholesterol.

References

    1. Ibrahim SM, Gold R. Genomics, proteomics, metabolomics: what is in a word for multiple sclerosis? Curr Opin Neurol 2005;18:231–235. - PubMed
    1. Villoslada P. Biomarkers for multiple sclerosis. Drug News Perspect 2010;23:585–595. - PubMed
    1. Villoslada P, Baranzini S. Data integration and systems biology approaches for biomarker discovery: challenges and opportunities for multiple sclerosis. J Neuroimmunol 2012;248:58–65. - PubMed
    1. Comabella M, Montalban X. Body fluid biomarkers in multiple sclerosis. Lancet Neurol 2014;13:113–126. - PubMed
    1. Tumani H, Hartung HP, Hemmer B, et al. . Cerebrospinal fluid biomarkers in multiple sclerosis. Neurobiol Dis 2009;35:117–127. - PubMed

LinkOut - more resources