. 2017 Jun 2;45(10):e85.
doi: 10.1093/nar/gkx086.

Dynamic chromatin accessibility modeled by Markov process of randomly-moving molecules in the 3D genome

Affiliations

Dynamic chromatin accessibility modeled by Markov process of randomly-moving molecules in the 3D genome

Yinan Wang et al. Nucleic Acids Res. .

Abstract

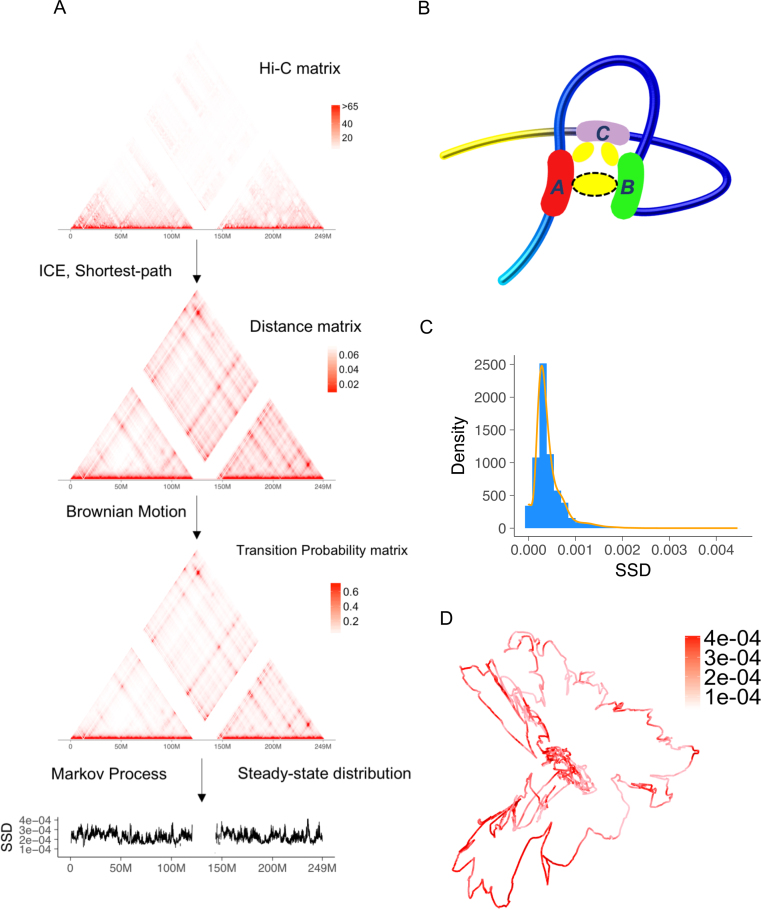
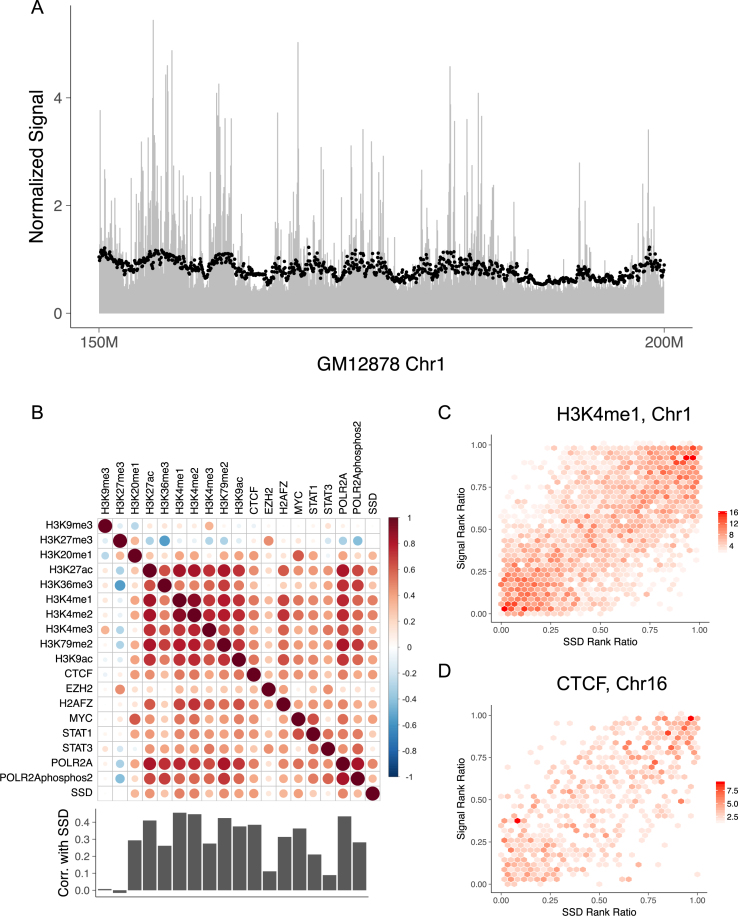
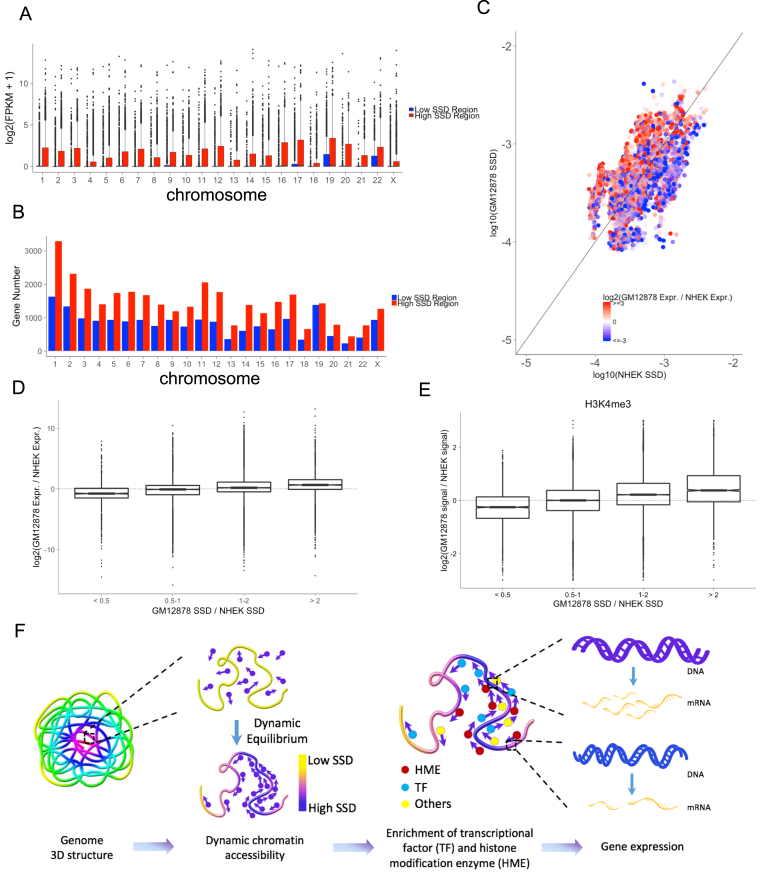
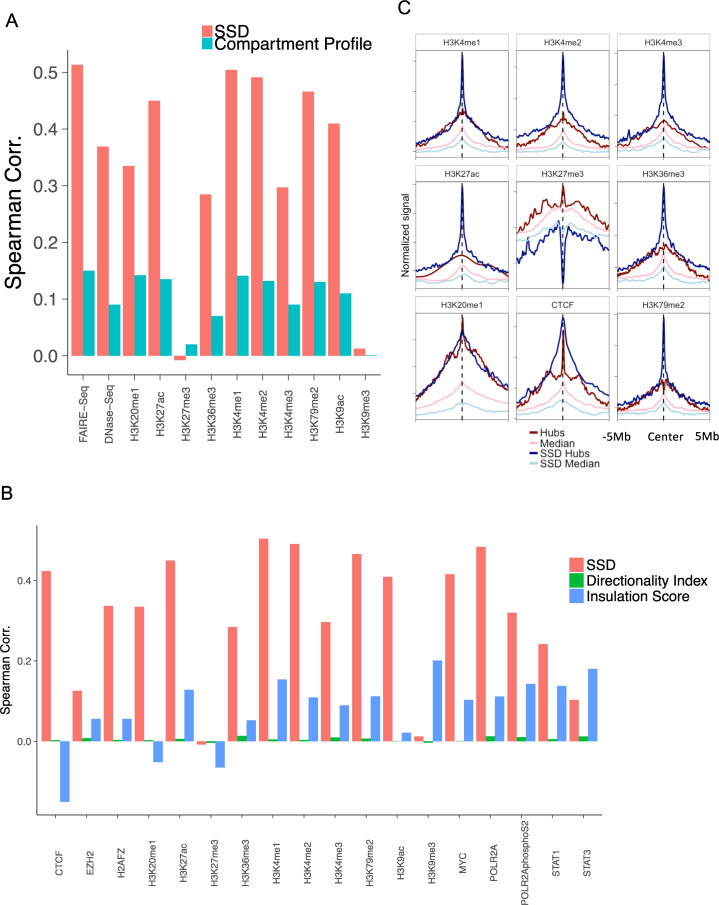
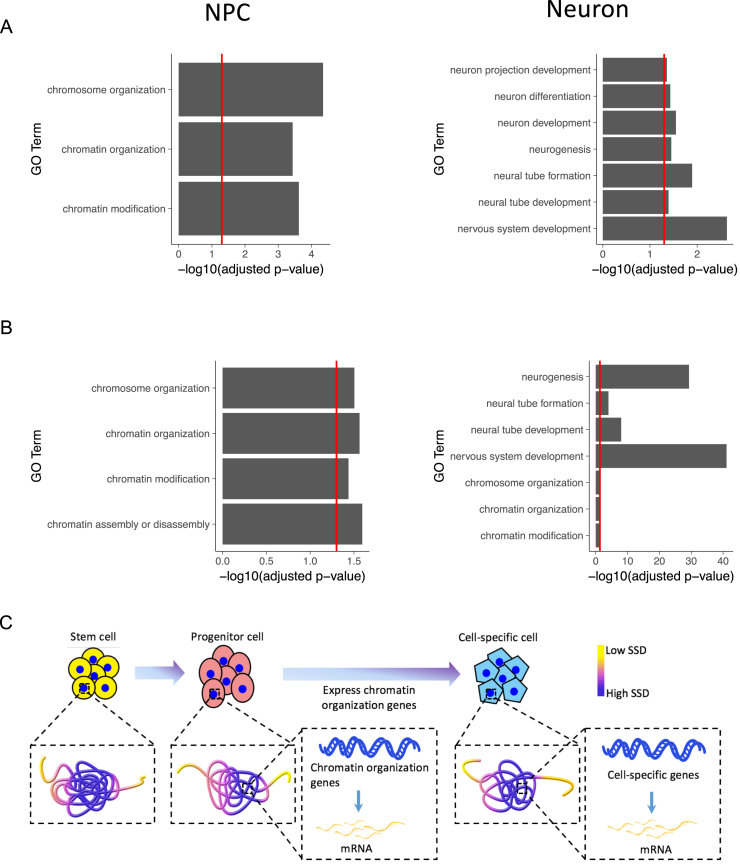
Chromatin three-dimensional (3D) structure plays critical roles in gene expression regulation by influencing locus interactions and accessibility of chromatin regions. Here we propose a Markov process model to derive a chromosomal equilibrium distribution of randomly-moving molecules as a functional consequence of spatially organized genome 3D structures. The model calculates steady-state distributions (SSD) from Hi-C data as quantitative measures of each chromatin region's dynamic accessibility for transcription factors and histone modification enzymes. Different from other Hi-C derived features such as compartment A/B and interaction hubs, or traditional methods measuring chromatin accessibility such as DNase-seq and FAIRE-seq, SSD considers both chromatin-chromatin and protein-chromatin interactions. Through our model, we find that SSD could capture the chromosomal equilibrium distributions of activation histone modifications and transcription factors. Compared with compartment A/B, SSD has higher correlations with the binding of these histone modifications and transcription factors. In addition, we find that genes located in high SSD regions tend to be expressed at higher level. Furthermore, we track the change of genome organization during stem cell differentiation, and propose a two-stage model to explain the dynamic change of SSD and gene expression during differentiation, where chromatin organization genes first gain chromatin accessibility and are expressed before lineage-specific genes do. We conclude that SSD is a novel and better measure of dynamic chromatin activity and accessibility.


Figures

Figure 1.
Figure 1.
Overview of Markov process model and steady-state distribution (SSD). (A) We use a public Hi-C dataset, the GM12878 cell line from Rao et al. (8) to illustrate the procedure. The input of model is Hi-C raw contact matrix. In the pre-processing step, the raw matrix is normalized and transformed to a distance matrix. Low coverage bins are removed after normalization. The distance matrix estimates relative spatial distances between two chromatin bins in the nucleus, accounting for physical distances captured by Hi-C cross-linking. Then the transition matrix is estimated and SSD is computed. (B) Advantage of shortest-path algorithm. Hi-C crosslinking could anchor region A and C, region B and C but not region A and B. As a result, although region A and B's spatial distance is close, the number of detected Hi-C interactions between A and B is underestimated and needs to be corrected by a shortest-path algorithm. (C) Density and histogram plot of GM12878 whole genome's SSD. (D) A 3D visualization of GM12878's chromosome 1 and SSD, both inferred from Hi-C data.
Figure 2.
Figure 2.
The distributions of histone modifications and DNA-binding proteins follow SSD. (A) ChIP-seq reads’ distribution along GM12878's chromosome 1. The chromosome is cut into 50 kb non-overlapping bins and RPM (reads per million) of H3K4me1 is computed for each bin to represent the mark's concentration. Black points represent SSD and are scaled for comparison. Only 150–200 Mb regions of chromosome 1 is shown. (B) Spearman correlation between ChIP-seq signals and SSD in 50 kb resolution for GM12878 using whole genome data. Bar plot shows Spearman correlation between SSD and ChIP-seq signals. (C) Hexbin plot showing the correlation between SSD and H3K4me1 signal on GM12878's chromosome 1. The color represents the density of points within each region. Rank ratio is defined as: (rank–min (rank))/(max (rank)–min (rank)). (D) Similar figure as Figure 2C using GM12878 chromosome 16, SSD and CTCF data.
Figure 3.
Figure 3.
SSD influences chromatin regions’ accessibility and transcriptional activity. (A) The comparison of expression levels of genes located in high and low SSD regions for each chromosome. For each chromosome, high SSD regions are defined as bins with SSD higher than the median SSD. Low SSD regions are the ones with SSD lower than the median SSD. (B) The number of genes located in high and low SSD regions. (C) Comparing SSD and gene expression levels between two cell lines, GM12878 and NHEK. Points colors represent the log2 fold change of GM12878 and NHEK's gene expression (FPKM). Points above the diagonal are the regions with higher SSD in GM12878 and under the diagonal are those with higher SSD in NHEK. (D) Relationship between SSD fold change and gene expression fold change comparing two cell lines. (E) Relationship between SSD fold change and H3K4me3 ChIP-seq signal fold change comparing two cell lines. (F) Model for how dynamic chromatin accessibility affects gene expression. Regions with high SSD are more accessible for histone modification enzymes and transcriptional factors, leading to higher transcriptional activity in these regions.
Figure 4.
Figure 4.
Comparing SSD with compartment profile and hub. (A) GM12878 SSD's and compartment score's Spearman correlations with ChIP-seq signals of histone modifications, FAIRE-seq and DNase-seq at the whole genome scale. (B) GM12878 SSD's, insulation score's and directionality index's Spearman correlations with ChIP-seq signals of histone modifications and DNA-binding proteins at the whole genome scale. (C) Comparing histone mark signatures between hubs and SSD hubs. X-axis represents the relative distance from hubs/median center (−5 to 5 Mb) and Y-axis represents averaged ChIP-seq signals.
Figure 5.
Figure 5.
Dynamic change of genome organization and gene expression during stem cell differentiation. (A) GO biological process enrichment for NPC's and Neuron's marker genes defined by SSD. (B) GO biological process enrichment for NPC's and Neuron's marker genes defined by expression level. In A and B, only selected terms are shown, and see Supplementary Table S1 for the full list. The red line indicates the position of –log10(0.05). (C) Model for the functional roles that genome 3D structure plays during stem cell differentiation. As stem cells differentiate, chromatin organization genes are first made accessible and transcribed at the progenitor stage, which help to open up the chromatin of lineage-specific genes when progenitor cells differentiate into downstream cell types.

References

    1. Lanctôt C., Cheutin T., Cremer M., Cavalli G., Cremer T.. Dynamic genome architecture in the nuclear space: regulation of gene expression in three dimensions. Nat. Rev. Genet. 2007; 8:104–115. - PubMed
    1. Gibcus J.H., Dekker J.. The hierarchy of the 3D genome. Mol. Cell. 2013; 49:773–782. - PMC - PubMed
    1. Cohen B.A., Mitra R.D., Hughes J.D., Church G.M.. A computational analysis of whole-genome expression data reveals chromosomal domains of gene expression. Nat. Genet. 2000; 26:183–186. - PubMed
    1. Jin F., Li Y., Dixon J.R., Selvaraj S., Ye Z., Lee A.Y., Yen C.-A., Schmitt A.D., Espinoza C.A., Ren B.. A high-resolution map of the three-dimensional chromatin interactome in human cells. Nature. 2013; 503:290–294. - PMC - PubMed
    1. Dostie J., Richmond T.A., Arnaout R.A., Selzer R.R., Lee W.L., Honan T.A., Rubio E.D., Krumm A., Lamb J., Nusbaum C. et al. . Chromosome Conformation Capture Carbon Copy (5C): a massively parallel solution for mapping interactions between genomic elements. Genome Res. 2006; 16:1299–1309. - PMC - PubMed

MeSH terms

LinkOut - more resources