. 2017 Feb 17;45(3):e15.
doi: 10.1093/nar/gkw907.

Analysis of translation using polysome profiling

Affiliations

Analysis of translation using polysome profiling

Héloïse Chassé et al. Nucleic Acids Res. .

Abstract

During the past decade, there has been growing interest in the role of translational regulation of gene expression in many organisms. Polysome profiling has been developed to infer the translational status of a specific mRNA species or to analyze the translatome, i.e. the subset of mRNAs actively translated in a cell. Polysome profiling is especially suitable for emergent model organisms for which genomic data are limited. In this paper, we describe an optimized protocol for the purification of sea urchin polysomes and highlight the critical steps involved in polysome purification. We applied this protocol to obtain experimental results on translational regulation of mRNAs following fertilization. Our protocol should prove useful for integrating the study of the role of translational regulation in gene regulatory networks in any biological model. In addition, we demonstrate how to carry out high-throughput processing of polysome gradient fractions, for the simultaneous screening of multiple biological conditions and large-scale preparation of samples for next-generation sequencing.


Figures

Figure 1.
Figure 1.
Overview of the polysome profiling protocol to analyze translation activity. The various steps of the protocol involve (1) cell lysis, (2) sucrose-gradient centrifugation and (3) fractionation, (4) RNA extraction and RNA integrity check, (5) analysis of translational status of mRNAs. See the text for details.
Figure 2.
Figure 2.
RNA quality with different conditions for lysis of sea urchin eggs. Lysis was done using a 25G needle (A–E) or a Dounce homogenizer (F–J), on frozen eggs (A) or fresh eggs (B–J). The same volume (V) of eggs was lysed in increasing volumes of lysis buffer ranging from 2:1 to 1:4 (B–E). An additional wash with filtered seawater FSW (G) or Ca2+-free SW (H) was tested before lysis. Lysis buffer contained either 1 mM EDTA (F) or 25 mM EGTA (I and J). Two RNA quantities prepared using the optimized protocol showed only the 28S and 18S RNA without degradation products (lane I: 250 ng; lane J: 1 μg). RNAs from each lysate were obtained after an acid phenol–chloroform extraction, and separated on a 2% agarose-TBE gel to check for integrity.
Figure 3.
Figure 3.
(A) Polysome gradient profile during early development. Optical density profiles (ODA254) of polysome gradient profiles are shown, corresponding to unfertilized eggs (UnF), 1 h post-fertilization embryos (F) and late-blastula stage embryos 30 h post-fertilization (Blastula). The areas under the curve (AUC) of polysomes and monosomes were measured, and the polysome:monosome ratio was then calculated for the three developmental stages; error bars represent SEM and statistics were done using Student's t-test (P-value < 0.01). (B–E) Polysome gradient profiles and corresponding RNA profiles after treatment with polysome disrupters. Optical density profiles and extracted RNAs from polysome gradients of fertilized eggs (B), treated with 30 mM EDTA (C), 2 mM puromycin in vitro (D) and 0.6 mM puromycin in vivo (E) are shown. The RNAs from each fractions of polysome gradient were separated on 2% agarose-TBE gels.
Figure 4.
Figure 4.
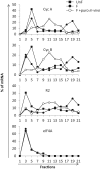
mRNAs coding for cyclin A, cyclin B and the small subunit of ribonucleotide reductase (R2) are actively translated, whereas eIF4A mRNA is not translated after fertilization in sea urchin. mRNAs were detected by RT-PCR amplification in each fraction of the polysome gradient from unfertilized eggs (UnF), 1 h post-fertilization embryos (F) or embryos in presence of puromycin in vivo (F+puro in vivo). Amplicons were run on agarose gels, quantified using Image J software, distribution is shown along the gradient as a percentage of total mRNA. Fraction #1 corresponds to the top of the gradient (free mRNAs) and #21 corresponds to the bottom of the gradient. Translated mRNAs are associated with the heavy polysomal fractions (from fraction 17 to 21). Figure 4 is a representative result of six independent experiments.

References

    1. Jackson R.J., Hellen C.U., Pestova T. V. The mechanism of eukaryotic translation initiation and principles of its regulation. Nat. Rev. Mol. Cell Biol. 2010; 11:113–127. - PMC - PubMed
    1. Hershey J.W.B., Sonenberg N., Mathews M.B.. Principles of translational control: an overview. Cold Spring Harb. Perspect. Biol. 2012; 4:1–10. - PMC - PubMed
    1. Schwanhäusser B., Busse D., Li N., Dittmar G., Schuchhardt J., Wolf J., Chen W., Selbach M.. Global quantification of mammalian gene expression control. Nature. 2011; 473:337–342. - PubMed
    1. Wang T., Cui Y., Jin J., Guo J., Wang G., Yin X., He Q.-Y., Zhang G.. Translating mRNAs strongly correlate to proteins in a multivariate manner and their translation ratios are phenotype specific. Nucleic Acids Res. 2013; 41:4743–4754. - PMC - PubMed
    1. Vogel C., Marcotte E.M.. Insights into the regulation of protein abundance from proteomic and transcriptomic analyses. Nat. Rev. Genet. 2012; 13:227–232. - PMC - PubMed

Publication types