. 2017 Feb 9:8:14385.
doi: 10.1038/ncomms14385.

Small genomic insertions form enhancers that misregulate oncogenes

Affiliations

Small genomic insertions form enhancers that misregulate oncogenes

Brian J Abraham et al. Nat Commun. .

Erratum in

Abstract

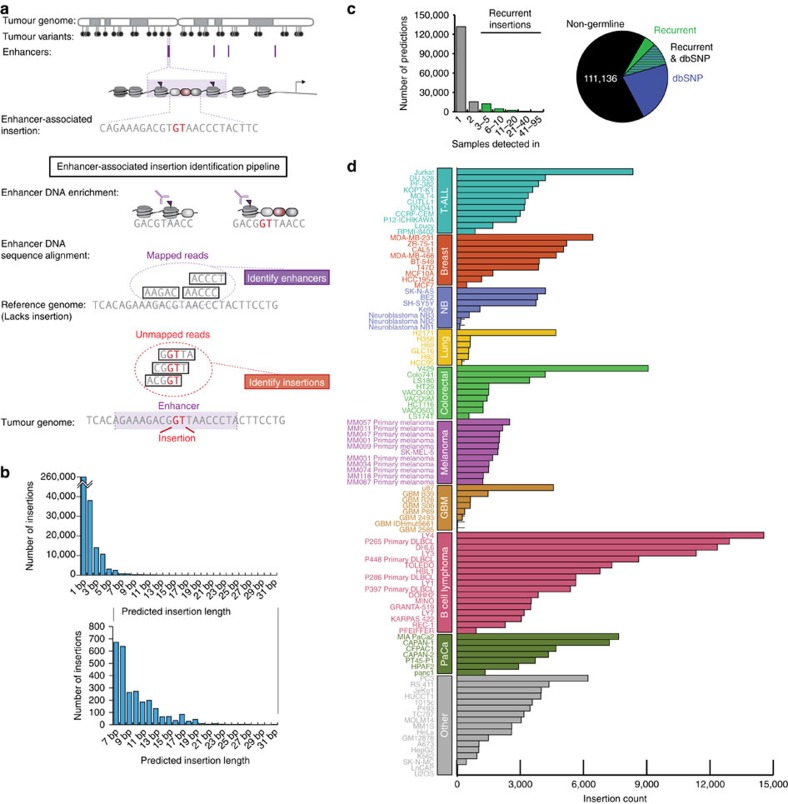
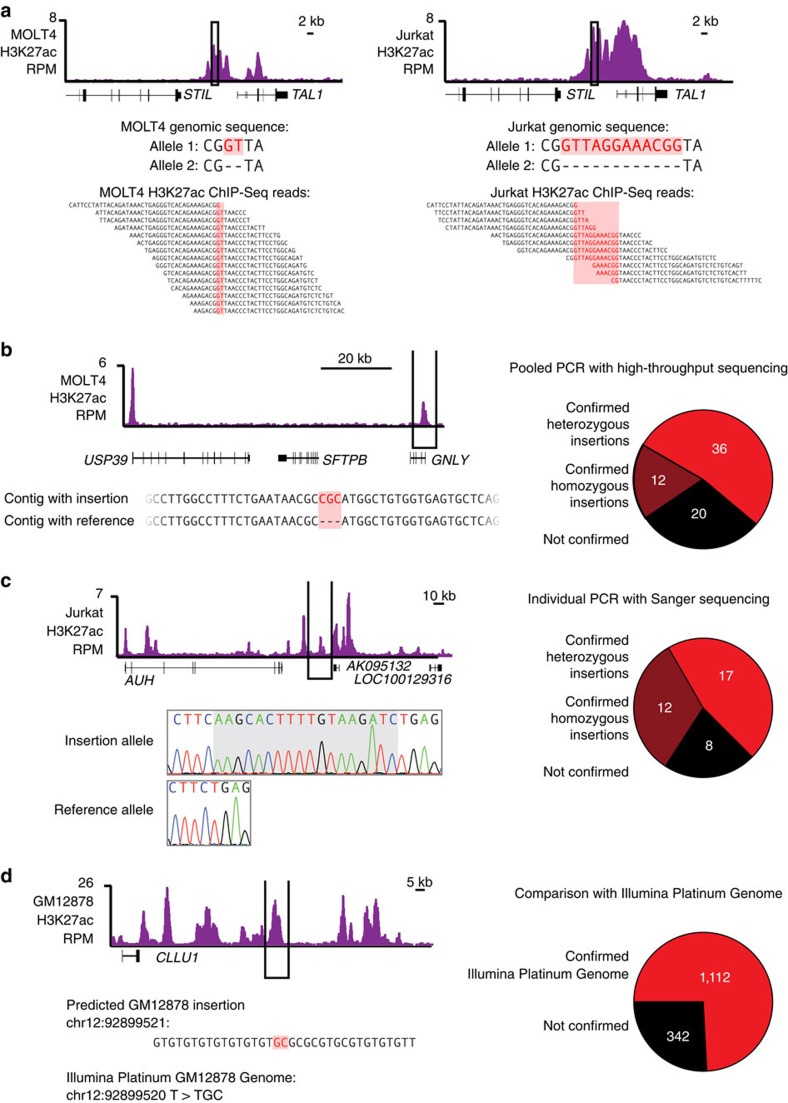
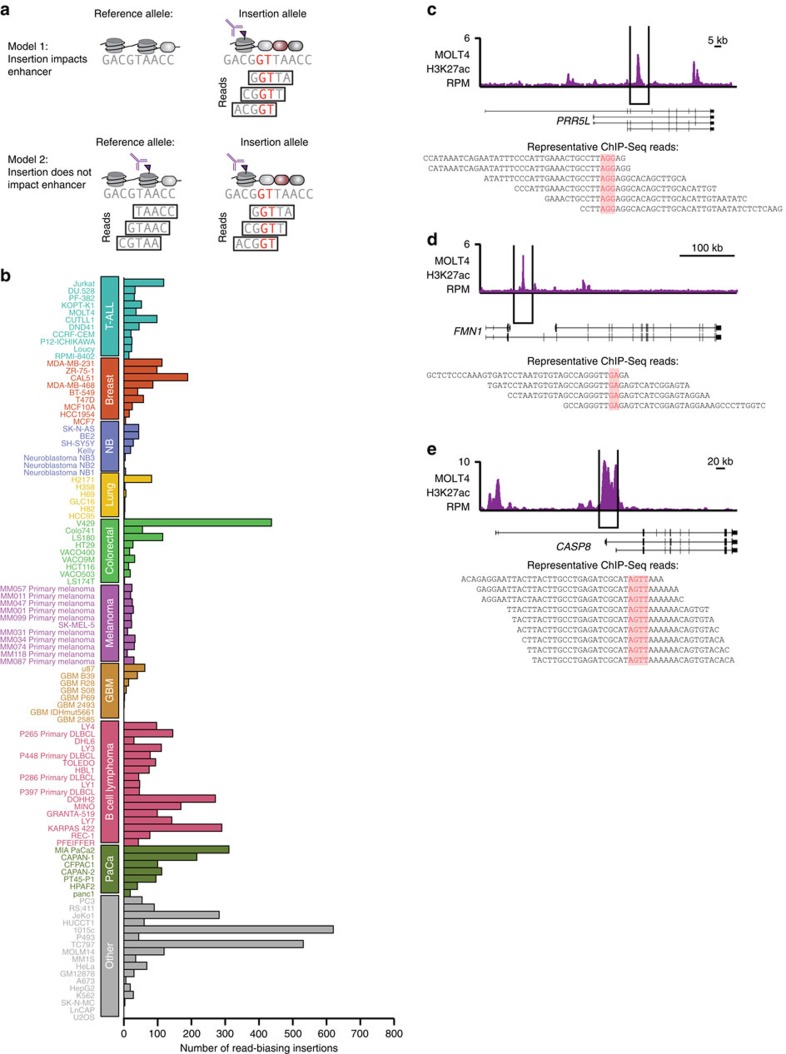
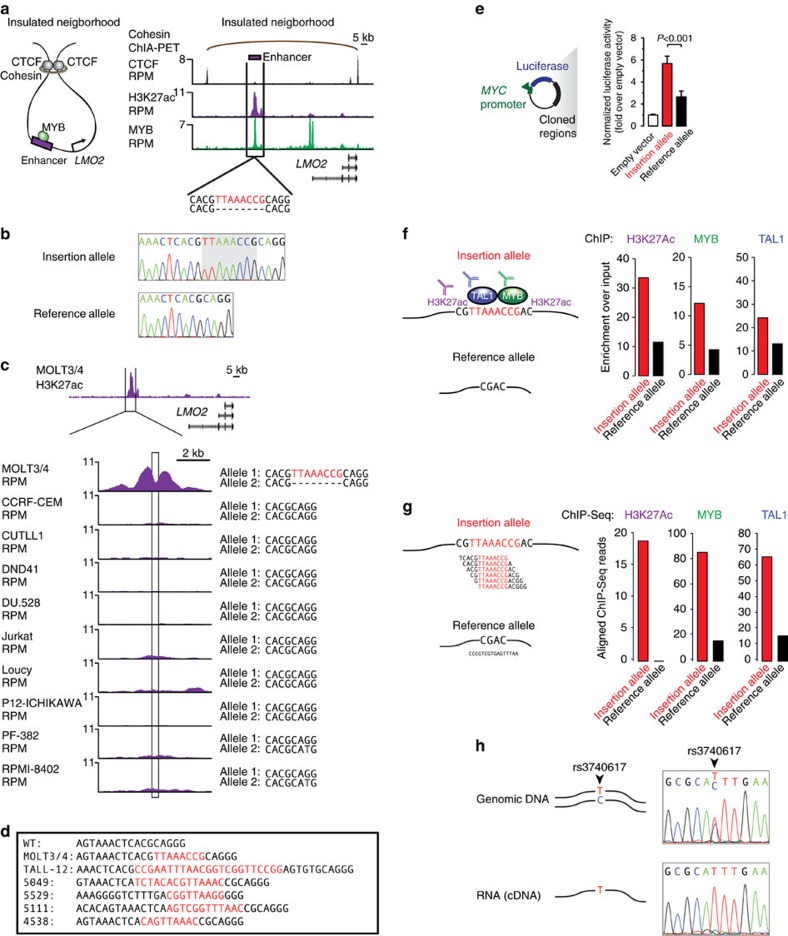
The non-coding regions of tumour cell genomes harbour a considerable fraction of total DNA sequence variation, but the functional contribution of these variants to tumorigenesis is ill-defined. Among these non-coding variants, somatic insertions are among the least well characterized due to challenges with interpreting short-read DNA sequences. Here, using a combination of Chip-seq to enrich enhancer DNA and a computational approach with multiple DNA alignment procedures, we identify enhancer-associated small insertion variants. Among the 102 tumour cell genomes we analyse, small insertions are frequently observed in enhancer DNA sequences near known oncogenes. Further study of one insertion, somatically acquired in primary leukaemia tumour genomes, reveals that it nucleates formation of an active enhancer that drives expression of the LMO2 oncogene. The approach described here to identify enhancer-associated small insertion variants provides a foundation for further study of these abnormalities across human cancers.


Conflict of interest statement

The authors declare no competing financial interests.

Figures

Figure 1
Figure 1. Genome-wide identification of enhancer-associated insertions.
(a) A subset of variants in tumour genomes occurs within and impacts transcriptional enhancers. ChIP-Seq experiments enrich for enhancer DNA, which may contain either reference sequences or homozygous or heterozygous variants, including insertions. Histone modifications of chromatin surround the DNA where a small insertion (red) creates a transcription factor-binding event, and this sequence is detected in the reads created in the ChIP-Seq experiment. A commonly used sequence alignment algorithm attempts to map reads to the reference genome but discards reads with insertions. Mining these initially discarded reads uncovers enhancer-associated insertions. (b) Genome-wide distribution of sizes of insertions predicted by our ChIP-Seq computational pipeline in 102 samples. The majority of insertions are 1 bp. (c) Left: Histogram showing number of samples in which an insertion is predicted. Insertions predicted in more than two samples (same location, same sequence) are considered separately because they may represent germline polymorphisms in the reference genome. Right: Pie chart depicting proportion of predicted enhancer-associated insertions present in dbSNP, predicted in many samples, or both, suggesting that these variants are acquired in the germline. (d) Counts of enhancer-associated insertions predicted by the pipeline processing each H3K27ac sample. Samples are grouped according to tumour type: GBM, Glioblastoma Multiforme; NB, Neuroblastoma; PaCa, Pancreatic cancer; T-ALL, T cell acute lymphoblastic leukaemia.
Figure 2
Figure 2. Confirmation of predictions in the catalogue.
(a) Our computational pipeline recovered the known TAL1-proximal insertion in the MOLT4 and Jurkat T-ALL genomes. The insertions CG[GT]TA in MOLT4, and CG[GTTAGGAAACGG]TA noted in red, upstream of the TAL1 gene are bound by H3K27 acetylated histones. This region was immunoprecipitated in ChIP-Seq experiments targeting acetylated H3K27, and sequence reads from this experiment contain the insertion and surrounding genomic context. (b) Left: Example enhancer-associated insertion in MOLT4 T-ALL cells that was confirmed by high-throughput sequencing pooled PCR products. Number of H3K27ac ChIP-Seq reads in bins at the USP39/SFTPB/GNLY locus is represented in purple. Annotated RefSeq genes are noted below. Representative contigs detected in the high-throughput sequencing that contain reference sequence and the predicted insertion, suggesting this insertion is heterozygous. The insertion is noted in red. Note that scaffolds were aligned to the negative strand, so insertion predicted was GCG but insertion in scaffold is GCG. Right: Pie chart summarizing numbers of predicted insertions detected using this approach. (c) Left: Example enhancer-associated insertion in Jurkat T-ALL cells that was confirmed by Sanger sequencing of PCR products. Number of H3K27ac ChIP-Seq reads in bins at the AUH locus is represented in purple. Annotated RefSeq genes are noted below. Chromatograms of Sanger sequencing of this locus are below. Chromatograms show the signal from each of four possible nucleotides at a position. Sequences of the insertions are indicated with a grey box. Right: Pie chart summarizing numbers of predicted insertions detected using this approach. (d) Left: Example enhancer-associated insertion in GM12878 B lymphoblastoid cells that was confirmed by the Illumina Platinum genome of these cells. Number of H3K27ac ChIP-Seq reads in bins at the CLLU1 locus is represented in purple. The predicted insertion in genomic context is noted below in red. The Illumina-identified variant is below. Right: Pie chart summarizing numbers of predicted insertions detected using this approach.
Figure 3
Figure 3. A subset of enhancer-associated insertions is predicted to alter enhancer activity.
(a) Cartoon depicting two plausible models of the effect of insertions on enhancers. If insertions do affect enhancers, there should be more ChIP-Seq reads for enhancer-binding proteins that contain the insertion than do not. (b) Counts of predicted enhancer-associated insertions in all tested samples that bias ChIP-Seq read mapping and thus are likely associated with altered enhancer activity. (ce) Example enhancer-associated insertions that are predicted to alter enhancer activity. Counts of ChIP-Seq reads for H3K27ac are displayed in purple. RefSeq gene positions are noted below. ChIP-Seq reads containing the predicted insertion are noted below. The insertion is noted in red.
Figure 4
Figure 4. A confirmed insertion alters the regulation of a T-ALL oncogene.
(a) Insertion near LMO2 in MOLT4 T cell acute lymphoblastic leukaemia cells. (Left) representation of an insulated neighbourhood, which is a loop between distal CTCF- and cohesin-bound sites. The MYB-bound LMO2 enhancer and LMO2 gene are within the neighbourhood. (Right) An insulated neighbourhood defined in Jurkat T-ALL cells connecting CTCF-bound sites encompasses LMO2 and its enhancer. Tracks of H3K27ac and MYB ChIP-Seq signal at the LMO2 locus with predicted insertion in the MOLT4 genome and protein-coding oncogene below. Region containing the insertion is indicated in black. Inserted sequence is in red. Scale bar represents 5,000 bases. (b) Sanger sequencing chromatograms of MOLT4 alleles separately cloned from the heterozygous insertion in the LMO2 enhancer. (c) ChIP-Seq signal at the LMO2 enhancer across 10 T-ALL samples. The sequence at the LMO2 enhancer-associated insertion is noted. The KOPT-K1 genome contains a translocation near LMO2 and was not included in the display. Scale bar represents 2,000 bases. (d) Patient genomes contain insertions at the LMO2 enhancer locus, noted in red. (e) Enhancer activity of the luciferase reporter is significantly higher for the region containing the insertion allele compared to the region not containing the insertion allele (P<0.001, two-tailed Student's t-test). The mean is plotted, and error bars indicate s.d. from four replicates. (f) Allele-specific ChIP-qPCR bar charts showing quantitative H3K27ac, TAL1 and MYB binding at the region containing the insertion; the allele with the insertion is preferentially bound by all three. ChIP-qPCR was performed for each of the three factors with primers that include or exclude the insertion. Enrichment over input DNA (ΔΔcT) is plotted. (g) ChIP-Seq reads for H3K27ac, TAL1, and MYB preferentially aligned to reference sequences containing the LMO2-proximal insertion. Counts of reads aligning to an insertion-including reference (red) and insertion-excluding reference (black) are displayed as barplots. (h) Sanger sequencing chromatograms of gDNA and cDNA show that the LMO2 gene is expressed from one allele in MOLT4 cells. (top) A coding SNP in LMO2 is confirmed to be heterozygous by sequencing genomic DNA in an LMO2 exon (gDNA). (bottom) Sanger sequencing of cDNA reverse-transcribed from mRNA shows only one heterozygous LMO2 allele is transcribed.

References

    1. Pleasance E. D. et al. A comprehensive catalogue of somatic mutations from a human cancer genome. Nature 463, 191–196 (2010). - PMC - PubMed
    1. Forbes S. A. et al. COSMIC: exploring the world's knowledge of somatic mutations in human cancer. Nucleic Acids Res. 43, D805–D811 (2015). - PMC - PubMed
    1. Stratton M. R., Campbell P. J. & Futreal P. A. The cancer genome. Nature 458, 719–724 (2009). - PMC - PubMed
    1. Garraway L. A. & Lander E. S. Lessons from the cancer genome. Cell 153, 17–37 (2013). - PubMed
    1. Vogelstein B. et al. Cancer genome landscapes. Science 339, 1546–1558 (2013). - PMC - PubMed

Publication types