. 2017 Feb 9:7:41962.
doi: 10.1038/srep41962.

PARP-1/PARP-2 double deficiency in mouse T cells results in faulty immune responses and T lymphomas

Affiliations

PARP-1/PARP-2 double deficiency in mouse T cells results in faulty immune responses and T lymphomas

Judith Navarro et al. Sci Rep. .

Abstract

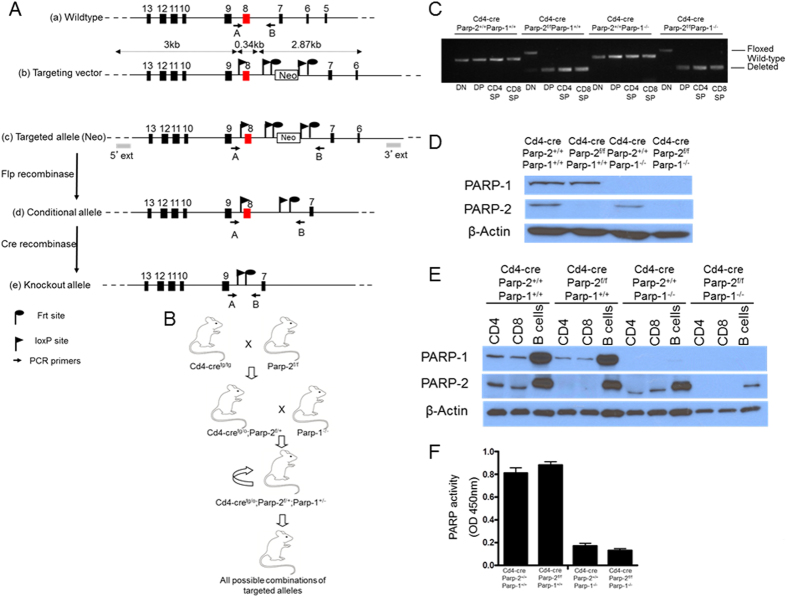
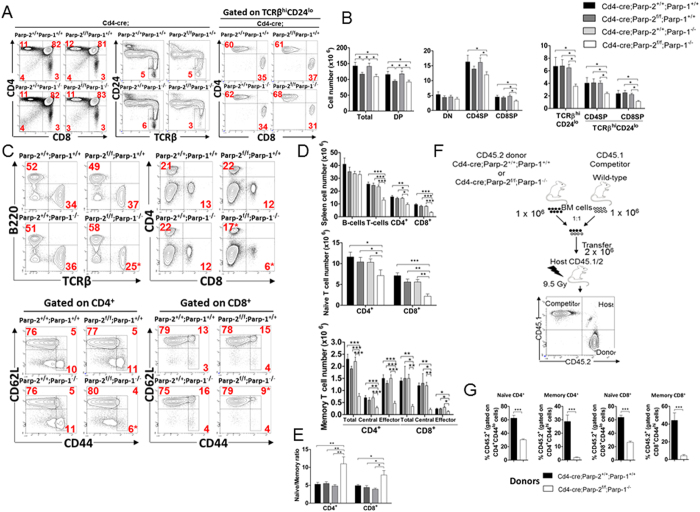
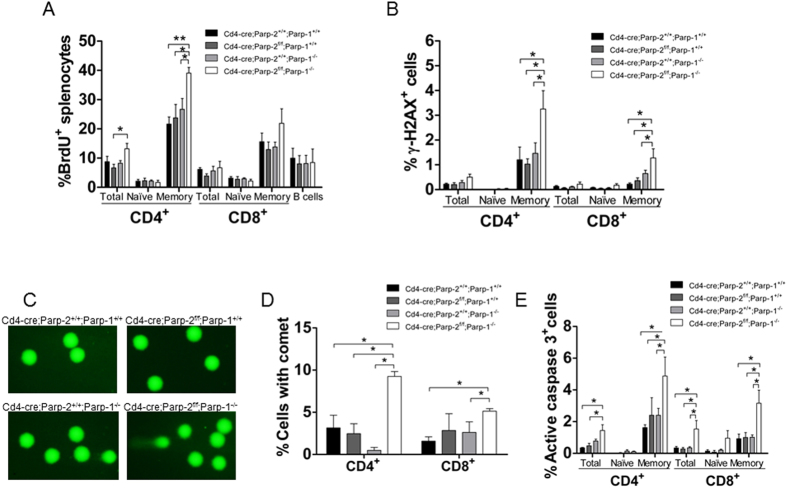
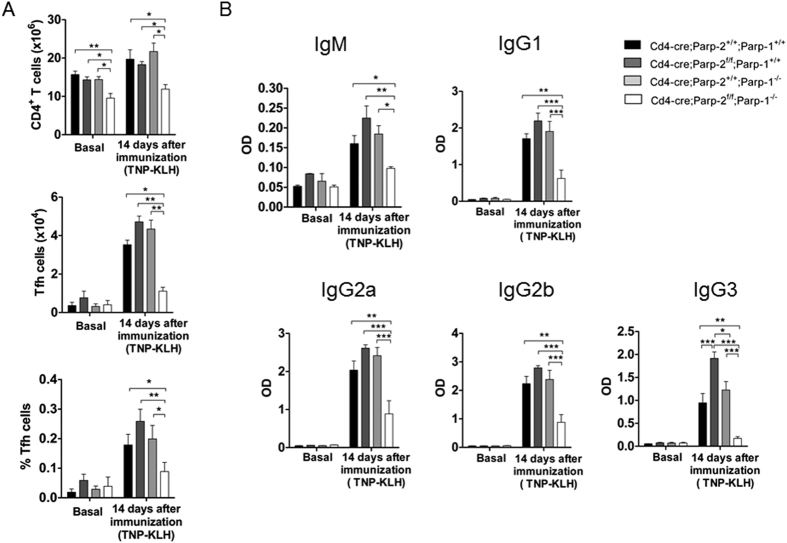
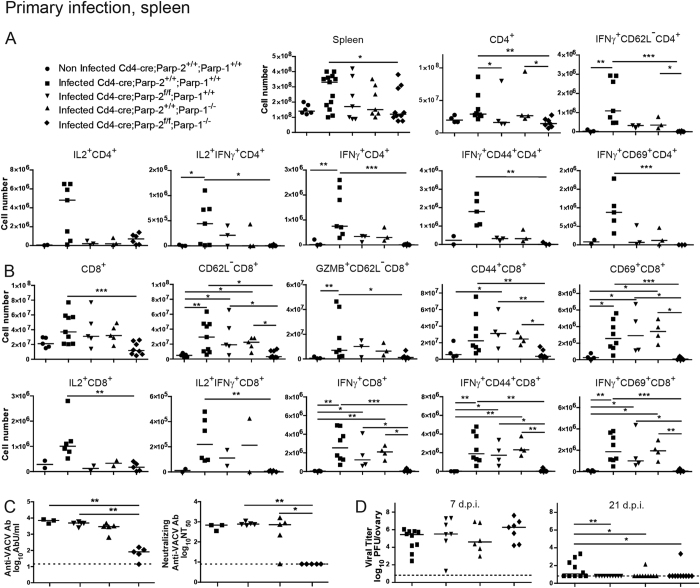
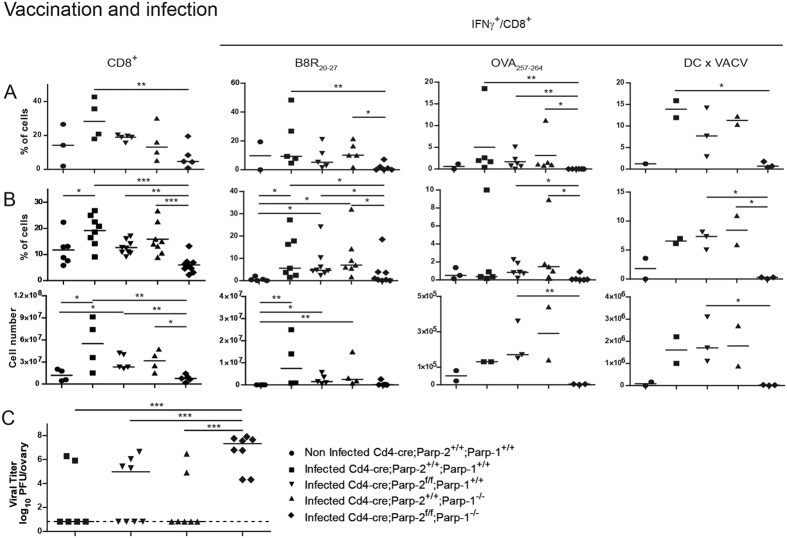
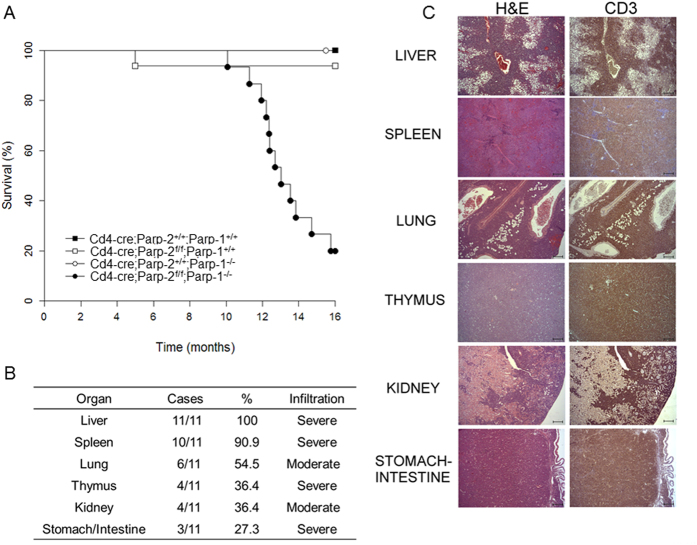
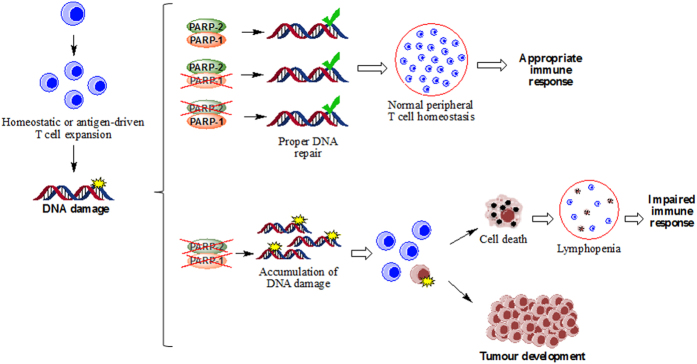
The maintenance of T-cell homeostasis must be tightly regulated. Here, we have identified a coordinated role of Poly(ADP-ribose) polymerase-1 (PARP-1) and PARP-2 in maintaining T-lymphocyte number and function. Mice bearing a T-cell specific deficiency of PARP-2 in a PARP-1-deficient background showed defective thymocyte maturation and diminished numbers of peripheral CD4+ and CD8+ T-cells. Meanwhile, peripheral T-cell number was not affected in single PARP-1 or PARP-2-deficient mice. T-cell lymphopenia was associated with dampened in vivo immune responses to synthetic T-dependent antigens and virus, increased DNA damage and T-cell death. Moreover, double-deficiency in PARP-1/PARP-2 in T-cells led to highly aggressive T-cell lymphomas with long latency. Our findings establish a coordinated role of PARP-1 and PARP-2 in T-cell homeostasis that might impact on the development of PARP-centred therapies.


Conflict of interest statement

The authors declare no competing financial interests.

Figures

Figure 1
Figure 1. Generation of mice with a T-cell-specific deletion of PARP-2 in a PARP-1-deficient background.
(A) Schematic representation of (a) the wild-type allele of the mouse Parp-2 gene and the location of the genotyping primers A and B; (b, c) the structure of the correctly targeted allele with the introduced neomycin resistance cassette and loxP and FRT sites, and the locations of genotyping primers; (d) the conditional allele (flox) produced by Flp-enhanced recombinase-mediated recombination of FRT sites flanking Neo and the locations of genotyping primers; and (e) the deleted allele produced by cre recombination of loxP sites surrounding exon 8 and the locations of genotyping primers. (B) Schematic representation of the cross-breeding performed to generate mice with a T-cell-specific deletion of PARP-2 in a PARP-1-deficient background. Parp-2 floxed (Parp-2f/f) mice were crossed with Cd4-cre-transgenic mice, producing heterozygous offspring that were then crossed with Parp-1−/− mice. Cd4-cretg/o;Parp-2f/+;Parp-1+/− mice were subsequently intercrossed, producing all possible combinations of Parp-2, Parp-1 and Cd4-cre targeted alleles. (C) PCR analysis from genomic DNA in thymic double-negative (DN: CD4CD8), double-positive (DP: CD4+CD8+), CD4SP (CD4+CD8), and CD8SP (CD4CD8+) sorted subsets from Cd4-cre;Parp-2+/+;Parp-1+/+, Cd4-cre;Parp-2f/f;Parp-1+/+, Cd4-cre;Parp-2+/+;Parp-1−/−, and Cd4-cre;Parp-2f/f;Parp-1−/− mice. (D) Western-blot analysis of PARP-1 and PARP-2 protein expression in sorted DP thymocytes and (E) in sorted CD4+, CD8+, and B-cells from spleen. (F) PARP activity in protein extracts from spleen T-cells after in vitro activation with anti-CD3 + anti-CD28. Resting T-cells were isolated from spleen, cultured 14 h in the presence of anti-CD3 + anti-CD28 monoclonal antibodies, lysed and PARP activity determined in protein extracts. Results represent the mean ± SEM of a representative experiment from two independent experiments carried out in triplicate.
Figure 2
Figure 2. T-cell specific deletion of PARP-2 in a PARP-1-deficient background impairs T-cell homeostasis.
(A) Representative dot-plots of CD4, CD8, TCRβ, and CD24 expression in thymocytes from 8 to 10-week-old mice of the indicated genotypes. Percentage of cells in the individual subpopulations is indicated in each quadrant. (B) Graph showing the absolute number of thymocytes in each population. (C) Representative dot-plots of TCRβ, B220, CD4, CD8, CD44 and CD62L expression in splenocytes of the indicated genotypes. Percentage of cells in the individual subpopulations is indicated in each quadrant. (D) Graph showing the absolute number of splenocytes in each population. Naïve, CD62L+ CD44lo; central memory, CD62L+ CD44hi; effector memory, CD62LCD44hi. (E) Naïve/memory T-cell ratio in spleen. (F) Scheme describing the strategy for the generation of mixed bone marrow chimeras. Reconstituted cells were analyzed 10 weeks after transplantation. (G) Graph showing the frequency of CD45.2+ -expressing cells in spleen populations. Values represent the mean ± SEM of at least 8 mice of each genotype. *P < 0.05; **P < 0.01; ***P < 0.001.
Figure 3
Figure 3. Effect of PARP-1/PARP-2 double deficiency on T-cell proliferation, DNA damage and apoptosis.
(A) In vivo proliferation of T-cell subsets. Eight-to-ten-week-old mice were i.p. injected with BrdU at 24 and 12 h before sacrifice. Cell suspensions from spleen were stained with anti-CD4, anti-CD8, anti-CD62L, anti-CD44 and anti-B220 to identify cell subsets, with anti-BrdU to identify cells synthesizing DNA and with DAPI to stain for the total DNA content in the cells. BrdU incorporation in each population was analysed by flow cytometry. Bars represent the mean ± SEM values of the percentage of BrdU+ cells. (B) Graph showing the mean ± SEM values of the percentage of γH2AX+ cells in each T-cell subset, determined by flow cytometry. (C) Representative image showing DNA damage in CD4+ splenic T-cells derived from mice of the indicated genotypes, visualized by the alkaline comet assay. (D) Graph showing the percentage of T-cells with comet. An average of 100 cells was scored from each mouse. (E) Graph showing the percentage of active caspase-3-positive T-cell in each subsets, determined by flow cytometry. Bars represent the mean ± SEM values obtained from at least 6 mice per genotype from two independent experiments. *P < 0.05; **P < 0.01; ***P < 0.001.
Figure 4
Figure 4. Mice carrying a T-cell specific deletion of PARP-2 in a PARP-1-deficient background display defects in specific antibody response to T-dependent antigens.
Ten-to-twelve-week-old Cd4-cre;Parp-2+/+;Parp-1+/+, Cd4-cre;Parp-2f/f;Parp-1+/+, Cd4-cre;Parp-2+/+;Parp-1−/−, and Cd4-cre;Parp-2f/f;Parp-1−/− mice were i.p. injected with the T-dependent antigen TNP-KLH and sigma-system adjuvant. (A) Tfh cell development is impaired in Cd4-cre;Parp-2f/f;Parp-1−/− mice. Spleen samples from no-immunized mice and fourteen days after immunization, were collected and cells were counted and stained to detect by flow cytometry total CD4+ T-cells and Tfh cells (CD4+CXCR5+ PD1+ ICOS+). Graph showing the number of CD4+ and number and percentage of Tfh cells. (B) Serum was collected at the indicated time point, and TNP-specific IgM, IgG1, IgG2a, IgG2b and IgG3 were assayed by ELISA. Bars represent the mean ± SEM values of at least 7 mice of each genotype. *P < 0.05; **P < 0.01; ***P < 0.001.
Figure 5
Figure 5. Primary cellular and humoral immune response in splenocytes following vaccinia virus infection.
Mice of the indicated genotypes were infected with VACV-flOVA and 7-9 days later spleens were extracted. (A) Flow cytometry analysis of activation molecules (CD44, CD69, CD62L) and effector molecules (IL2, IFNγ) (alone or combined) in the CD4+ cell population following ex vivo incubation with VACV-infected dendritic cells. (B) Analysis of activation molecules (CD44, CD69, CD62L) and effector molecules (GZMB, IL2, IFNγ) (alone or combined) in CD8+ cells following ex vivo incubation with B8R20-27 peptide. (C) Mice were infected with VACV-flOVA and 21 days later serum was extracted and inactivated. Antibodies anti-VACV (left panel) were determined using ELISA and titers were expressed in antibody units (AbU)/mL. Neutralizing antibodies anti-VACV (right panel) were assessed by plaque assay and the neutralizing titer 50% (NT50) was determined. Detection limit is indicated by the dashed line. Dots represent individual mice and horizontal lines represent median values of cell numbers or antibody titers for each genotype. (D) VACV replication in vivo. Mice were infected with VACV-flOVA and 7 or 21 days later ovaries were extracted and virus titrated. Dots represent individual ovary titers and horizontal lines represent median values. Detection limit is indicated by the dashed line. *P < 0.05; **P < 0.01; ***P < 0.001.
Figure 6
Figure 6. Secondary cellular immune response following vaccinia virus infection of vaccinated animals.
Mice were vaccinated with BMDCs loaded with MHC class I-restricted B8R20-27 and OVA257-264 peptides and infected 9-21 days later with VACV-flOVA. Peritoneal cells (A) and splenocytes (B) were extracted 5 days later and cells were incubated ex vivo with B8R20-27 or OVA257-264 peptides or with VACV-flOVA-infected DC, as indicated. IFNγ production was measured in CD8+ cells by flow cytometry. Dots represent individual mice and horizontal lines represent median values for each genotype. (C) Ovaries were extracted and virus titrated. Dots represent mean ovary virus titres of each animal and horizontal lines represent median values for each genotype. Detection limit is indicated by the dashed line. *P < 0.05; **P < 0.01; ***P < 0.001.
Figure 7
Figure 7. T-cell specific deletion of PARP-2 in a PARP-1-deficient background leads to death of mice with T-cell lymphomas.
(A) Kaplan-Meier survival curves for Cd4-cre;Parp-2+/+;Parp-1+/+(n = 9), Cd4-cre;Parp-2f/f;Parp-1+/+(n = 16), Cd4-cre;Parp-2+/+;Parp-1−/− (n = 8), and Cd4-cre;Parp-2f/f;Parp-1−/− (n = 15) mice. Percent survival is plotted as a function of time in months. The difference in survival between Cd4-cre;Parp-2f/f;Parp-1−/− and the other three genotypes was highly significant (p < 0.001) by log-rank test. (B) Summary of organs with highly invasive T-cell lymphoma cells. For evaluation of the infiltrative degree of tumors, a semi-quantitative scale comprising 4 grades was used: 0 (no infiltration), 1 (mild infiltration), 2 (moderate infiltration) and 3 (severe infiltration). The overall infiltrative value of each organ was established by calculation of the mean of all values obtained. (C) Hematoxylin and eosin (left panel) and anti-CD3 (right panel) staining of fixed tissue sections reveal that mortality of Cd4-cre;Parp-2f/f;Parp-1−/− mice is due to T-cell lymphomas. Scale bar: 0.2 mm.
Figure 8
Figure 8. Model for T-cell lymphopenia, impaired immune response and development of T-cell lymphomas in mice harbouring a double deficiency of PARP-1 and PARP-2 in T-cells.
We propose that DNA damage that arises following DNA replication during T-cell expansion can be repaired appropriately in cells lacking either PARP-1 or PARP-2. However, in doubly deficient T-cells, damage accumulates leading to cell death, lymphopenia and an impaired immune response, or to genetic lesions that can promote increased tumor development.

References

    1. Rothenberg E. V. & Taghon T. Molecular genetics of T cell development. Annu. Rev. Immunol. 23, 601–649 (2005). - PubMed
    1. Grossman Z. & Paul W. E. Dynamic tuning of lymphocytes: physiological basis, mechanisms, and function. Annu. Rev. Immunol. 33, 677–713 (2015). - PubMed
    1. Surh C. D. & Sprent J. Homeostasis of naive and memory T cells. Immunity. 29, 848–862 (2008). - PubMed
    1. Baek K. H. et al.. p53 deficiency and defective mitotic checkpoint in proliferating T lymphocytes increase chromosomal instability through aberrant exit from mitotic arrest. J. Leukoc. Biol. 73, 850–861 (2003). - PubMed
    1. Prochazkova J. et al.. DNA Repair Cofactors ATMIN and NBS1 Are Required to Suppress T Cell Activation. PLoS. Genet. 11, e1005645 (2015). - PMC - PubMed

Publication types

Substances