

Genome-wide association study for performance traits in chickens using genotype by sequencing approach
- PMID: 28181508
- PMCID: PMC5299454
- DOI: 10.1038/srep41748
Genome-wide association study for performance traits in chickens using genotype by sequencing approach
Abstract
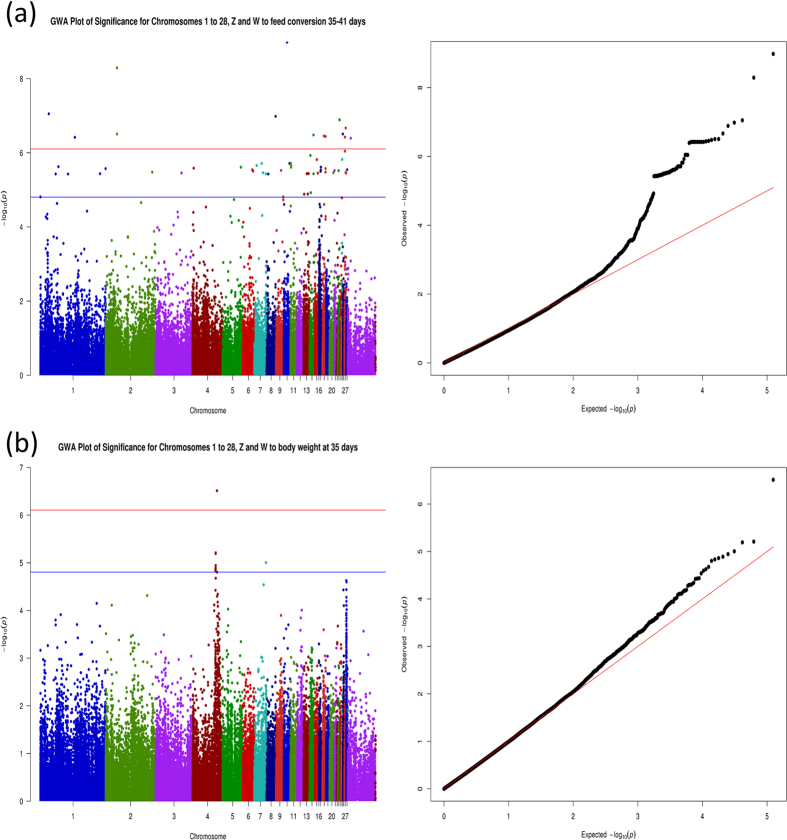
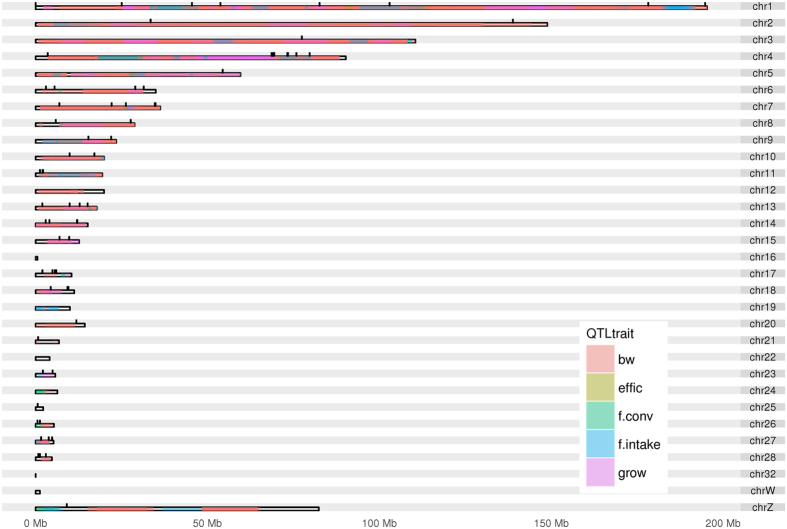
Performance traits are economically important and are targets for selection in breeding programs, especially in the poultry industry. To identify regions on the chicken genome associated with performance traits, different genomic approaches have been applied in the last years. The aim of this study was the application of CornellGBS approach (134,528 SNPs generated from a PstI restriction enzyme) on Genome-Wide Association Studies (GWAS) in an outbred F2 chicken population. We have validated 91.7% of these 134,528 SNPs after imputation of missed genotypes. Out of those, 20 SNPs were associated with feed conversion, one was associated with body weight at 35 days of age (P < 7.86E-07) and 93 were suggestively associated with a variety of performance traits (P < 1.57E-05). The majority of these SNPs (86.2%) overlapped with previously mapped QTL for the same performance traits and some of the SNPs also showed novel potential QTL regions. The results obtained in this study suggests future searches for candidate genes and QTL refinements as well as potential use of the SNPs described here in breeding programs.
Conflict of interest statement
The authors declare no competing financial interests.
Figures
References
-
- Fulton J. E. Genomic selection for poultry breeding. Anim. Front. 2, 30–36 (2012).
-
- Blackburn H. D. The National Animal Germplasm Program: challenges and opportunities for poultry genetic resources. Poult. Sci. 85, 210–215 (2006). - PubMed
-
- Ambo M. et al. Genetic linkage maps of chicken chromosomes 6, 7, 8, 11 and 13 from a Brazilian resource population. Sci. Agric. 65, 447–452 (2008).
-
- Ambo M. et al. Quantitative trait loci for performance traits in a broiler x layer cross. Anim. Genet. 40, 200–8 (2009). - PubMed
-
- Nones K. et al. Mapping QTLs on chicken chromosome 1 for performance and carcass traits in a broiler x layer cross. Anim. Genet. 37, 95–100 (2006). - PubMed
Publication types
MeSH terms
LinkOut - more resources
Full Text Sources
Other Literature Sources
Miscellaneous
