. 2017 Feb 9:7:42130.
doi: 10.1038/srep42130.

Dissecting the brown adipogenic regulatory network using integrative genomics

Affiliations

Dissecting the brown adipogenic regulatory network using integrative genomics

Rachana N Pradhan et al. Sci Rep. .

Abstract

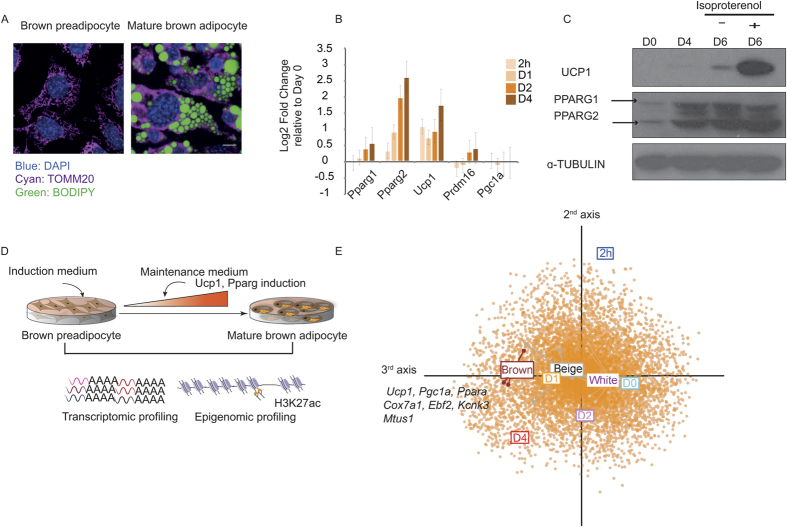
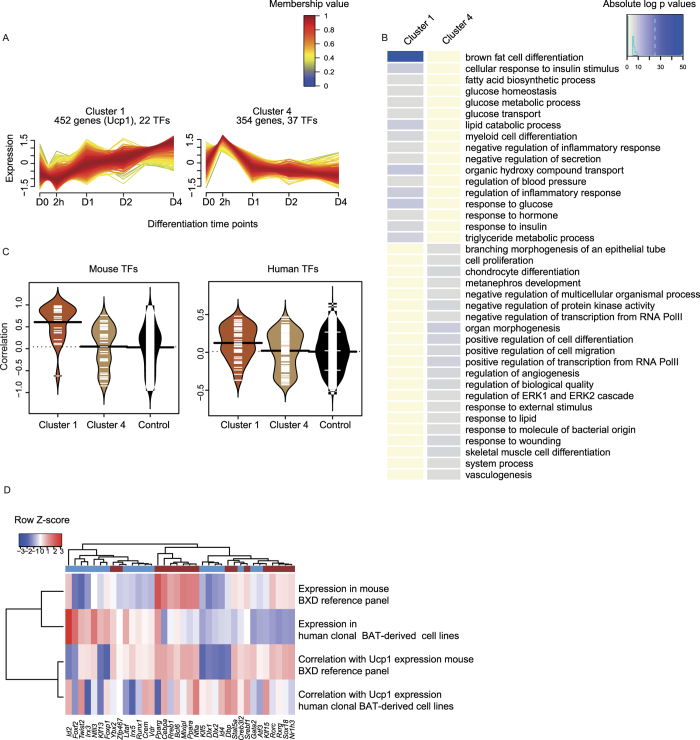
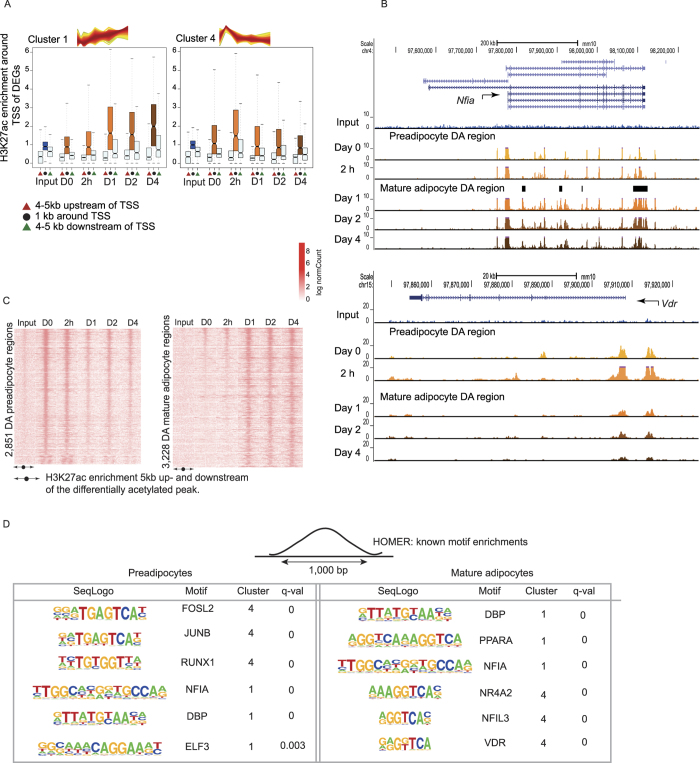
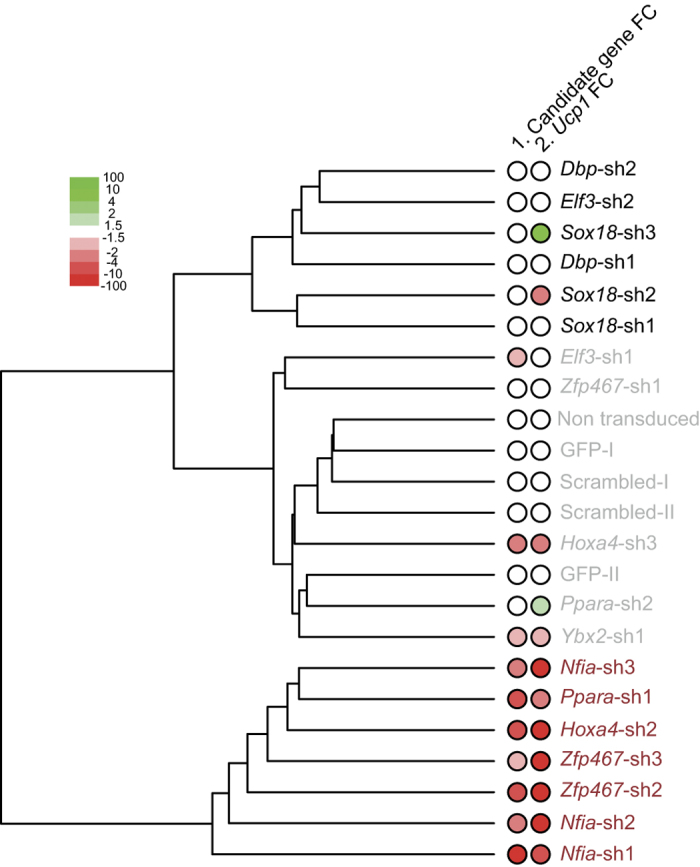
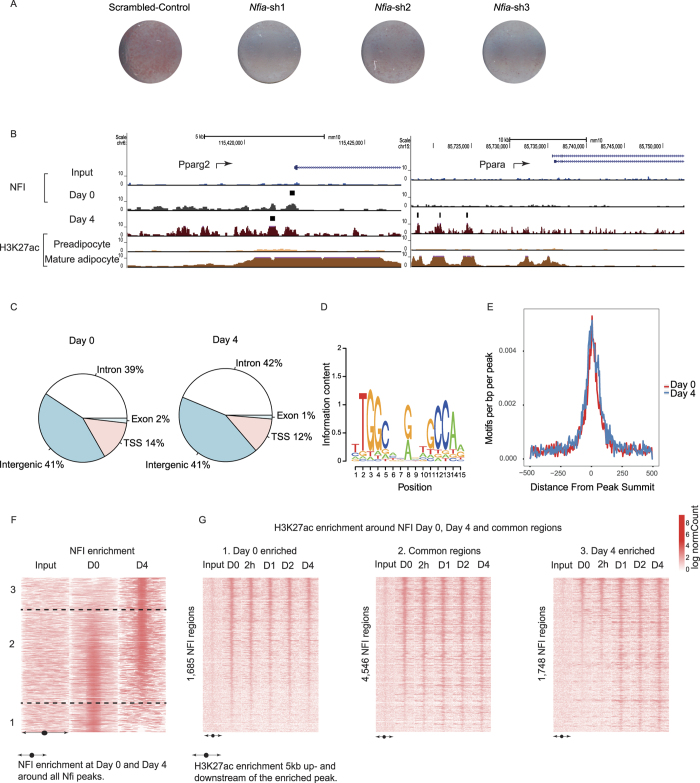
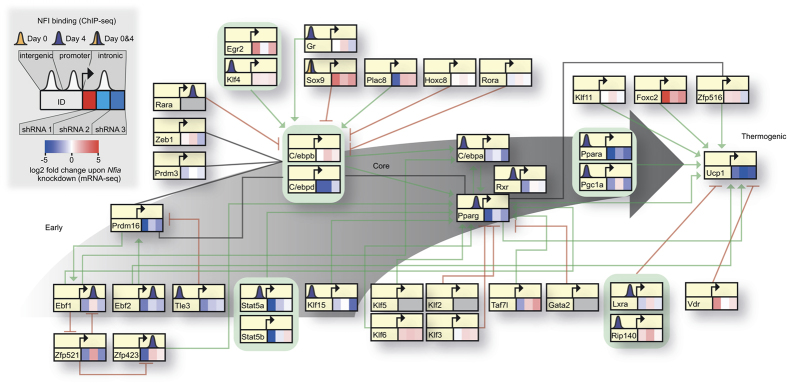
Brown adipocytes regulate energy expenditure via mitochondrial uncoupling, which makes them attractive therapeutic targets to tackle obesity. However, the regulatory mechanisms underlying brown adipogenesis are still poorly understood. To address this, we profiled the transcriptome and chromatin state during mouse brown fat cell differentiation, revealing extensive gene expression changes and chromatin remodeling, especially during the first day post-differentiation. To identify putatively causal regulators, we performed transcription factor binding site overrepresentation analyses in active chromatin regions and prioritized factors based on their expression correlation with the bona-fide brown adipogenic marker Ucp1 across multiple mouse and human datasets. Using loss-of-function assays, we evaluated both the phenotypic effect as well as the transcriptomic impact of several putative regulators on the differentiation process, uncovering ZFP467, HOXA4 and Nuclear Factor I A (NFIA) as novel transcriptional regulators. Of these, NFIA emerged as the regulator yielding the strongest molecular and cellular phenotypes. To examine its regulatory function, we profiled the genomic localization of NFIA, identifying it as a key early regulator of terminal brown fat cell differentiation.


Conflict of interest statement

The authors declare no competing financial interests.

Figures

Figure 1
Figure 1. Functional validation of an in vitro differentiating murine brown preadipocyte cell line.
(A) Fluorescent staining and confocal microscopy images of brown preadipocytes versus differentiated mature brown adipocytes. Blue DAPI stains indicate nuclei, green BODIPY stains lipid droplets and Cyan TOM20 specific stain identifies mitochondria. Scale bar: 10 um. (B) Gene expression levels of the brown fat marker genes Pparg1, Pparg2, Ucp1, Prdm16 and Pgc1a, as measured using quantitative PCR, represented as log2 fold change relative to Day 0 (n = 3, data are presented as mean ± SEM). (C) Protein levels of UCP1, PPARγ (both PPARγ1 and PPARγ2 isoforms indicated) and endogenous control α-TUBULIN at different time points during differentiation, specifically, Day 0, Day 4, and Day 6 with and without treatment with the β-adrenergic stimulator, isoproterenol. Note that this image has been cropped from the film in Supplementary Fig. 4A. (D) Schematic representation of the experimental strategy and the quantitative measurements of the transcriptome and the epigenome during differentiation. (E) Correspondence analysis of ex vivo differentiated murine brown fat cells and in vitro (IBA) differentiated samples. The third axis contains genes explaining the differences between white versus brown cells (see Methods).
Figure 2
Figure 2. Transcriptome-based identification of putative transcriptional regulators of brown adipogenesis.
(A) Fuzzy c-means clusters depicting putative positive regulators (Cluster 1, increase in expression) and early stage-specific regulators (Cluster 4, spike in expression at 2 h) of differentiation with red lines indicating members strongly associated with the cluster. (B) Gene ontology (GO) terms associated with genes from Cluster 1 and Cluster 4 against a background of all genes expressed during BFC differentiation (see Methods). (C) Distribution of Pearson product-moment correlation coefficient of expression levels of all TFs from Clusters 1 and 4, as well as controls (all TFs), respectively, with Ucp1 expression levels in the BAT of BXD mouse reference panel strains (top) and human clonal BAT-derived cell lines (bottom). (D) Heatmap representing mean expression levels (row-wise z-scores) of Cluster 1 and Cluster 4 TFs and the correlation of their expression with Ucp1 expression levels in both the mouse BXD panel and across human clonal cell lines.
Figure 3
Figure 3. The chromatin landscape is established by Day 1 of brown adipogenesis.
(A) The distribution of H3K27ac ChIP enrichment within a 10 kb region around the transcription start site (TSS) of differentially expressed genes (DEGs) from each cluster. The region around the TSS is partitioned into three compartments: a red triangle represents a region from +4 to +5 kb of the TSS, a black dot represents a region from +1 to −1 kb around the TSS and a green triangle represents a −4 to −5 kb of the TSS. (B) UCSC browser screen shots of the H3K27ac change around the genomic locus of two candidate regulators, Nfia (Cluster 1) and Vdr (Cluster 4). (C) Heatmap representing H3K27ac ChIP enrichment within a 10 kb region around the differentially acetylated (DA) region enriched in either Pre- or Mature- adipocytes. (D) Top overrepresented motifs in either Pre- or Mature adipocyte H3K27ac regions for TFs that are significantly differentially expressed across differentiation (see Methods).
Figure 4
Figure 4. Transcriptomic and phenotypic outcome of candidate TF perturbation.
Hierarchical clustering of controls and knockdowns (KDs) performed with distinct shRNA constructs. Column 1 indicates the degree of TF KD and Column 2 indicates the reduction in Ucp1 expression levels.
Figure 5
Figure 5. NFI binding is associated with active chromatin near key BFC marker genes.
(A) Lipid accumulation visualised using Oil red O (ORO) staining of scrambled control versus Nfia KD samples. (B) UCSC browser screen shots of NFI binding sites at the Pparg2 promoter and distal to the Ppara promoter including H3K27ac ChIP-seq coverage profiles associated with Pre- and Mature- brown adipocytes. (C) Overview of NFI bound sites at their genomic locations at Day 0 and Day 4. (D) NFIA PWM derived from HOCOMOCO and used for scanning NFI peaks. (E) NFIA motif localization at Day 0 and Day 4, in a 1 kb region around the summit of NFI peaks. (F) NFI enrichment at Day 0 and Day 4 around 7,979 NFI bound regions across Day 0 and Day 4. (G) H3K27ac ChIP-seq enrichment within a 10 kb region surrounding NFI peaks enriched at Day 0 (group 1, 1,685 regions), common to both Day 0 and Day 4 (group 2, 4,546 regions) and enriched at Day 4 (group 3, 1,748 regions).
Figure 6
Figure 6. NFIA as a key early regulator of terminal brown fat cell differentiation.
Summary of the adipogenic and brown adipogenic gene regulatory network (GRN) and the transcriptomic impact upon Nfia perturbation using shRNA mediated loss of function assays. Approximate binding locations (ChIP-seq based) of NFI are represented. Green arrows represent activation, red t-bars represent inhibition while grey thick lines represent protein-protein interactions. Each node is divided into three boxes representing the gene expression levels using three different shRNAs. Additionally, a small peak colored either yellow or purple represents NFI binding either at Day 0 or Day 4, with the peaks distributed according to their spatial location: promoter, intergenic or intronic.

References

    1. Virtanen Kirsi A., Lidell Martin A., Orava J., Hegling M., Westergren R., Niemi T., Taitonen M., Laine J., Savisto N. J. & Enerback S. N. P. Functional Brown Adipose Tissue in Healthy Adults. N. Engl. J. Med. 360, 1518–1524 (2009). - PubMed
    1. Cypess A. M., Lehman S., Williams G., Tal I., Rodman D., Goldfine A. B., Kuo F. C., Palmer E. L., Tseng Y.-H., Doria A., Kolodny G. M. & Kahn C. R. Identification and importance of brown adipose tissue in adult humans. N. Engl. J. Med. 360, 1509–17 (2009). - PMC - PubMed
    1. Saito M. et al. High Incidence of Metabolically Active Brown Adipose Effects of Cold Exposure and Adiposity. Diabetes 58, 1526–1531 (2009). - PMC - PubMed
    1. Cannon B. & Nedergaard J. Brown adipose tissue: function and physiological significance. Physiol. Rev. 84, 277–359 (2004). - PubMed
    1. Ruiz-Ojeda F., Rupérez A., Gomez-Llorente C., Gil A. & Aguilera C. Cell Models and Their Application for Studying Adipogenic Differentiation in Relation to Obesity: A Review. Int. J. Mol. Sci. 17, 1040 (2016). - PMC - PubMed

Publication types