. 2017 Feb 9;8(2):e2606.
doi: 10.1038/cddis.2016.434.

Coordinate activities of BRD4 and CDK9 in the transcriptional elongation complex are required for TGFβ-induced Nox4 expression and myofibroblast transdifferentiation

Affiliations

Coordinate activities of BRD4 and CDK9 in the transcriptional elongation complex are required for TGFβ-induced Nox4 expression and myofibroblast transdifferentiation

Talha Ijaz et al. Cell Death Dis. .

Abstract

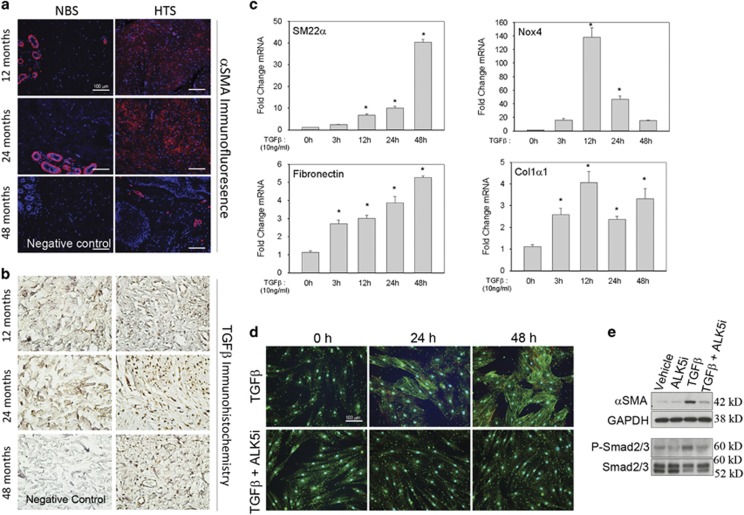
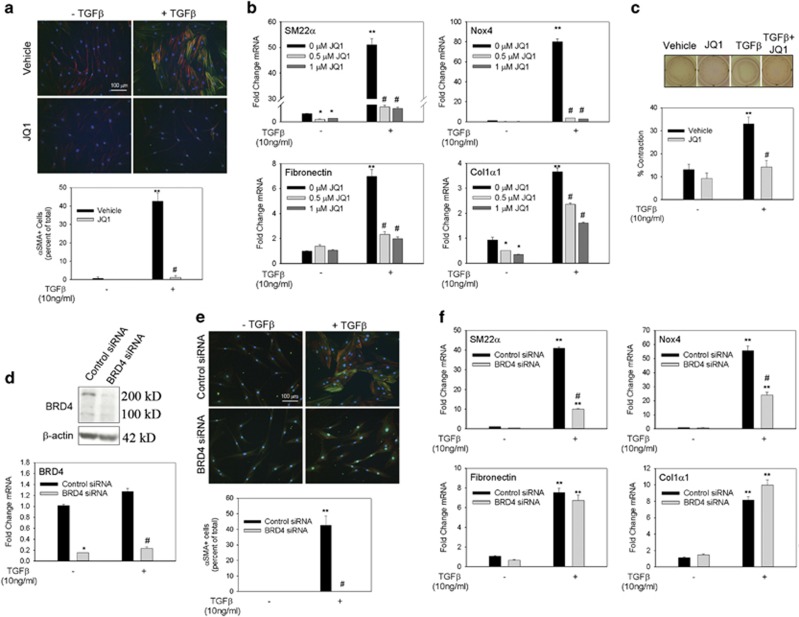
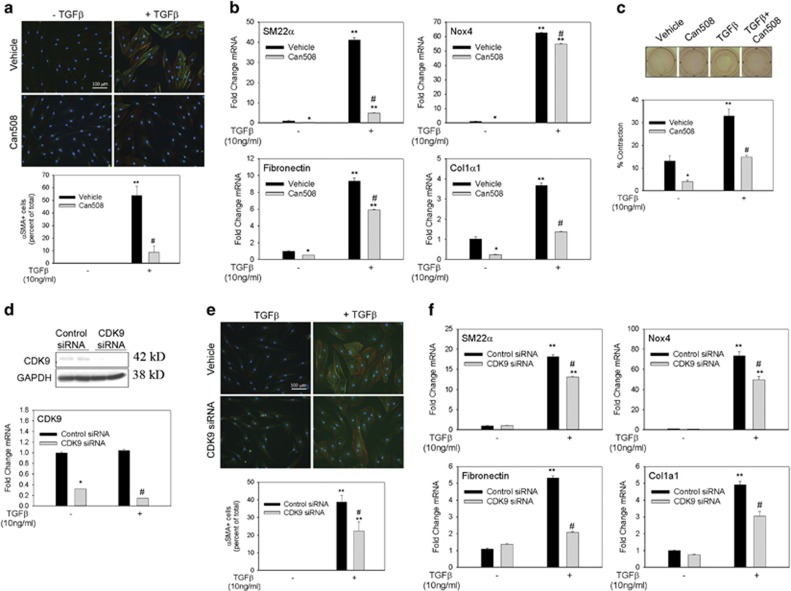
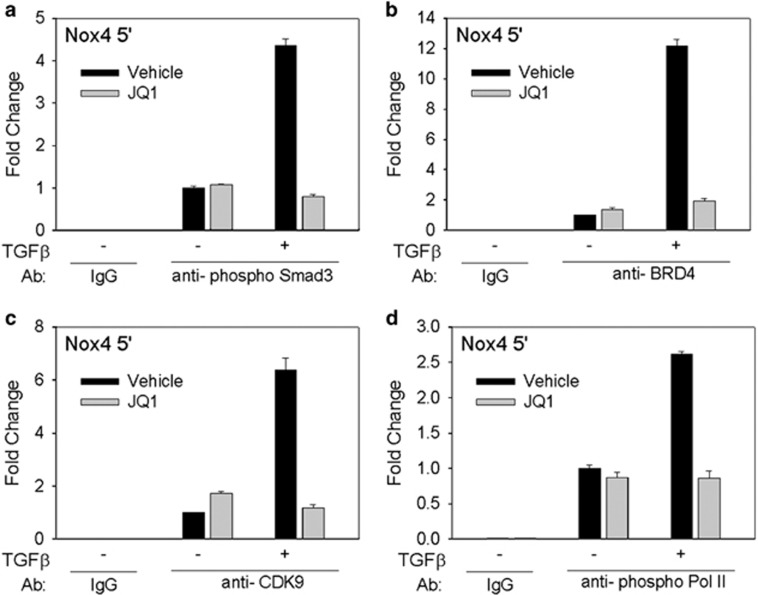
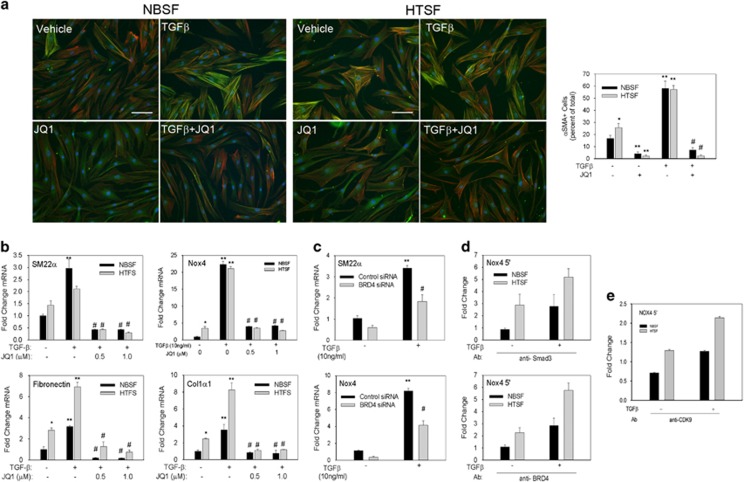
Transdifferentiation of quiescent dermal fibroblasts to secretory myofibroblasts has a central role in wound healing and pathological scar formation. This myofibroblast transdifferentiation process involves TGFβ-induced de novo synthesis of alpha smooth muscle cell actin (αSMA)+ fibers that enhance contractility as well as increased expression of extracellular matrix (ECM) proteins, including collagen and fibronectin. These processes are mediated upstream by the reactive oxygen species (ROS)-producing enzyme Nox4, whose induction by TGFβ is incompletely understood. In this study, we demonstrate that Nox4 is involved in αSMA+ fiber formation and collagen production in primary human dermal fibroblasts (hDFs) using a small-molecule inhibitor and siRNA-mediated silencing. Furthermore, TGFβ-induced signaling via Smad3 is required for myofibroblast transformation and Nox4 upregulation. Immunoprecipitation-selected reaction monitoring (IP-SRM) assays of the activated Smad3 complex suggest that it couples with the epigenetic reader and transcription co-activator bromodomain and extraterminal (BET) domain containing protein 4 (BRD4) to promote Nox4 transcription. In addition, cyclin-dependent kinase 9 (CDK9), a component of positive transcription elongation factor, binds to BRD4 after TGFβ stimulation and is also required for RNA polymerase II phosphorylation and Nox4 transcription regulation. Surprisingly, BRD4 depletion decreases myofibroblast differentiation but does not affect collagen or fibronectin expression in primary skin fibroblasts, whereas knockdown of CDK9 decreases all myofibroblast genes. We observe enhanced numbers and persistence of myofibroblast formation and TGFβ signaling in hypertrophic scars. BRD4 inhibition reverses hypertrophic skin fibroblast transdifferentiation to myofibroblasts. Our data indicate that BRD4 and CDK9 have independent, coordinated roles in promoting the myofibroblast transition and suggest that inhibition of the Smad3-BRD4 pathway may be a useful strategy to limit hypertrophic scar formation after burn injury.


Conflict of interest statement

The authors declare no conflict of interest.

Figures

Figure 1
Figure 1
TGFβ induces dermal fibroblast Nox4 expression and promotes transdifferentiation to myofibroblast. (a) Immunofluorescence detection of αSMA+ myofibroblasts in skin biopsies taken from burn patients, 12–48 months after injury, at the site of HTS formation and from the adjacent NBS. Positive staining for αSMA is in red and counterstaining for nuclei is in blue. Note that myofibroblasts have almost completely disappeared from the dermis 48 months after injury. There is some positive staining of glandular smooth muscle cells and vascular smooth muscle cells with anti-αSMA antibody in NBS and HTS sections, which serves as an internal positive control. Scale bar represents 100 microns. (b) IHC for TGFβ in HTS and NBS tissue sections from burn patients. Positive staining for TGFβ is brown and counterstaining for nuclei is blue. Most of the positive staining for TGFβ was observed in HTS biopsies at 12–24 months in the same location as the highest amount of αSMA+ staining. Scale bar represents 100 microns. IHC was performed on up to three tissue sections from a patient at each time point. Representative images are shown. (c) hDFs were stimulated with TGFβ (10 ng/ml) for 0–48 h, and changes in gene expression for SM22α, Nox4, fibronectin and Col1α1 were analyzed via quantitative real-time PCR. Gene expression was normalized to DNA polymerase β mRNA. Data are presented as mean±S.E.M. This experiment was repeated three times. *P<0.05 versus 0 h. (d) hDF cells were seeded on coverslips, pretreated with 10 μM ALK5i LY2157299 before being stimulated with TGFβ (10 ng/ml) for up to 48 h. Immunostaining for αSMA (green) and staining for filamentous actin using AlexaFluor-568-conjugated phalloidin (red) was performed. αSMA+ cells (green or yellow fibers) were considered to be myofibroblasts. Scale bar represents 100 microns. This experiment was repeated twice and similar results were observed. (e) hDF cells were pretreated with vehicle or 10 μM ALK5i and then stimulated with TGFβ (10 ng/ml). Whole-cell extracts were collected after 24 h and western blotting analysis was performed to analyze de novo αSMA production and phospho-Smad2/3. GAPDH and Smad2/3 served as loading controls. Experiment was repeated twice and similar results were obtained
Figure 2
Figure 2
Nox4 inhibition with GKT137831 and Nox4 suppression with siRNA decrease dermal myofibroblast transformation. (a) hDFs were pretreated with vehicle or GKT137831 (20 μM) for 1 h before stimulation with TGFβ for 48 h. Immunofluoresence staining for αSMA (green) and filamentous actin stain with phalloidin (red) was performed. This experiment was repeated three times and the percentage of αSMA+ myofibroblasts were quantified over the three experiments. (b) hDF cells were pretreated with vehicle or GKT137831 (20 μM) for 1 h followed by TGFβ (10 ng/ml) for 24 h. Cellular mRNA was analyzed via quantitative real-time PCR (qRT-PCR) for changes in gene expression of SM22α, Nox4, fibronectin and Col1α1. (c) Collagen gel contraction assay was performed with hDF cells. Cells were treated with vehicle or GKT137831 (20 μM) in the presence or absence of TGFβ (10 ng/ml). Experimental groups were evaluated in triplicate. Change in gel surface area was determined after 48 h and is represented as the percentage of contraction of the gel. Experiments in panels (ac) were repeated at least three times. Data are presented as mean±S.E.M. **P<0.05 versus −TGFβ; #P<0.05 versus vehicle+TGFβ treatment. (d) After electroporation of control or Nox4 siRNAs, hDF cells were stimulated with TGFβ (10 ng/ml) for 24 h. Total RNA was collected to analyze changes in gene expression by qRT-PCR. (e) hDF cells were electroporated with control or Nox4 siRNA and, after 3 days, were stimulated with TGFβ for 48 h. Immunofluoresence staining for αSMA (green) and phalloidin staining for filamentous actin (red) was performed to detect myofibroblasts. The percentage of cells that transdifferentiate to myofibroblasts was determined. The average of three experiments is presented in the bar graph. (f) qRT-PCR for changes in SM22α, fibronectin and Col1α1 mRNAs. (g) To detect changes in ROS, DCF-DA assay was performed on cells electroporated with control or Nox4 siRNA and incubated with or without TGFβ (10 ng/ml). As a positive control, hDF cells electroporated with control siRNA were treated with 4.8 nM H202. ROS detection assay was performed twice and each treatment group was evaluated in quadruplicates. Immunofluorescence staining in panel (d) and qRT-PCR experiments in panels (e and f) were performed three times each. All data are presented as mean±S.E.M. **P<0.05 versus −TGFβ; #P<0.05 versus control siRNA+TGFβ
Figure 3
Figure 3
Smad3 regulates myofibroblast transdifferentiation and binds to BRD4 during TGFβ stimulation. (a) hDFs were electroporated with control or Smad3 siRNA. After 72 h incubation, cells were stimulated with TGFβ (10 ng/ml) for 48 h before analysis. Top panel, whole-cell extracts from hDF were analyzed for Smad3 content by western blotting. GAPDH was used as a loading control. Bottom panel, Smad3 mRNA expression was analyzed by quantitative real-time PCR (qRT-PCR). Immunofluoresence and qRT-PCR experiments were repeated at least three times. Western blotting was repeated twice. (b) hDF cells were fixed and immunostained for αSMA (green) and phalloidin for filamentous actin (red). Myofibroblasts were quantified in three separate experiments. Data presented are the mean of three experiments. (c) qRT-PCR of myofibroblast and ECM gene expression. Data in panels (ac) are presented as mean±S.E.M. **P<0.05 versus −TGFβ; #P<0.05 versus vehicle+TGFβ . (d) Immunofluoresence staining for Smad2/3, phospho-Smad2/3, BRD4 and CDK9 in hDF cells incubated with or without TGFβ (10 ng/ml) for 24 h. DAPI was used to stain nuclei. Scale bar represents 100 microns. Immunofluoresence experiments were repeated twice and similar results were observed. (e) hDFs were treated with TGFβ (10 ng/ml) for 24 h. Equal amount of cell lysates were immunoprecipitated with anti-Smad3 antibody and subjected to SID-SRM-MS analysis of Smad3 and BRD4 protein levels. Data are presented as the mean ratio of native to SIS peptides or as BRD4 signal normalized to Smad3. (f) hDF cells were treated with TGFβ (10 ng/ml) for 24 h and cell lysates were immunoprecipitated with an anti-BRD4 antibody before being subjected to SID-SRM-MS analysis for BRD4, Smad3 and CDK9 proteins. Data are presented as the mean ratio of native to SIS peptide. All immunoprecipitation experiments were repeated three times. Bar graphs represent mean±S.E.M. *P<0.05 versus –TGFβ
Figure 4
Figure 4
JQ1 treatment and BRD4 suppression with siRNA block myofibroblast transdifferentiation. (a) hDF cells were preincubated with 1 μM JQ1 or vehicle for 1 h before stimulation with TGFβ (10 ng/ml) for 48 h. Immunofluoresence staining for αSMA (green) and phalloidin staining for filamentous actin (red) was used to detect myofibroblasts. Myofibroblast cells (αSMA+) were quantified in three separate experiments. (b) hDF cells were preincubated with 0.5 or 1 μM JQ1 for 1 h and then stimulated with TGFβ (10 ng/ml) for 24 h. mRNA was analyzed via quantitative real-time PCR (qRT-PCR) to determine myofibroblast gene expression changes. (c) Collagen gel contraction assay was performed with hDF cells treated with vehicle or 1 μM JQ1 in the presence or absence of TGFβ (10 ng/ml). Gel surface area was measured at time 0 and 48 h and change in surface area is reported as the percentage of contraction of gel. The assay was performed in triplicate. Experiments in panels (ac) were repeated at least three times. Data are reported as mean±S.E.M. *P<0.05 versus 0 μM JQ1−TGFβ; **P<0.05 versus −TGFβ #P<0.05 versus vehicle+TGFβ. (d) hDF cells were electroporated with control or BRD4 siRNA. After 72 h, cells were incubated with or without TGFβ (10 ng/ml) for another 48 h. Knockdown efficiency of BRD4 was determined via western blotting and qRT-PCR. β-Actin was used as a loading control. Western blotting analysis was repeated twice. (e) αSMA immunostaining (green) and phalloidin staining for filamentous actin (red) was performed to quantify myofibroblasts (aSMA+ cells). Myofibroblast cells were quantified in four separate experiments. (f) qRT-PCR analysis for myofibroblast genes. Data are presented as mean±S.E.M. *P<0.05 versus control siRNA−TGFβ; **P<0.05 versus −TGFβ; #P<0.05 versus control siRNA+TGFβ
Figure 5
Figure 5
Inhibition of CDK9 with Can508 or CDK9 knockdown with siRNA decreases myofibroblast transformation. (a) hDFs were pretreated with Can508 (30 μM) for 6 h before stimulation with TGFβ (10 ng/ml) for 48 h. Immunofluorescence for αSMA (green) and phalloidin staining for f-actin (red) was performed. αSMA+ myofibroblast cells were quantified in three separate experiments. (b) Myofibroblast gene expression changes were analyzed via quantitative real-time PCR (qRT-PCR) in hDF cells pretreated with Can508 and stimulated with TGFβ (10 ng/ml) for 24 h. (c) Collagen contraction assay was performed on hDF cells treated with vehicle or Can508 (30 μM) in the presence or absence of TGFβ (10 ng/ml). Change in surface area is reported as the percentage of contraction of the gels. Experiments in panels (ac) were repeated at least three times. Data are represented as mean±S.E.M. *P<0.05 versus vehicle−TGFβ; **P<0.05 versus −TGFβ; #P<0.05 versus vehicle+TGFβ. (d) hDF cells were electroporated with control or CDK9 siRNA before being stimulated with TGFβ (10 ng/ml) for 48 h. Top panel, whole-cell extracts extracts were assayed for CDK9 expression by western blotting. GAPDH was used as a loading control. Western blotting was repeated twice with similar results being observed. Bottom panel, qRT-PCR analysis of CDK9 mRNA. Data are presented as mean±S.E.M. of at least three experiments. (e) Cells were immunostained for αSMA and also stained for f-actin with phalloidin (red) to determine the myofibroblast population. Average of five experiments is represented in the bar graph. (f) mRNA was assayed for gene expression by qRT-PCR. Data are presented as mean±S.E.M. of at least three experiments. *P<0.05 versus control siRNA−TGFβ; **P<0.05 versus −TGFβ; #P<0.05 versus control siRNA+TGFβ
Figure 6
Figure 6
Increased accumulation of Smad3, BRD4 and CDK9 on Nox4 promoter after TGFβ stimulation. hDFs were preincubated with vehicle or JQ1 for 1 h before being stimulated with TGFβ (10 ng/ml) for 24 h. Cells were then subjected to XChIP analysis. (a) pSmad3 binding on the Nox4 promoter. Chromatin was immunoprecipitated with an antibody to p-Smad3; non-specific IgG was used as a negative control. Fold change was determined compared with −TGFβ sample. (b) BRD4 binding. Experiment as in panel (a). (c) CK9 binding. (d) phospho-Ser2 RNA Pol II. For experiments in panels (ad), data are presented as mean±S.E.M. from two independent experiments; similar results were obtained in each
Figure 7
Figure 7
HTS fibroblasts have increased propensity for myofibroblast transformation, which can be blocked with JQ1. (a) HTS and NBS fibroblasts were preincubated with vehicle or JQ1 (1 μM) for 1 h before being stimulated with TGFβ (10 ng/ml) for 48 h. Cells were then immunostained for αSMA (green) and co-stained for f-actin with phalloidin (red). αSMA+ myofiboblasts were quantified in three separate experiments. Data are presented as mean±S.E.M. *P=0.055 versus NBSF; **P<0.05 versus unstimulated cells; #P<0.05 versus TGFβ. (b) NBS and HTS fibroblasts were subjected to quantitative real-time PCR (qRT-PCR) analysis of myofibroblast gene expression changes after incubation with or without JQ1 (1 μM) and TGFβ (10 ng/ml). The experiment was repeated three times. Data are presented as mean±S.E.M. *P<0.05 versus NBSF; **P<0.05 versus unstimulated cells; #P<0.05 versus TGFβ. (c) BRD4 knockdown with siRNA was performed in HTS fibroblasts before TGFβ (10 ng/ml) stimulation for 24 h. Cellular mRNA was extracted and qRT-PCR was performed for BRD4-dependent myofibroblast genes. This experiment was repeated three times. Data are presented as mean±S.E.M. **P<0.05 versus control siRNA−TGFβ; #P<0.05 versus control siRNA+TGFβ. (d) XChIP analysis for Smad3 and BRD4 on the Nox4 promoter was performed on NBS and HTS fibroblasts incubated with or without TGFβ (10 ng/ml) for 6 h. Fold change is calculated relative to NBSF−TGFβ sample. XChIP experiment was performed twice and similar results were observed. Data are presented as mean±S.E.M. (e) XChIP for CDK9 binding to the Nox4 promoter. Experiment is carried out as in panel (d)

Similar articles

Cited by

References

    1. Singer AJ, Clark RA. Cutaneous wound healing. N Engl J Med 1999; 341: 738–746. - PubMed
    1. Darby IA, Zakuan N, Billet F, Desmouliere A. The myofibroblast, a key cell in normal and pathological tissue repair. Cell Mol Life Sci 2016; 73: 1145–1157. - PMC - PubMed
    1. Finnerty CC, Jeschke MG, Branski LK, Barret JP, Dziewsulski P, Herndon DN. Hypertrophic scarring: the greatest unmet challenge following burn injury. Lancet 2016; 388: 1427–1436. - PMC - PubMed
    1. Arno AI, Gauglitz GG, Barret JP, Jeschke MG. New molecular medicine-based scar management strategies. Burns 2014; 40: 539–551. - PMC - PubMed
    1. Nedelec B, Shankowsky H, Scott PG, Ghahary A, Tredget EE. Myofibroblasts and apoptosis in human hypertrophic scars: the effect of interferon-alpha2b. Surgery 2001; 130: 798–808. - PubMed

MeSH terms