. 2017 Feb 9;8(2):e2610.
doi: 10.1038/cddis.2017.29.

Prenatal alcohol exposure impairs autophagy in neonatal brain cortical microvessels

Affiliations

Prenatal alcohol exposure impairs autophagy in neonatal brain cortical microvessels

Virginie Girault et al. Cell Death Dis. .

Abstract

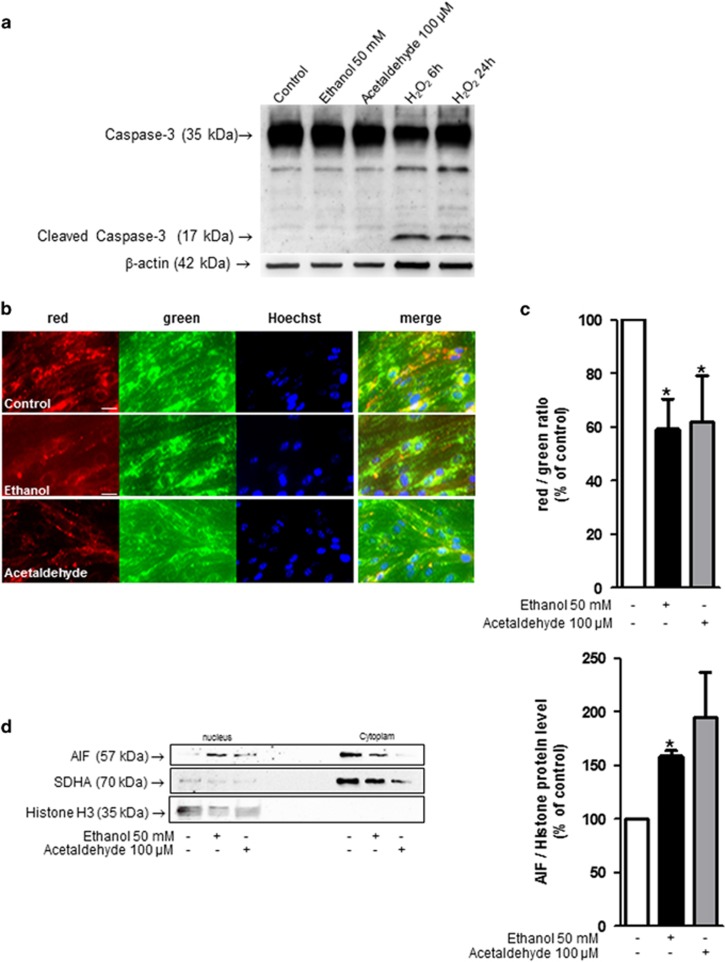
Brain developmental lesions are a devastating consequence of prenatal alcohol exposure (PAE). We recently showed that PAE affects cortical vascular development with major effects on angiogenesis and endothelial cell survival. The underlying molecular mechanisms of these effects remain poorly understood. This study aimed at characterizing the ethanol exposure impact on the autophagic process in brain microvessels in human fetuses with fetal alcohol syndrome (FAS) and in a PAE mouse model. Our results indicate that PAE induces an increase of autophagic vacuole number in human fetal and neonatal mouse brain cortical microvessels. Subsequently, ex vivo studies using green fluorescent protein (GFP)-LC3 mouse microvessel preparations revealed that ethanol treatment alters autophagy in endothelial cells. Primary cultures of mouse brain microvascular endothelial cells were used to characterize the underlying molecular mechanisms. LC3 and p62 protein levels were significantly increased in endothelial cells treated with 50 mM ethanol. The increase of autophagic vacuole number may be due to excessive autophagosome formation associated with the partial inhibition of the mammalian target of rapamycin pathway upon ethanol exposure. In addition, the progression from autophagosomes to autolysosomes, which was monitored using autophagic flux inhibitors and mRFP-EGFP vector, showed a decrease in the autolysosome number. Besides, a decrease in the Rab7 protein level was observed that may underlie the impairment of autophagosome-lysosome fusion. In addition, our results showed that ethanol-induced cell death is likely to be mediated by decreased mitochondrial integrity and release of apoptosis-inducing factor. Interestingly, incubation of cultured cells with rapamycin prevented ethanol effects on autophagic flux, ethanol-induced cell death and vascular plasticity. Taken together, these results are consistent with autophagy dysregulation in cortical microvessels upon ethanol exposure, which could contribute to the defects in angiogenesis observed in patients with FAS. Moreover, our results suggest that rapamycin represents a potential therapeutic strategy to reduce PAE-related brain developmental disorders.


Conflict of interest statement

The authors declare no conflict of interest.

Figures

Figure 1
Figure 1
Autophagic vacuole content in brain microvessels of FAS human fetuses observed using confocal microscopy. (a) Example from a FAS human fetus at 30 GW with a strong LC3-positive and diffuse green staining in the superficial part of the cortex and disorganization of microvessels (red staining with GLUT1 antibody) compared to a cortical section from a control brain at the same gestational age. The scale bar represents 50 μm. (b) At higher magnification: numerous LC3-positive dots in a cortical microvessel of FAS human fetus compared to the control fetus that displayed a less intense and more diffuse LC3 staining. The scale bar represents 5 μm. Arrows indicates LC3-positive dots in endothelial cells. (c) Box whisker plot of LC3-positive dots per endothelial cell on confocal images for four FAS and age-matched control fetuses from 29 to 34 WG. Plot depicts the median, interquartile range and range of values of LC3 dots per cell measured in each sample. *P<0.05 versus age-matched control, Mann–Whitney test
Figure 2
Figure 2
Autophagic vacuole content in mouse brain microvessels observed using confocal microscopy. (a and b) Daily s.c. injections of sodium chloride (0.9% NaCl) (a) or ethanol (3 g/kg, diluted 50% v/v in 0.9% NaCl) (b) were administered to pregnant NMRI mice from gestational day 13 to 1 day after parturition. Brain microvessels were extracted from P2 pups and immunolabeled with anti-LC3 antibody. (c and d) Brain cortical microvessels were extracted from P2 transgenic GFP-LC3 mice and incubated (c) without or (d) with 50 mM ethanol for 6 h. (e) Box whisker plot of GFP-LC3-dots per 100 μm2. Plot depicts the median, interquartile range and range of values of LC3 dots measured in each sample. *P<0.05 versus age-matched control, Mann–Whitney test. (f) Brain microvessels extracted P2 transgenic GFP-LC3 mice incubated for 6 h with 50 mM ethanol were immunolabeled with the anti-GLUT-1 antibody (red). The scale bar represents 10 μm. Arrows indicates LC3-positive dots. (g) Data were uploaded into Imaris for three-dimensional (3D) reconstitution and analysis with the Imaris MeasurementPro module
Figure 3
Figure 3
Effect of ethanol on autophagy activity in MPMVEC. (a) Influence of various concentrations of ethanol on LC3-II protein level. Western blot of cells incubated for 6 h in the presence or absence of 25, 50, 100 or 200 mM ethanol, showing LC3-I (18 kDa), LC3-II (16 kDa) and β-actin (42 kDa). The values are the means±S.E.M. for six independent experiments, expressed as the LC3-II/β-actin ratio normalized to 100 for untreated cells. *P<0.05 versus control, n=6, Student's t-test. (b) Time course of the effect of 50 mM ethanol on LC3-II protein levels. The values obtained for the quantification of western blots are expressed as means±S.E.M. for the LC3-II/β-actin ratio normalized to 100 for untreated cells. *P<0.05 versus control at the indicated time, n=4, Student's t-test. (c) Cells were incubated for 2 h in the presence or the absence of 50 mM ethanol, and RT-PCR analysis were performed to determine LC3, Beclin1, ATG5, ATG3, ATG7 and p62 mRNA levels. Results are expressed as the mean±S.E.M. *P<0.05 versus the control set to 1, n=5, Student's t-test. (d) Western blot of LC3 protein from cells cultured for 1 h with 10 mM 4-MP and then with or without 50 mM ethanol for 2 h. The shown values are means±S.E.M. for the LC3-II/β-actin ratio normalized to 100 for untreated cells. *P<0.05 versus control, #P<0.05 versus ethanol, n=7, Student's t-test. (e) Western blot of LC3 from cells cultured with or without 100 μM acetaldehyde for 2 h. The shown values are means±S.E.M. for the LC3-II/β-actin ratio normalized to 100 for untreated cells. *P<0.05 versus control, n=6, Student's t-test
Figure 4
Figure 4
Ethanol impact on autophagic flux in brain microvascular endothelial cells. (a and b) Western blot analysis of p70S6K and phosphorylated p70S6K (Pp70S6K) or 4E-BP1 and phosphorylated 4E-BP1 (P4E-BP1) protein expression. Cells were incubated upon 0.5, 1 or 2 h with ethanol or Krebs medium, and western blot analyses were performed. Values are means±S.E.M. for three independent experiments and expressed as Pp70S6K/p70S6K or P4EBP-1/4EBP-1 ratio normalized to 100 for untreated cells. *P<0.05 compared with control, Student's t-test. #P<0.05 compared with Krebs medium at the same time analyzed, Student's t-test. (c) Western blot analysis was performed to determine p62 protein levels after 2, 6, 24 or 48 h of ethanol exposure; the values shown are means±S.E.M. for four independent experiments and are expressed as the p62/β-actin ratio normalized to 100 for untreated cells, for the indicated times. *P<0.05 versus control; n=4, Student's t-test. (d and e) Analysis of the autophagic flux. Cells were incubated for 1 h with protease inhibitors (d) or Bafilomycin A1 (e) and then with or without 50 mM ethanol or Krebs medium for 2 h. Western blot analysis were performed to determine LC3-II protein level. The values shown are means±S.E.M. for four independent experiments and are expressed as the LC3-II/β-actin ratio normalized to 100 for untreated cells. *P<0.05 versus control; $P<0.05 versus ethanol alone; #P<0.05 versus the control with protease inhibitors; NS, nonsignificant; n=4 or n=5 with ethanol, Student's t-test
Figure 5
Figure 5
(a) Confocal microscopy of mouse primary brain microvascular endothelial cells cultured with or without protease inhibitors or Bafilomycin A1, and then with or without ethanol (50 mM) or Krebs medium for 2 h. Immunolabeling was then performed with the LC3 antibody (green) and nuclei were stained with Hoechst (blue). The scale bar represents 5 μm. The number of green dots (LC3 staining) per cell is normalized to 100 for untreated cells and is presented as the mean±S.E.M. *P<0.05 versus control, #P<0.05 versus control with protease inhibitors, $P<0.05 versus ethanol alone, NS, nonsignificant, n=4, Student's t-test. (b) Confocal microscopy of mouse primary brain microvascular endothelial cells transfected with the TagRFP-EmGFP-LC3 vector; 48 h after transfection, cells were cultured with or without ethanol (50 mM) for 2 h, and then overnight with protease inhibitors with or without rapamycin 200 nM. Red dots indicate autolysosomes, whereas yellow dots indicate autophagosomes. The scale bar represents 10 μm. The number of green dots (LC3 staining) per cell is presented as the means±S.E.M. for three independent experiments and are expressed as the number of red and yellow dots per cell. *P<0.05 versus control, n=3, Student's t-test. (c) Mouse primary brain microvascular endothelial cells were incubated for 2 h with or without ethanol (50 mM), and western blot analysis was performed to determine the Rab7 and LAMP2 protein levels. Representative autoradiograms are presented and the values are the means±S.E.M. for five independent experiments, and are expressed as the Rab7 or LAMP2/β-actin ratio normalized to 100 for untreated cells. *P<0.05 versus control, n=5, Student's t-test. (d) RT-PCR analyses were performed to determine Rab7 and LAMP2 mRNA levels after 2 h of ethanol incubation. Results are expressed as the mean±S.E.M. *P<0.05 versus the control, set to 1, n=4, Student's t-test
Figure 6
Figure 6
Effect of ethanol on endothelial cell death and brain cortical microvessel plasticity. (a) Effect of ethanol on microvessel plasticity in cultured brain slices from P2 animals. Time course of the effect of 50 mM ethanol on brain microvessel length in the presence or absence of 200 nM rapamycin. *P<0.05 versus control at the indicated time; #P<0.05 versus rapamycin+ethanol at the indicated time; two-way ANOVA; n=4. (b) The endothelial cells were labeled with calcein AM (green) and ethidium D1 (red) after 6 h of exposure to 50 mM ethanol or acetaldehyde 100 μM, in the presence or absence of 200 nM rapamycin, 30 mM 3-methyladenin (3-MA), 75 nM wortmannin (Wort) or 100 nM Bafilomycin A1 (Baf). Scale bar: 40 μm. (c) Quantification of ethidium labeling cells with ImageJ software. *P<0.05 versus control; $P<0.05 versus ethanol 50 mM; #P<0.05 versus acetaldehyde 100 μM, Student's t-test, n=4
Figure 7
Figure 7
Effect of ethanol on caspase-independent apoptosis in endothelial cells. (a) Western blots analysis of cleaved caspase-3 after 6 h of exposure to 50 mM ethanol, n=3. H2O2 (1 mM) was used as a positive control after 6 and 24 h of exposure. (b) Integrity of mitochondrial membrane potential was investigated by a mitochondrial potential-sensitive dye, JC-1. When this dye enters mitochondria, the color changes from red to green. Hoechst was used to label nuclei (blue). Scale bar: 20 μm. (c) The values are the means±S.E.M. for three independent experiments and are expressed as red/green ratio. *P<0.05 versus control, Student's t-test. (d) Western blot analysis of AIF protein expression in the nucleus and cytoplasm. Cells were incubated 2 h with or without 50 mM ethanol or 100 μM acetaldehyde, nuclear and cytoplasm protein were extracted, and western blot performed. Mitochondrial contamination of nuclear extract is checked by western blot analysis using anti-succinate dehydrogenase complex, subunit A (SDHA) antibody. Values are means±S.E.M. for three independent experiments and expressed as AIF/histone ratio normalized to 100 for untreated cells. *P<0.05 compared with control, Student's t-test

References

    1. Archibald SL, Fennema-Notestine C, Gamst A, Riley EP, Mattson SN, Jernigan TL. Brain dysmorphology in individuals with severe prenatal alcohol exposure. Dev Med Child Neurol 2001; 43: 148–154. - PubMed
    1. Burd L, Martsolf JT, Klug MG, Kerbeshian J. Diagnosis of FAS: a comparison of the Fetal Alcohol Syndrome Diagnostic Checklist and the Institute of Medicine Criteria for Fetal Alcohol Syndrome. Neurotoxicol Teratol 2003; 25: 719–724. - PubMed
    1. Hamilton GF, Whitcher LT, Klintsova AY. Postnatal binge-like alcohol exposure decreases dendritic complexity while increasing the density of mature spines in mPFC layer II/III pyramidal neurons. Synapse 2010; 64: 127–135. - PMC - PubMed
    1. Ward RJ, Colivicchi MA, Allen R, Schol F, Lallemand F, de Witte P et al. Neuro-inflammation induced in the hippocampus of 'binge drinking' rats may be mediated by elevated extracellular glutamate content. J Neurochem 2009; 111: 1119–1128. - PubMed
    1. Maier SE, Miller JA, West JR. Prenatal binge-like alcohol exposure in the rat results in region-specific deficits in brain growth. Neurotoxicol Teratol 1999; 21: 285–291. - PubMed

Publication types

MeSH terms