

Hetero-oligomerization between the TNF receptor superfamily members CD40, Fas and TRAILR2 modulate CD40 signalling
- PMID: 28182009
- PMCID: PMC5386471
- DOI: 10.1038/cddis.2017.22
Hetero-oligomerization between the TNF receptor superfamily members CD40, Fas and TRAILR2 modulate CD40 signalling
Abstract
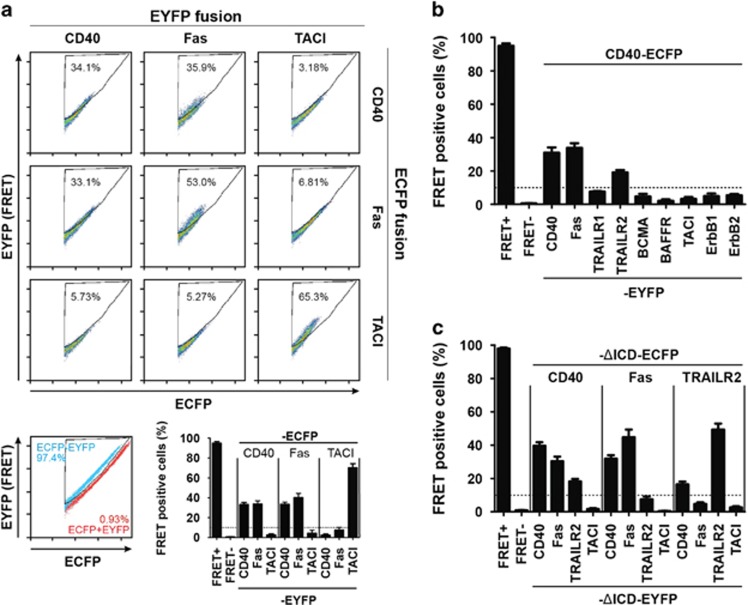
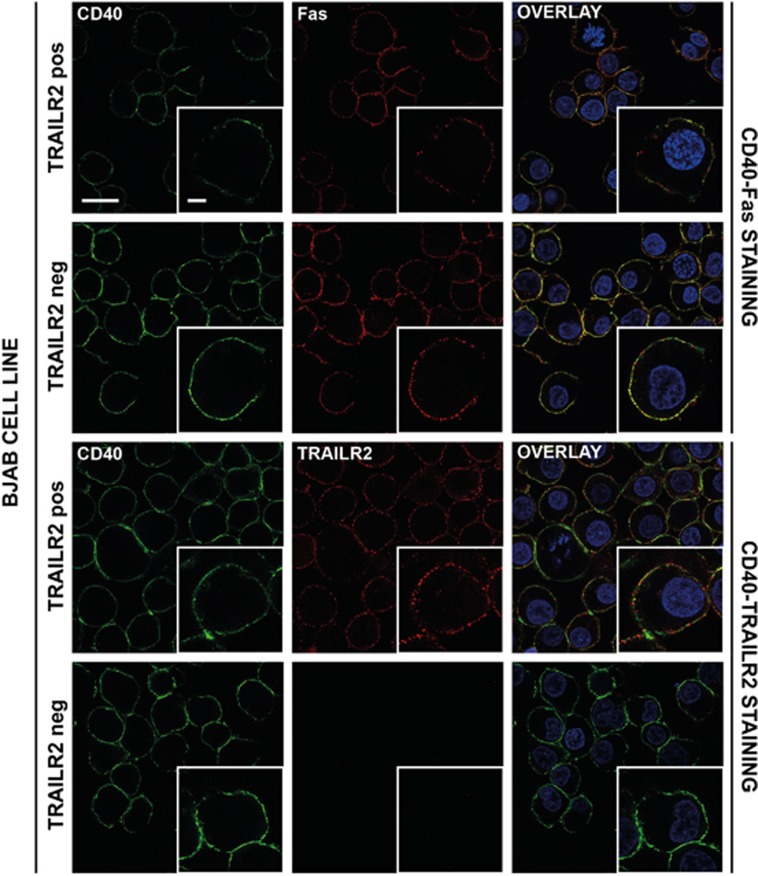
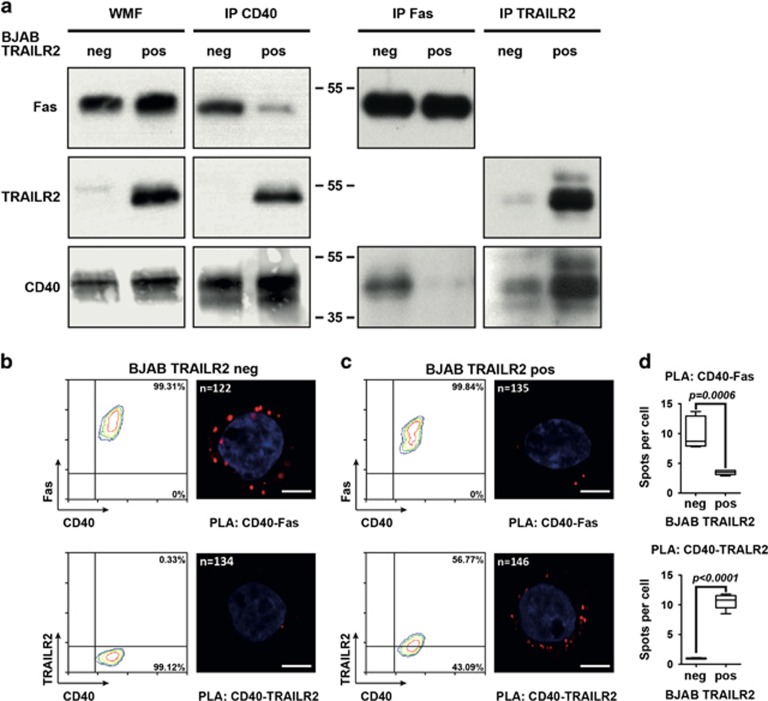
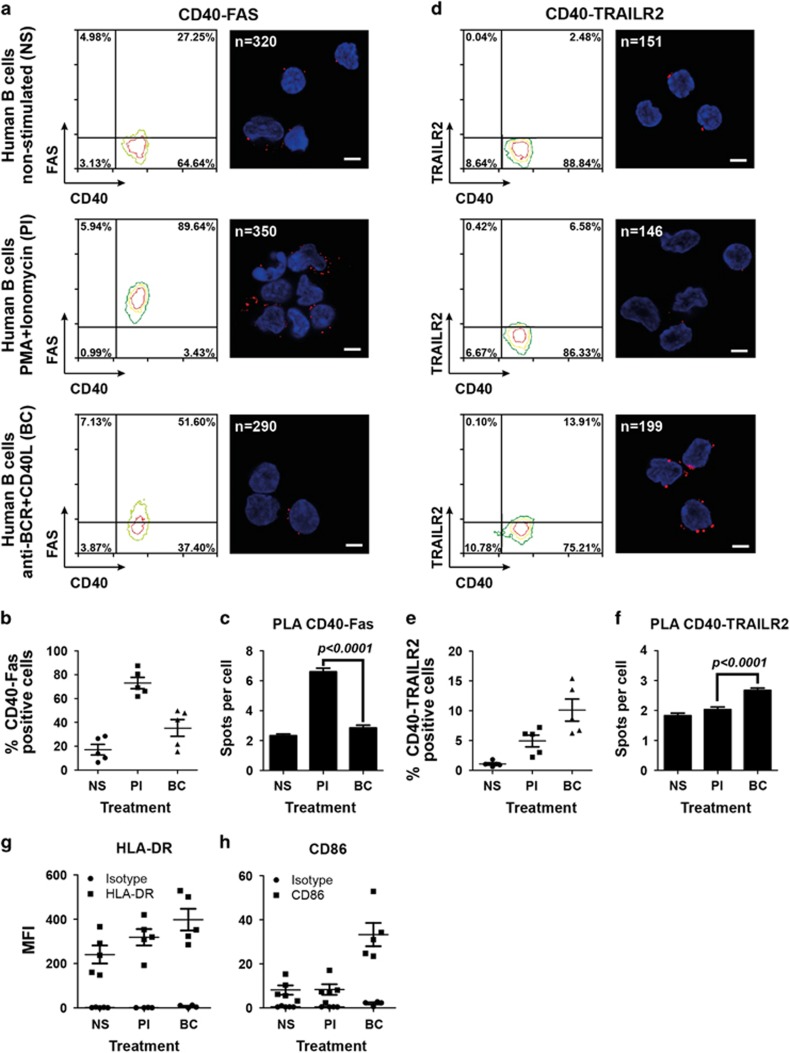
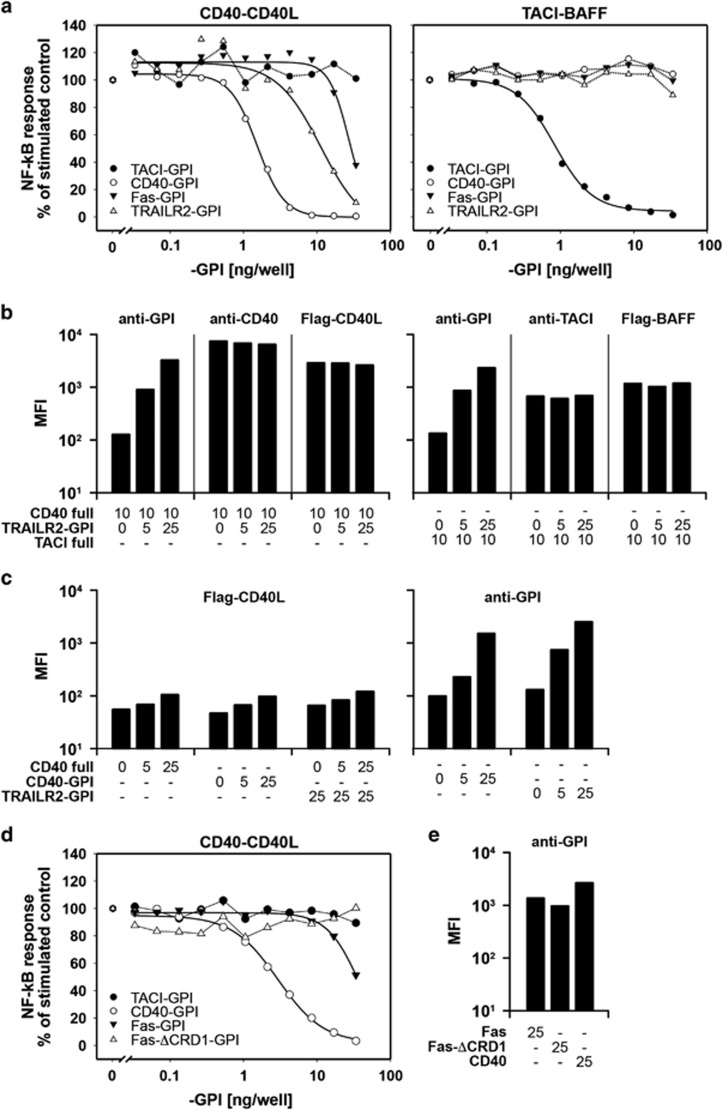
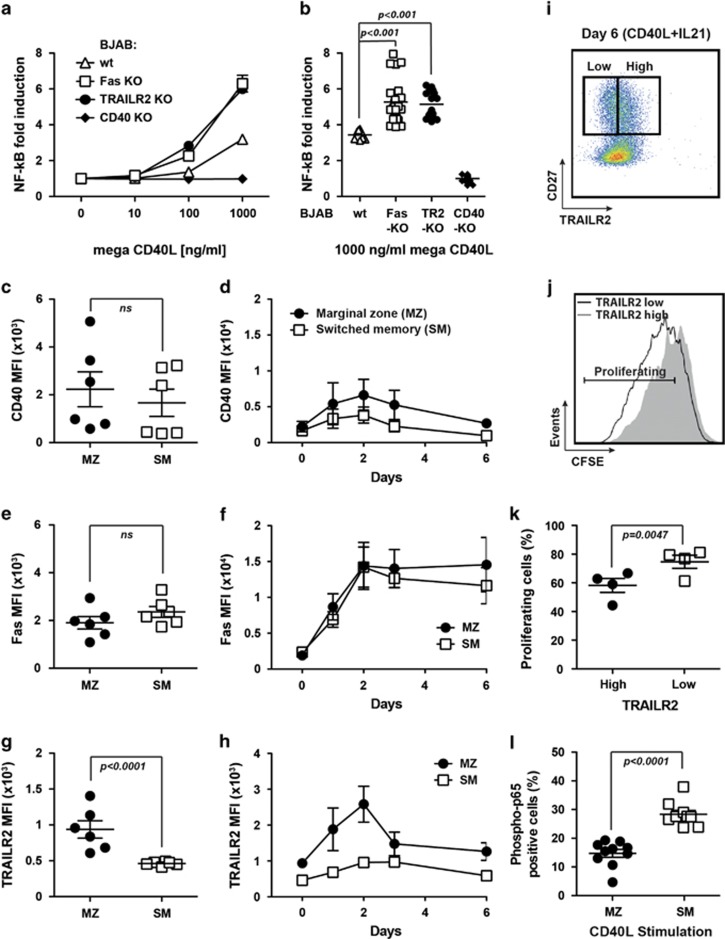
TNF receptor superfamily members (TNFRSF) such as CD40, Fas and TRAIL receptor 2 (TRAILR2) participate to the adaptive immune response by eliciting survival, proliferation, differentiation and/or cell death signals. The balance between these signals determines the fate of the immune response. It was previously reported that these receptors are able to self-assemble in the absence of ligand through their extracellular regions. However, the role of this oligomerization is not well understood, and none of the proposed hypotheses take into account potential hetero-association of receptors. Using CD40 as bait in a flow cytometry Förster resonance energy transfer assay, TNFRSF members with known functions in B cells were probed for interactions. Both Fas and TRAILR2 associated with CD40. Immunoprecipitation experiments confirmed the interaction of CD40 with Fas at the endogenous levels in a BJAB B-cell lymphoma cell line deficient for TRAILR2. TRAILR2-expressing BJAB cells displayed a robust CD40-TRAILR2 interaction at the expense of the CD40-Fas interaction. The same results were obtained by proximity ligation assay, using TRAILR2-positive and -negative BJAB cells and primary human B cells. Expression of the extracellular domains of Fas or TRAILR2 with a glycolipid membrane anchor specifically reduced the intrinsic signalling pathway of CD40 in 293T cells. Conversely, BJAB cells lacking endogenous Fas or TRAILR2 showed an increased NF-κB response to CD40L. Finally, upregulation of TRAILR2 in primary human B cells correlated with reduced NF-κB activation and reduced proliferation in response to CD40L. Altogether, these data reveal that selective interactions between different TNFRSF members may modulate ligand-induced responses upstream signalling events.
Conflict of interest statement
The authors declare no conflict of interest.
Figures
Similar articles
-
CD40 ligand protects from TRAIL-induced apoptosis in follicular lymphomas through NF-kappaB activation and up-regulation of c-FLIP and Bcl-xL.J Immunol. 2008 Jul 15;181(2):1001-11. doi: 10.4049/jimmunol.181.2.1001. J Immunol. 2008. PMID: 18606651
-
Rapid CD40-mediated rescue from CD95-induced apoptosis requires TNFR-associated factor-6 and PI3K.Eur J Immunol. 2006 Sep;36(9):2535-43. doi: 10.1002/eji.200535483. Eur J Immunol. 2006. PMID: 16897814
-
Regulation of bcl-xL expression and Fas susceptibility in mouse B cells by CD40 ligation, surface IgM crosslinking and IL-4.Mol Immunol. 1996 Nov;33(16):1247-53. doi: 10.1016/s0161-5890(96)00084-3. Mol Immunol. 1996. PMID: 9129161
-
A family of ligands for the TNF receptor superfamily.Stem Cells. 1994 Sep;12(5):440-55. doi: 10.1002/stem.5530120501. Stem Cells. 1994. PMID: 7528588 Review.
-
Structural determinants of DISC function: new insights into death receptor-mediated apoptosis signalling.Pharmacol Ther. 2013 Nov;140(2):186-99. doi: 10.1016/j.pharmthera.2013.06.009. Epub 2013 Jul 8. Pharmacol Ther. 2013. PMID: 23845861 Review.
Cited by
-
Assessing the Functional Relevance of Variants in the IKAROS Family Zinc Finger Protein 1 (IKZF1) in a Cohort of Patients With Primary Immunodeficiency.Front Immunol. 2019 Apr 16;10:568. doi: 10.3389/fimmu.2019.00568. eCollection 2019. Front Immunol. 2019. PMID: 31057532 Free PMC article.
-
CD20 as a gatekeeper of the resting state of human B cells.Proc Natl Acad Sci U S A. 2021 Feb 16;118(7):e2021342118. doi: 10.1073/pnas.2021342118. Proc Natl Acad Sci U S A. 2021. PMID: 33563755 Free PMC article.
-
Tumor Suppressor Gene XEDAR Promotes Differentiation and Suppresses Proliferation and Migration of Gastric Cancer Cells Through Upregulating the RELA/LXRα Axis and Deactivating the Wnt/β-Catenin Pathway.Cell Transplant. 2021 Jan-Dec;30:963689721996346. doi: 10.1177/0963689721996346. Cell Transplant. 2021. Retraction in: Cell Transplant. 2024 Jan-Dec;33:9636897241310845. doi: 10.1177/09636897241310845. PMID: 33637015 Free PMC article. Retracted.
-
TRAIL-R1 and TRAIL-R2 Mediate TRAIL-Dependent Apoptosis in Activated Primary Human B Lymphocytes.Front Immunol. 2019 Apr 30;10:951. doi: 10.3389/fimmu.2019.00951. eCollection 2019. Front Immunol. 2019. PMID: 31114586 Free PMC article.
-
BAFF and BAFF-Receptor in B Cell Selection and Survival.Front Immunol. 2018 Oct 8;9:2285. doi: 10.3389/fimmu.2018.02285. eCollection 2018. Front Immunol. 2018. PMID: 30349534 Free PMC article. Review.
References
-
- Victora GD, Nussenzweig MC. Germinal centers. Annu Rev Immunol 2012; 30: 429–457. - PubMed
-
- Chan TD, Gardam S, Gatto D, Turner VM, Silke J, Brink R et al. In vivo control of B-cell survival and antigen-specific B-cell responses. Immunol Rev 2010; 237: 90–103. - PubMed
-
- Kondo E, Yoshino T. Expression of apoptosis regulators in germinal centers and germinal center-derived B-cell lymphomas: insight into B-cell lymphomagenesis. Pathol Int 2007; 57: 391–397. - PubMed
-
- Greil R, Anether G, Johrer K, Tinhofer I. Tracking death dealing by Fas and TRAIL in lymphatic neoplastic disorders: pathways, targets, and therapeutic tools. J Leukoc Biol 2003; 74: 311–330. - PubMed
Publication types
MeSH terms
Substances
LinkOut - more resources
Full Text Sources
Other Literature Sources
Research Materials
Miscellaneous
