. 2017 Feb 9;12(2):e0170934.
doi: 10.1371/journal.pone.0170934. eCollection 2017.

Deciphering the molecular mechanism responsible for GCaMP6m's Ca2+-dependent change in fluorescence

Affiliations

Deciphering the molecular mechanism responsible for GCaMP6m's Ca2+-dependent change in fluorescence

Lauren M Barnett et al. PLoS One. .

Abstract

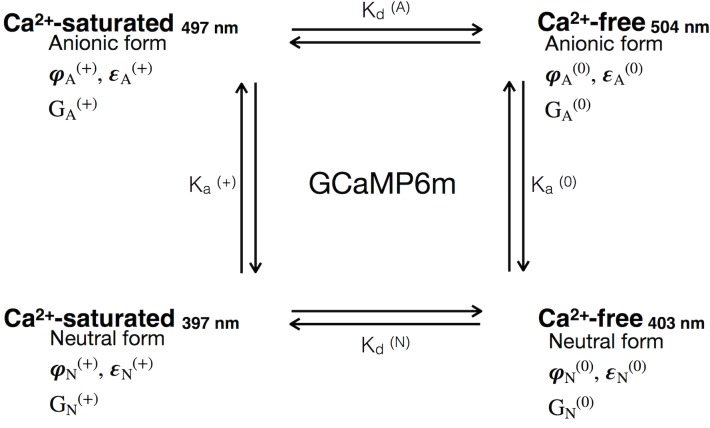
The goal of this work is to determine how GCaMP6m's fluorescence is altered in response to Ca2+-binding. Our detailed spectroscopic study reveals the simplest explanation for how GCaMP6m changes fluorescence in response to Ca2+ is with a four-state model, in which a Ca2+-dependent change of the chromophore protonation state, due to a shift in pKa, is the predominant factor. The pKa shift is quantitatively explained by a change in electrostatic potential around the chromophore due to the conformational changes that occur in the protein when calmodulin binds Ca2+ and interacts with the M13 peptide. The absolute pKa values for the Ca2+-free and Ca2+-saturated states of GCaMP6m are critical to its high signal-to-noise ratio. This mechanism has important implications for further improvements to GCaMP6m and potentially for other similarly designed biosensors.


Conflict of interest statement

The authors have declared that no competing interests exist.

Figures

Fig 1
Fig 1. Schematic of Ca2+-saturated GCaMP6m structure.
M13 domain (orange); circularly-permuted GFP domain (green); calmodulin domain (purple). Made using 3WLD.pdb [9].
Fig 2
Fig 2. The Ca2+-dependent change in GCaMP6m fluorescence is more complicated than a chromophore transition from dim to bright.
A) Transient changes in Ca2+ produce different responses in the 410 nm and 480 nm excited fluorescence of GCaMP6m. This graph shows GCaMP6m response to the release of intracellular Ca2+ stores in HEK293 cells (average of 12 cells, mean ± standard error). Green trace represents 480 nm excited fluorescence (left axis), Blue trace represents 410 nm excited fluorescence (right axis), fluorescence emission was collected at ≥ 515 nm. Muscarinic receptor (M1) activation was used to trigger the Ca2+ transient. Inset image: two HEK293 cells at peak value of 480 nm excited fluorescence. B and C) show that GCaMP6m exists in an equilibrium between at least two forms of the chromophore. Absorption spectra (black trace, left axis) and excitation spectra (red trace, right axis), and emission spectra for 400 nm excited fluorescence (blue trace, right axis) and 470 nm excited fluorescence (green trace, right axis) for purified GCaMP6m protein in 0 μM free Ca2+ buffer (Ca2+-free, B) and 39 μM free Ca2+ buffer (Ca2+-saturated, C). Fluorescence emission collected at 550 nm for excitation spectra.
Fig 3
Fig 3. The GCaMP6m Ca2+-dependent spectra are consistent with four fluorescent states of the chromophore.
A and B) illustrate the Ca2+ concentration dependent fluorescence of GCaMP6m. 470nm (top, A) and 400 nm (top, B) excited fluorescence spectra for purified protein at 11 different buffered free Ca2+ concentrations, ranging from 0 μM (dark blue trace) to 39 μM (dark red trace), at pH 7.2. The 400 nm excited spectra for 39 μM free Ca2+ sample is marked with black arrow (B). Extended lower graphs highlight Ca2+ concentration dependent λmax with normalized 470 nm (A) and 400 nm (B) excited fluorescence (same spectra as top graphs). Arrows mark the apparent peak wavelength shift between 0 μM (dark blue trace) to 39 μM (dark red trace) buffered free Ca2+ concentrations. C and D) Peak fluorescence intensity values from spectra in 2A and 2B, respectively, plotted against buffered free Ca2+ concentration. F-Fmin (y-axis, 2C) is used for 470 nm excited fluorescence because baseline fluorescence in the 0 μM free Ca2+ buffer is the minimum fluorescence at this excitation wavelength. Alternatively, F-Fmax (y-axis, 2D) is used for 400 nm excited fluorescence because baseline fluorescence in the 0 μM free Ca2+ buffer is the maximum fluorescence at this excitation wavelength.
Fig 4
Fig 4. A four state model requires the quantitative characterization of each of the four distinct Ca2+-dependent states of GCaMP6m.
This model illustrates a simple four state equilibrium that includes all possible combinations of the Ca2+-saturated and Ca2+-free states of the sensor protein, as well as anionic and neutral forms of the chromophore. Indices: Anionic form (A); Neutral (N); Ca2+-free (0); Ca2+-saturated (+); Quantum yield (φ); extinction coefficient (ε); Gibbs free energy of the protein (G); dissociation constant for calmodulin in GCaMP6m with anionic chromophore (Kd(A)); dissociation for calmodulin in GCaMP6m with neutral chromophore (Kd(N)); Acid dissociation constant for chromophore in Ca2+-saturated state of GCaMP6m (Ka(+)); Acid dissociation constant for chromophore in Ca2+-free state of GCaMP6m (Ka(0)).
Fig 5
Fig 5. Alkaline titration makes it possible to measure the extinction coefficient of two different forms in the same sample.
A and B) Absorption spectra for alkaline titration of purified GCaMP6m protein in 0 μM free Ca2+ buffer (Ca2+-free, A) or 39 μM free Ca2+ buffer (Ca2+-saturated, B). Individual traces represent absorption spectra at different pH values. The final two colored traces and the first black trace for Ca2+-free sample (A) are marked with arrows. The last colored trace and first two black traces for Ca2+-saturated sample are marked with arrows (B). This boundary marks a significant pH dependent change in the shape of the absorption peak near 500 nm and the last spectrum where we see linear intercorrelation of the change in OD for the two peaks. Light grey arrows below traces mark the isosbestic points. The peak value at 447 nm (black trace), gives the total concentration of chromophore. Inset plots: Absorbance values for 403 nm versus 504 nm taken from the first 8 colored traces (from pH 7.15 to 9) of the absorption spectra for Ca2+-free GCaMP6m (A), and for 397 nm versus 497 nm taken from all of the colored traces (from pH 7.15 to 8.29) for Ca2+-saturated GCaMP6m (B). These plots illustrate the change in OD for the neutral form (397 nm or 403 nm) relative to the anionic (497 nm or 504 nm) form for the respective pH ranges. The red linear fit of the first 4 data points (from pH 7.15 to 7.90) for Ca2+-free (A) and all 5 data points for Ca2+-saturated (B) in the change in OD plots gives us the ratio of the extinction coefficients for the neutral and anionic forms in the given sample.
Fig 6
Fig 6. GCaMP6m has a single pKa for the Ca2+-saturated state and two pKa's for the Ca2+-free state.
Normalized 470 nm excited fluorescence intensity at 515 nm plotted against pH for Ca2+-saturated (solid circles) and Ca2+-free (open circles) states. A single-binding site model fit (green trace) was used for the Ca2+-saturated state and includes data points for one titration event from pH 4.3 to 8.39 with a pKa of 7.10 ± 0.01. A two-binding site model fit (red trace) was used for the Ca2+-free state and includes data points for two titration events from pH 4.3 to 10.5, the first with a pKa of 8.01 ± 0.01, and the second with a pKa of 10.08 ± 0.02.
Fig 7
Fig 7. Atom numbering for the GCaMP chromophore.
Fig 8
Fig 8. Two-photon excitation spectra for GCaMP6m.
Spectra are presented as a linear combination of the two individual two-photon action cross-section spectra: F2 (λ) = σ2,N (λ) φN ρN + σ2,A (λ) φA ρA, where σ2 (λ) is the wavelength-dependent two-photon excitation cross-section, φ is the fluorescence quantum yield, and ρ is the relative concentration of the chromophore species (neutral, N, or anionic, A). Ca2+-saturated (solid circles) and Ca2+-free (open circles).

References

    1. Chen T-W, Wardill TJ, Sun Y, Pulver SR, Renninger SL, Baohan A, et al. Ultrasensitive fluorescent proteins for imaging neuronal activity. Nature. 2013;499: 295–300. 10.1038/nature12354 - DOI - PMC - PubMed
    1. Boyd AM, Kato HK, Komiyama T, Isaacson JS. Broadcasting of cortical activity to the olfactory bulb. Cell Rep. 2015;10: 1032–1039. 10.1016/j.celrep.2015.01.047 - DOI - PMC - PubMed
    1. Dana H, Chen T-W, Hu A, Shields BC, Guo C, Looger LL, et al. Thy1-GCaMP6 transgenic mice for neuronal population imaging in vivo. PLoS One. 2014;9: e108697 10.1371/journal.pone.0108697 - DOI - PMC - PubMed
    1. Hinckley CA, Alaynick WA, Gallarda BW, Hayashi M, Hilde KL, Driscoll SP, et al. Spinal Locomotor Circuits Develop Using Hierarchical Rules Based on Motorneuron Position and Identity. Neuron. 2015;87: 1008–1021. 10.1016/j.neuron.2015.08.005 - DOI - PMC - PubMed
    1. Theis L, Berens P, Froudarakis E, Reimer J, Román Rosón M, Baden T, et al. Benchmarking Spike Rate Inference in Population Calcium Imaging. Neuron. 2016;90: 471–482. 10.1016/j.neuron.2016.04.014 - DOI - PMC - PubMed