Review
. 2017 Feb 8;93(3):491-507.
doi: 10.1016/j.neuron.2016.12.036.

Cracking the Neural Code for Sensory Perception by Combining Statistics, Intervention, and Behavior

Affiliations
Review

Cracking the Neural Code for Sensory Perception by Combining Statistics, Intervention, and Behavior

Stefano Panzeri et al. Neuron. .

Abstract

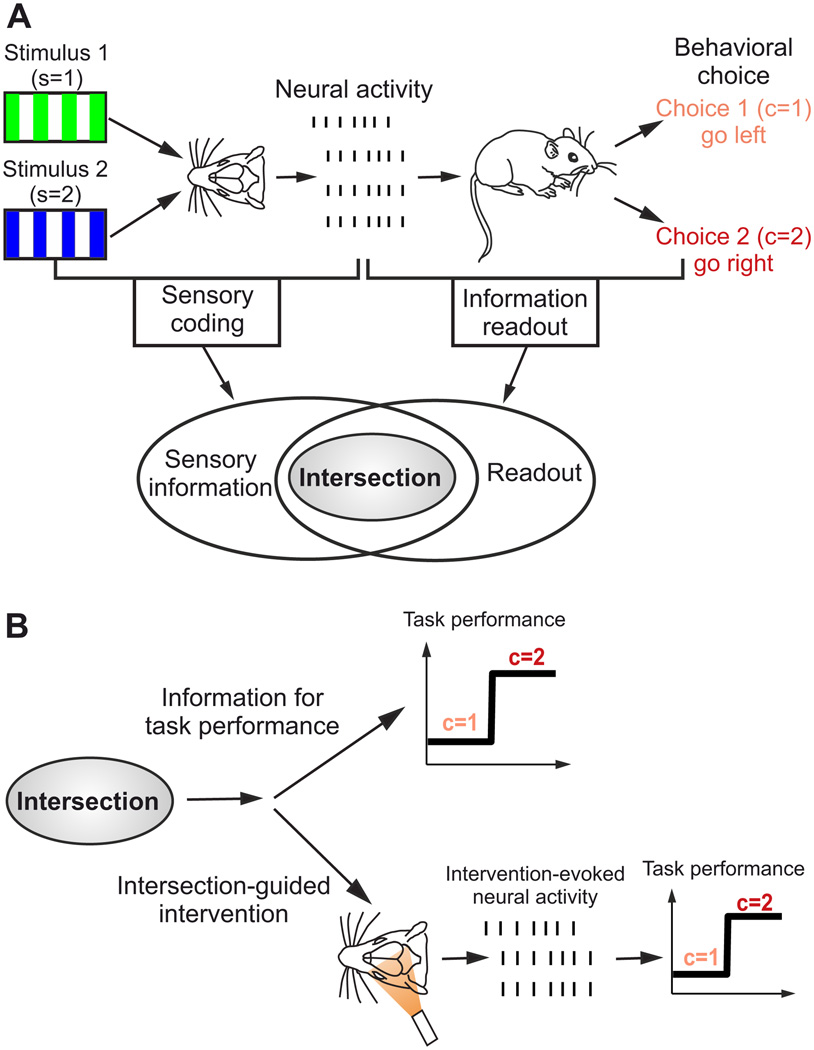
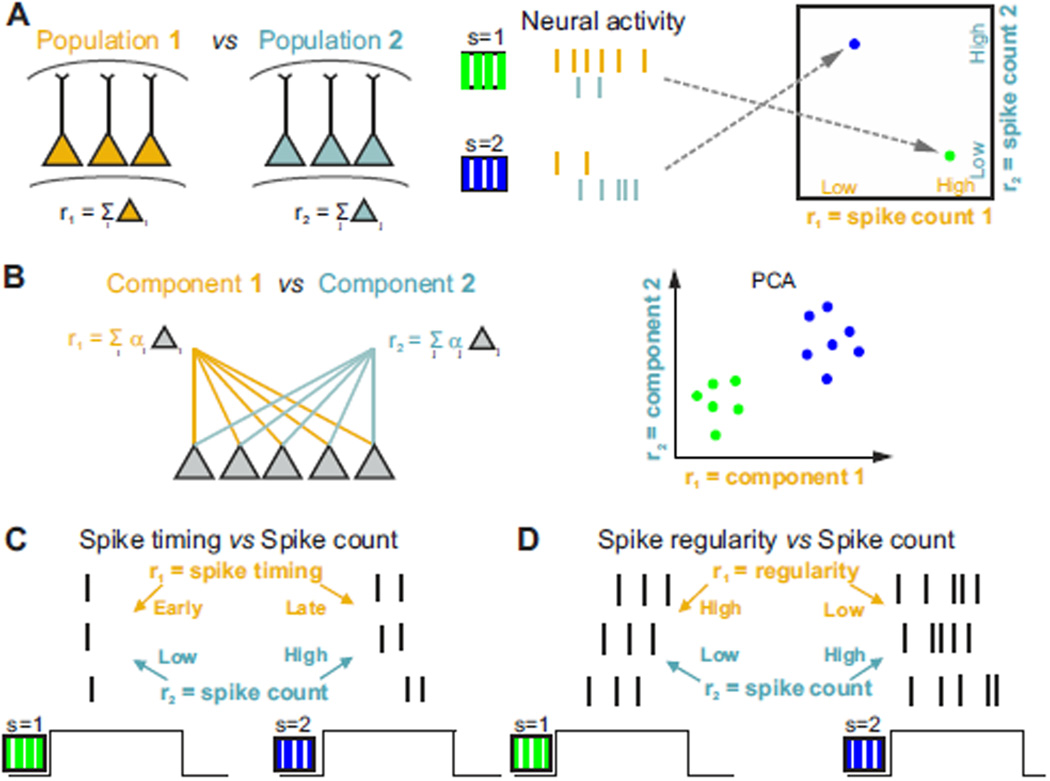
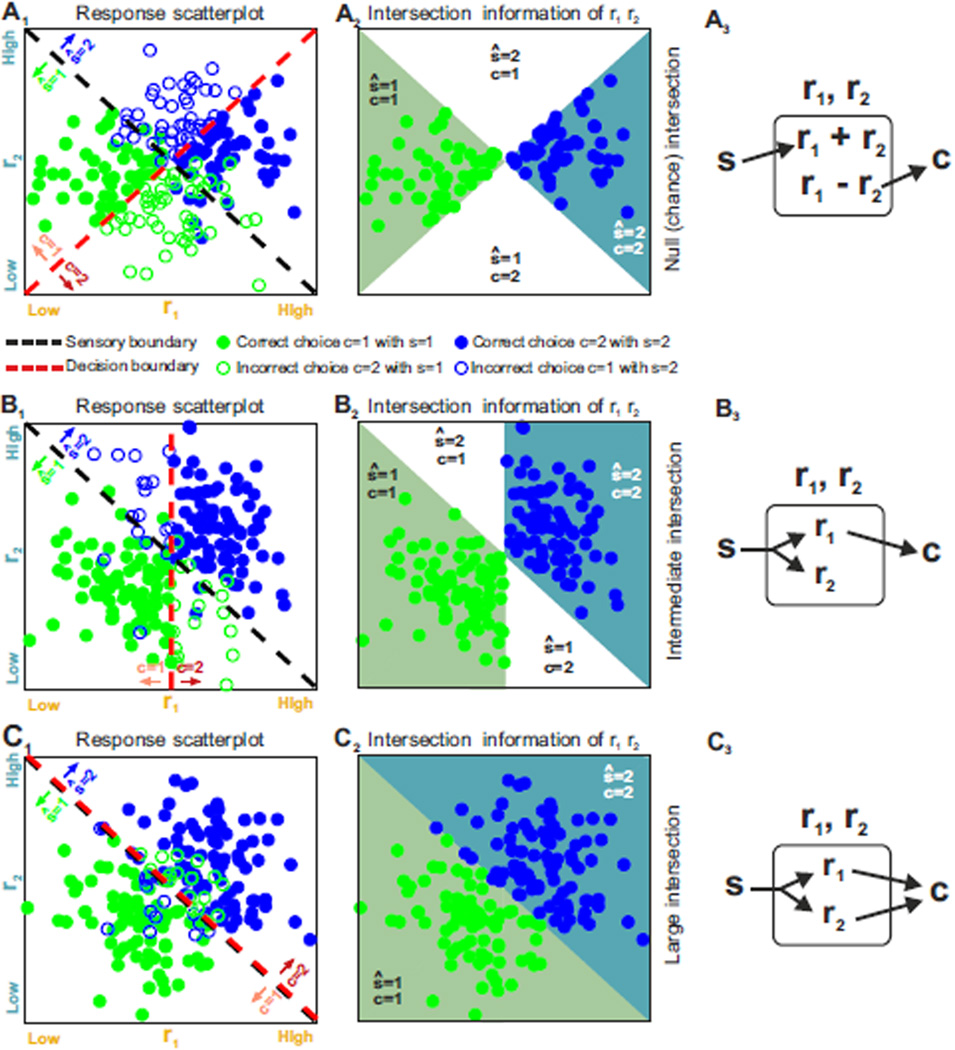
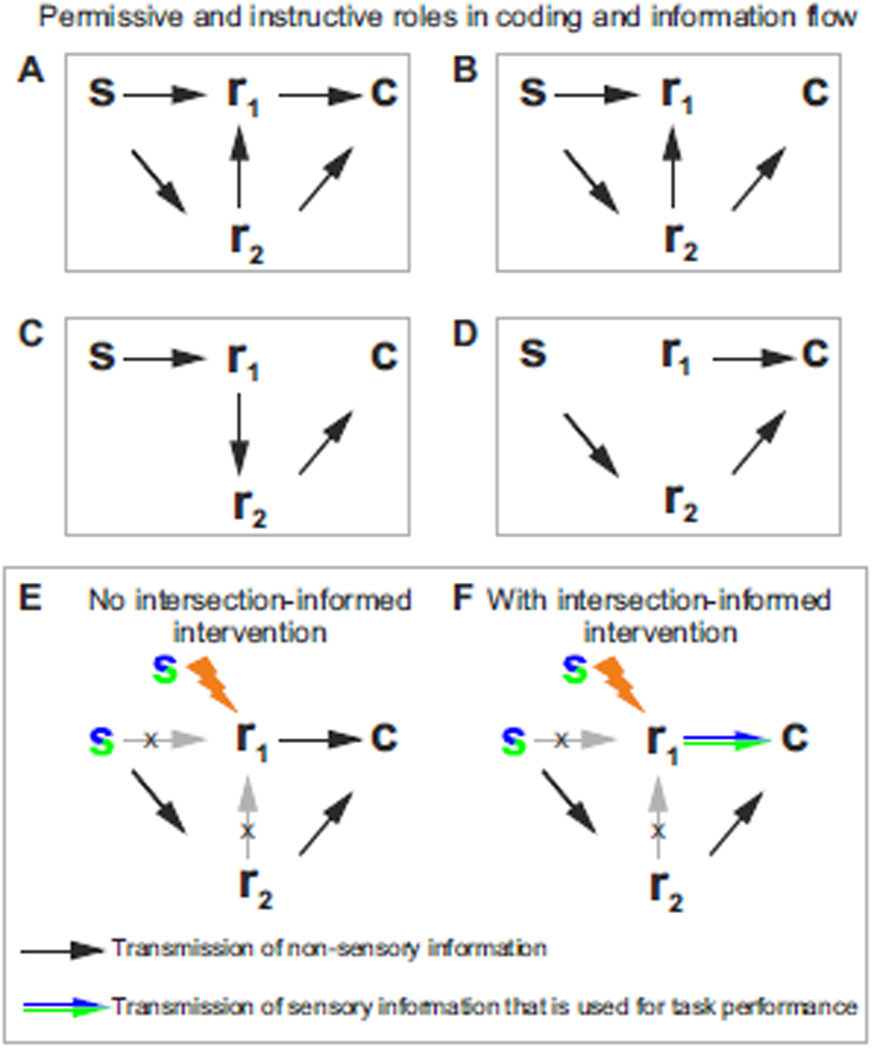
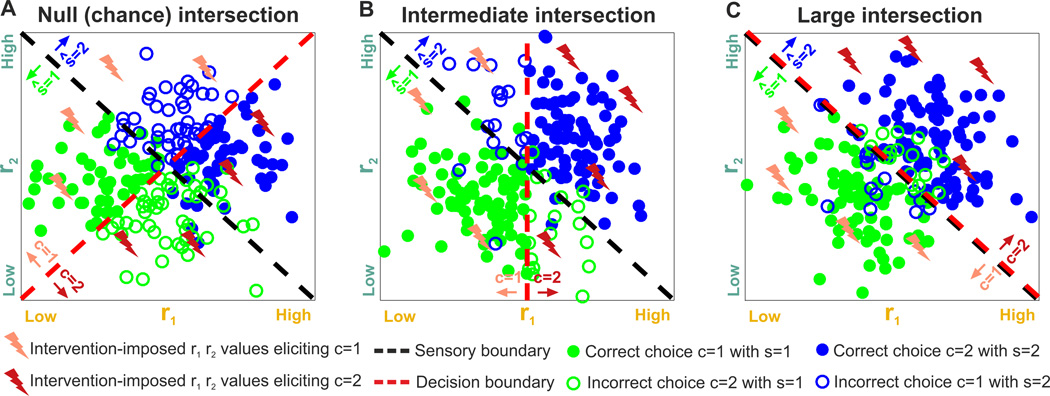
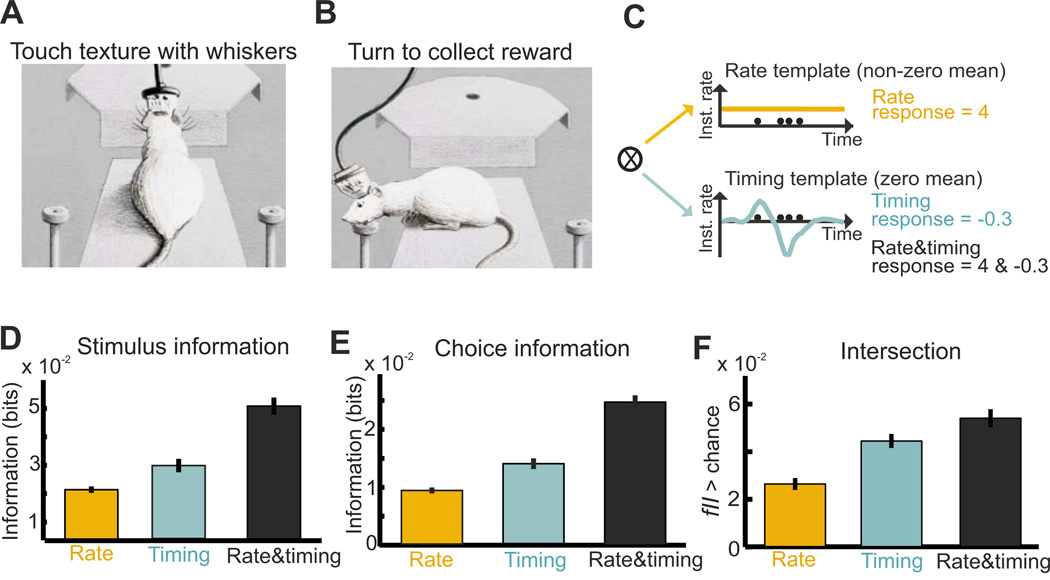
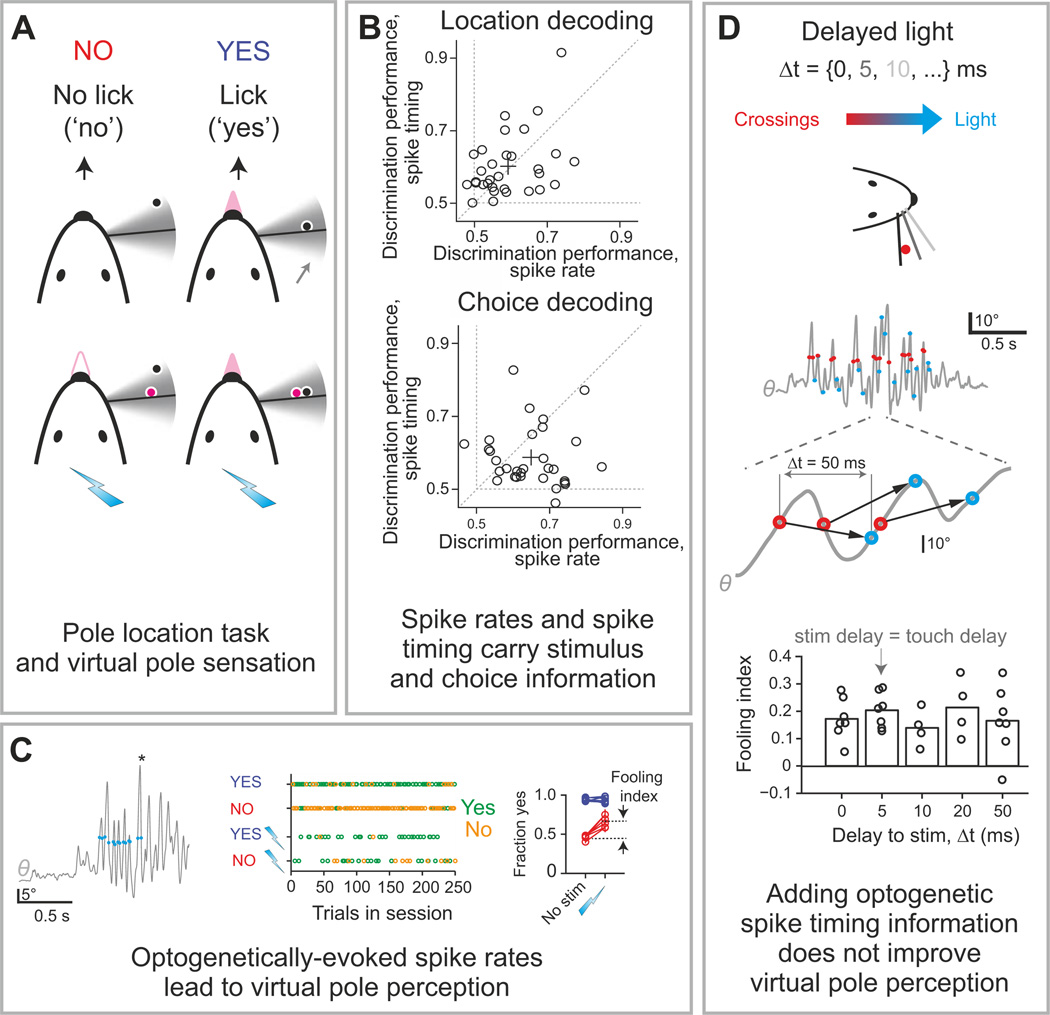
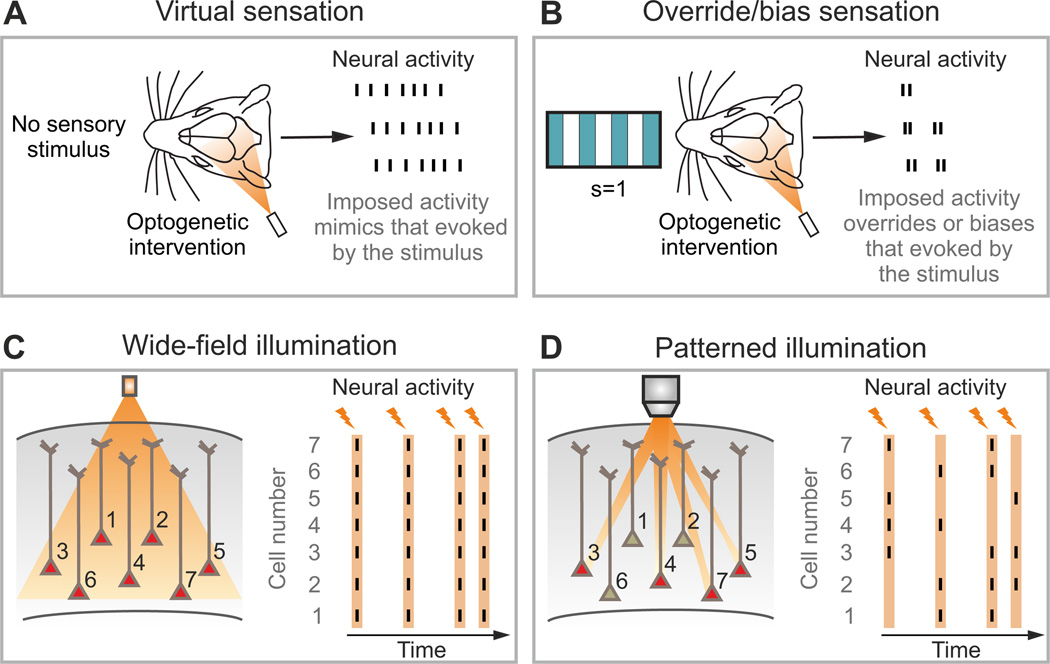
The two basic processes underlying perceptual decisions-how neural responses encode stimuli, and how they inform behavioral choices-have mainly been studied separately. Thus, although many spatiotemporal features of neural population activity, or "neural codes," have been shown to carry sensory information, it is often unknown whether the brain uses these features for perception. To address this issue, we propose a new framework centered on redefining the neural code as the neural features that carry sensory information used by the animal to drive appropriate behavior; that is, the features that have an intersection between sensory and choice information. We show how this framework leads to a new statistical analysis of neural activity recorded during behavior that can identify such neural codes, and we discuss how to combine intersection-based analysis of neural recordings with intervention on neural activity to determine definitively whether specific neural activity features are involved in a task.

Keywords: behavior; choice; information; neural coding; optogenetics; population coding.


Figures

Figure 1
Figure 1. Intersection information helps combining statistics, neural recordings, behavior and intervention to crack the neural code for sensory perception
A) Schematic showing two crucial stages in the information processing chain for sensory perception: sensory coding and information readout. In this example an animal must discriminate between two stimuli of different color (s=1, green and s=2, blue) and make an appropriate choice (c=1, pink and c=2, red). Sensory coding expresses how different stimuli are encoded by different neural activity patterns. Information readout is the process by which information is extracted from single-trial neural population activity to inform behavioral choice. The intersection between sensory coding and information readout is defined as the features of neuronal activity that carry sensory information that is read out to inform a behavioral choice. Note that, as explained in the main text, a neural feature may show both sensory information and choice information but have no intersection information; this is visualized here by plotting the intersection information domain in the space of neural features as smaller than the overlap between the sensory coding and information readout domains. B) Only information at the intersection between sensory coding and readout contributes to task performance. Neural population response features that belong to this intersection can be identified by statistical analysis of neural recordings during behavior. Interventional (e.g. optogenetics) manipulations of neural activity informed by statistical analysis of sensory information coding can then be used to causally probe the contribution of neural features to task performance at this intersection.
Figure 2
Figure 2. Schematic of possible pairs of neural population features involved in sensory perception
A) Features r1 and r2 are the pooled firing rates of two neuronal populations (yellow and cyan) that encode two different visual stimuli (s=1, green; and s=2, blue). Values of single-trial responses of each population response feature can be represented as dots in the two-dimensional plot of spike count variables in the r1,r2 space (rightmost panel in A). B) Features r1 and r2 are low-dimensional projections of large-population activity (computed for example with PCA as weighted sum of the rates of the neurons). C) Features r1 and r2 are spike timing and spike count of a neuron. D) Features r1 and r2 are the temporal regularity of the spike train of a neuron and spike count.
Figure 3
Figure 3. Impact of response features on sensory coding, readout, and intersection information
In the left panels A1,B1,C1 we illustrate stimulus and choice dependences of two hypothetical neural features, r1 and r2, with scatterplots of simulated neural responses to two stimuli, s=1 or s=2. The dots are color-coded: green if s=1 and blue if s=2. Dashed black and red lines represent the sensory and decision boundaries, respectively. The region below the sensory boundary corresponds to responses that are decoded correctly from features r1,r2 if the green stimulus is shown; the region above the sensory boundary corresponds to responses that are decoded correctly if the blue stimulus is shown. Filled circles correspond to correct behavioral choices; open circles to wrong choices. Panels A2,B2,C2 plot only the trials that contribute to the calculation of intersection information. Those are the behaviorally correct trials (filled circles) in the two regions of the r1, r2 plane regions in which the decoded stimulus ŝ and the behavioral choice are both correct. Each region is color coded with the color of the stimulus color that contributes to it. White regions indicate portion of the r1,r2 plane that cannot contribute to the intersection because for these responses either the decoded stimulus or choice is incorrect. The larger the colored areas and the number of dots included in panels A2,B2,C2 the larger the intersection information. Panels A3,B3,C3 plot a possible neural circuit diagram that could lead to the considered result. In these panels s indicates the sensory stimulus, ri indicate the neural features and c the readout neural system, and arrows indicate directed information transfer A1–3) No intersection information (the sensory and decision boundary are orthogonal). B1–3) Intermediate intersection information (the sensory and decision boundary are partly aligned). C1–3) Large intersection (the sensory and decision boundary are fully aligned).
Figure 4
Figure 4. Causal manipulations to study the permissive and instructive roles in coding and information flow
A–D) Interventional approaches can be used to disambiguate among different conditions: A) the neural feature r1 and r2 carry significant information about the stimulus, s, and provide essential stimulus information to the decision readout, c. B) r1 does not send information to c, but only receives a copy of the information via r2, which does send stimulus information to c. C) r1 provides instructive information about s to r2 and r2 informs c instructively; D) r1 influences c but does not directly carry information about s. E–F) Interventional approaches can be used to reveal cases in which r1 informs c but does not send stimulus information that contributes to task performance (black arrow in E) from cases in which r1 sends stimulus information used for decisions (colored arrow in F).
Fig 5
Fig 5. Schematic of an experimental design to probe intersection information with intervention
Three examples of neural responses (quantified by features r1, r2) to two stimuli, with conventions as in Fig. 3. We assume that some patterns of neural activity are evoked by interventional manipulation in some other trials. The “lightning bolts” indicate activity patterns in r1, r2 space evoked by intervention: they are color-coded with the choice that they elicited (as determined by the decision boundary – the dashed red line). Choice c=1 is color-coded as pink, and c=2 as dark red. The choices evoked by the intervention can be used to determine, in a causal manner, the position of the decision boundary (as the line separating different choices). The correspondence between the stimulus that would be decoded from the neural responses to the intervention-induced choice can be used to compute interventional intersection information. A) A case with no interventional intersection information (the sensory and decision boundary are orthogonal). B) A case with intermediate intersection (the sensory and decision boundary are partly aligned). C) A case with large intersection (the sensory and decision boundary are fully aligned).
Figure 6
Figure 6. Examples of statistical intersection measures in a texture discrimination task
This figure shows how spike timing and spike count in primary somatosensory cortex encode textures of objects, and how this information contributes to whisker-based texture discrimination. A–B) Schematic of the texture discrimination task. A) On each trial, the rat perched on the edge of the platform and extended to touch the texture with its whiskers. B) Once the animal identified the texture, it turned to the left or the right drinking spout, where it collected the water reward. C) Schematic of the computation of spike count and spike timing signals in single trials. D–F) The mean ± SEM (over n=459 units recorded in rat primary somatosensory cortex) of texture information (D), choice information (E), and fraction of intersection information fII (F). Modified with permission from (Zuo et al., 2015).
Figure 7
Figure 7. Examples of statistical and interventional intersection measures with sensory and illusory touches
This figure shows results of the statistical and interventional test of the role of cortical spike timing and spike count in the neural code for whisker-based object location. The test involved closed-loop optogenetic stimulation causing illusory perception of object location. A) Schematic of the task: four trial types during a closed-loop optogenetic stimulation behavior session depending on pole location and optogenetic stimulation (cyan lightning bolts). A “virtual pole” (magenta) was located within the whisking range (gray area). Mice reported object location by licking or not licking. B) Decoding object location and behavioral choice from electrophysiologically recorded spikes in layer 4 of somatosensory cortex. Each dot corresponds to the decoding performance (fraction correct) of one neuron. C) Optogenetically-imposed spike rates evoked virtual pole sensation. Left: Optogenetic stimulation (blue circles) coupled to whisker movement (gray, whisking angle θ) during object location discrimination. Asterisk, answer lick. Middle: Responses in the four trial types across one behavioral session. Green, yes responses; gold, no responses. Right: Optogenetic stimulation in NO trials (red), but not in YES trials (blue), in barrel cortex increases the fraction of yes responses. Lightning bolt and “no stim” labels indicate the presence and absence of optogenetic stimulation, respectively. Error bars, s.e.m. Each line represents an individual animal. D) Adding timing information in the optogenetically evoked activity did not improve virtual pole perception. Top: delayed optogenetic stimulation was triggered by whisker crossing with variable delays, Δt. Middle: whisker movements with whisker crossing (red circles) and corresponding optogenetic stimuli (cyan circles) for Δt=50 ms. Bottom: fooling index (fraction of trials reporting sensing of a virtual pole) as function of Δt. Modified with permission from (O'Connor et al., 2013).
Figure 8
Figure 8. Experimental configurations for interventional optogenetic approaches
A) In a virtual sensation experiment, the animal behavior is tested applying the optogenetic intervention in the absence of the external sensory stimulus. B) Alternatively, optogenetic intervention can be paired with sensory stimulation with the aim to overriding or biasing neural activity evoked by the sensory stimulus. C) In the wide-field configuration for optogenetic manipulation, light is delivered with no spatial specificity within the illuminated area, resulting in the activation (red cells) of most opsin-positive neurons. Stimulation in this regime may lead to over-synchronous neural responses (right panel). The orange lightning bolts in the right panel indicate the time at which successive stimuli are applied. The neurons displayed in panels C–D are meant to represent a population of N neurons expressing the opsins and their number is here limited to 7 for presentation purposes only. D) Patterned illumination permits the delivery of photons precisely in space. When multiple and diverse light patterns are consecutively delivered (orange lightning bolts), optical activation of neural networks with complex spatial and temporal patterns becomes possible (right panel).

References

    1. Ahmadian Y, Packer AM, Yuste R, Paninski L. Designing optimal stimuli to control neuronal spike timing. J Neurophysiol. 2011;106:1038–1053. - PMC - PubMed
    1. Averbeck BB, Latham PE, Pouget A. Neural correlations, population coding and computation. Nat Rev Neurosci. 2006;7:358–366. - PubMed
    1. Baden T, Berens P, Franke K, Roson MR, Bethge M, Euler T. The functional diversity of retinal ganglion cells in the mouse. Nature. 2016;529:345–349. - PMC - PubMed
    1. Baker CA, Elyada YM, Parra A, Bolton MM. Cellular resolution circuit mapping with temporal-focused excitation of soma-targeted channelrhodopsin. eLife. 2016;5 - PMC - PubMed
    1. Bovetti S, Fellin T. Optical dissection of brain circuits with patterned illumination through the phase modulation of light. J Neurosci Meth. 2015;241:66–77. - PubMed