

Diversity and regulatory impact of copy number variation in the primate Macaca fascicularis
- PMID: 28183275
- PMCID: PMC5301398
- DOI: 10.1186/s12864-017-3531-y
Diversity and regulatory impact of copy number variation in the primate Macaca fascicularis
Abstract
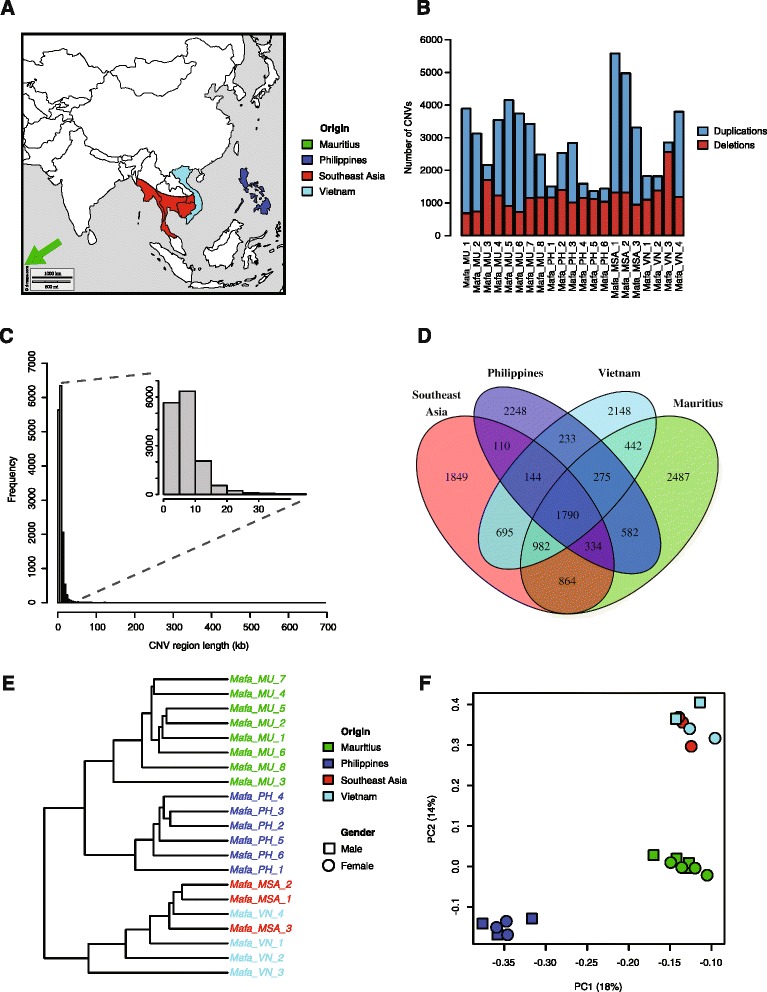
Background: Copy number variations (CNVs) are a significant source of genetic diversity and commonly found in mammalian genomes. We have generated a genome-wide CNV map for Cynomolgus monkeys (Macaca fascicularis). This crab-eating macaque is the closest animal model to humans that is used in biomedical research.
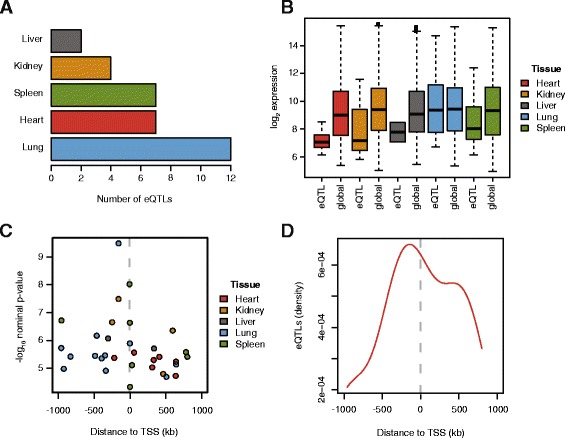
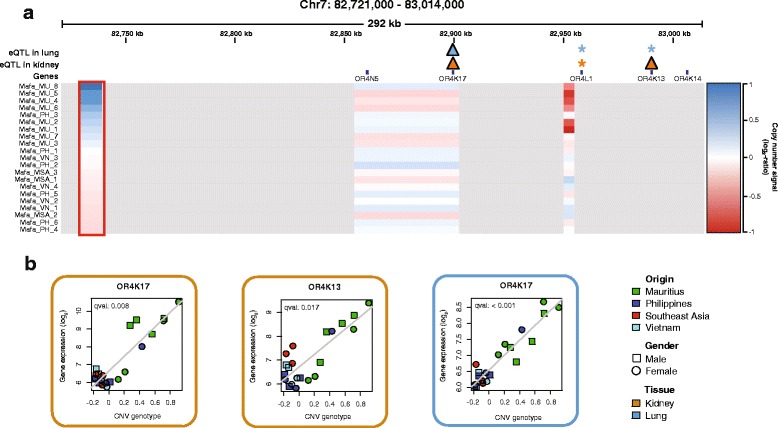
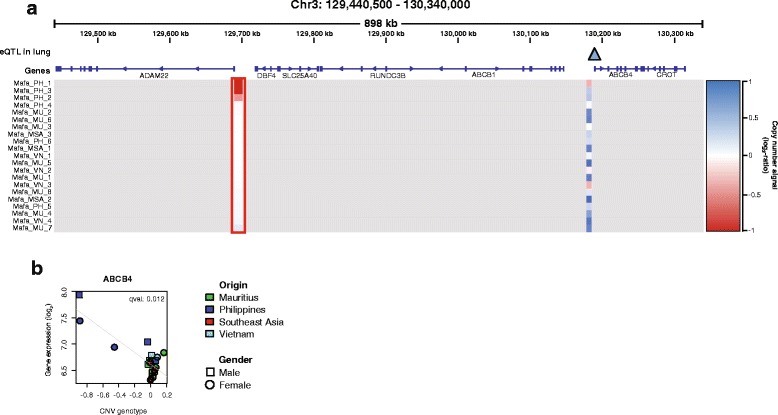
Results: We show that Cynomolgus monkey CNVs are in general much smaller in size than gene loci and are specific to the population of origin. Genome-wide expression data from five vitally important organs demonstrates that CNVs in close proximity to transcription start sites associate strongly with expression changes. Among these eQTL genes we find an overrepresentation of genes involved in metabolism, receptor activity, and transcription.
Conclusion: These results provide evidence that CNVs shape tissue transcriptomes in monkey populations, potentially offering an adaptive advantage. We suggest that this genetic diversity should be taken into account when using Cynomolgus macaques as models.
Keywords: CNV; Cynomolgus monkey; Gene expression; Olfactory receptors; eQTL.
Figures
Similar articles
-
Genomic Copy Number Variation Study of Nine Macaca Species Provides New Insights into Their Genetic Divergence, Adaptation, and Biomedical Application.Genome Biol Evol. 2020 Dec 6;12(12):2211-2230. doi: 10.1093/gbe/evaa200. Genome Biol Evol. 2020. PMID: 32970804 Free PMC article.
-
Tissue-Specific eQTL in Zebrafish.Methods Mol Biol. 2020;2082:239-249. doi: 10.1007/978-1-0716-0026-9_17. Methods Mol Biol. 2020. PMID: 31849020
-
Single nucleotide polymorphisms (SNPs) are highly conserved in rhesus (Macaca mulatta) and cynomolgus (Macaca fascicularis) macaques.BMC Genomics. 2007 Dec 31;8:480. doi: 10.1186/1471-2164-8-480. BMC Genomics. 2007. PMID: 18166133 Free PMC article.
-
Copy number variation in the genomes of domestic animals.Anim Genet. 2012 Oct;43(5):503-17. doi: 10.1111/j.1365-2052.2012.02317.x. Epub 2012 Mar 6. Anim Genet. 2012. PMID: 22497594 Review.
-
Role and ethics of cynomolgus monkey (Macaca fascicularis) blastoids in primate developmental biology research.J Med Primatol. 2024 Apr;53(2):e12693. doi: 10.1111/jmp.12693. J Med Primatol. 2024. PMID: 38374540 Review.
Cited by
-
Genomic Copy Number Variation Study of Nine Macaca Species Provides New Insights into Their Genetic Divergence, Adaptation, and Biomedical Application.Genome Biol Evol. 2020 Dec 6;12(12):2211-2230. doi: 10.1093/gbe/evaa200. Genome Biol Evol. 2020. PMID: 32970804 Free PMC article.
-
Identification and population genetic analyses of copy number variations in six domestic goat breeds and Bezoar ibexes using next-generation sequencing.BMC Genomics. 2020 Nov 27;21(1):840. doi: 10.1186/s12864-020-07267-6. BMC Genomics. 2020. PMID: 33246410 Free PMC article.
-
Broadening primate genomics: new insights into the ecology and evolution of primate gene regulation.Curr Opin Genet Dev. 2020 Jun;62:16-22. doi: 10.1016/j.gde.2020.05.009. Epub 2020 Jun 20. Curr Opin Genet Dev. 2020. PMID: 32569794 Free PMC article. Review.
-
HapCNV: A Comprehensive Framework for CNV Detection in Low-input DNA Sequencing Data.bioRxiv [Preprint]. 2025 Jan 7:2024.12.19.629494. doi: 10.1101/2024.12.19.629494. bioRxiv. 2025. PMID: 39763944 Free PMC article. Preprint.
References
Publication types
MeSH terms
LinkOut - more resources
Full Text Sources
Other Literature Sources
