. 2017 Feb 28;114(9):E1717-E1726.
doi: 10.1073/pnas.1617533114. Epub 2017 Feb 9.

Ca2+-binding protein 2 inhibits Ca2+-channel inactivation in mouse inner hair cells

Affiliations

Ca2+-binding protein 2 inhibits Ca2+-channel inactivation in mouse inner hair cells

Maria Magdalena Picher et al. Proc Natl Acad Sci U S A. .

Abstract

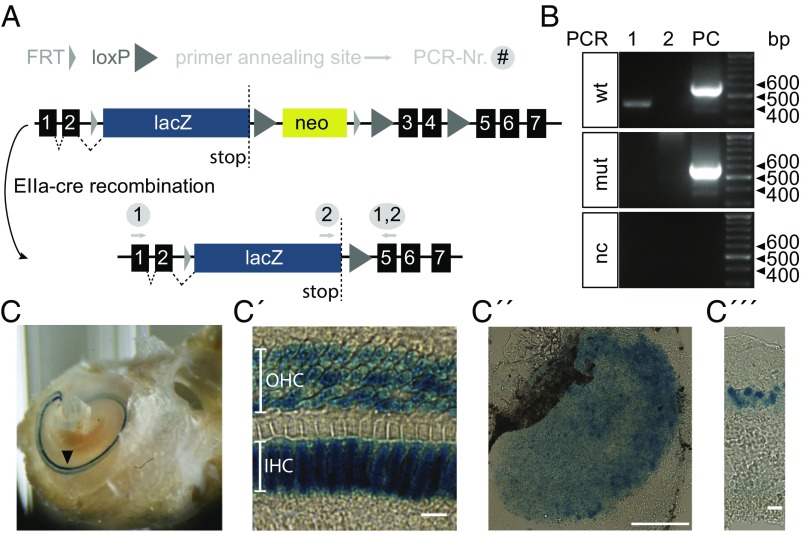
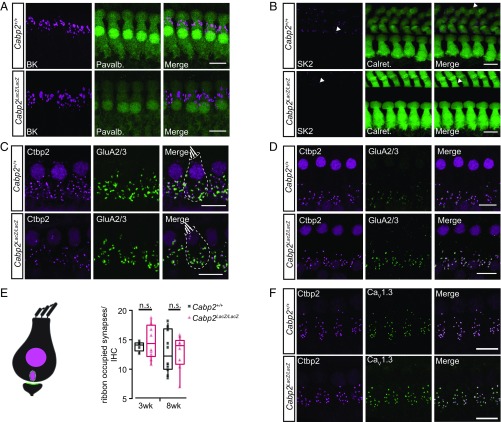
Ca2+-binding protein 2 (CaBP2) inhibits the inactivation of heterologously expressed voltage-gated Ca2+ channels of type 1.3 (CaV1.3) and is defective in human autosomal-recessive deafness 93 (DFNB93). Here, we report a newly identified mutation in CABP2 that causes a moderate hearing impairment likely via nonsense-mediated decay of CABP2-mRNA. To study the mechanism of hearing impairment resulting from CABP2 loss of function, we disrupted Cabp2 in mice (Cabp2LacZ/LacZ ). CaBP2 was expressed by cochlear hair cells, preferentially in inner hair cells (IHCs), and was lacking from the postsynaptic spiral ganglion neurons (SGNs). Cabp2LacZ/LacZ mice displayed intact cochlear amplification but impaired auditory brainstem responses. Patch-clamp recordings from Cabp2LacZ/LacZ IHCs revealed enhanced Ca2+-channel inactivation. The voltage dependence of activation and the number of Ca2+ channels appeared normal in Cabp2LacZ/LacZ mice, as were ribbon synapse counts. Recordings from single SGNs showed reduced spontaneous and sound-evoked firing rates. We propose that CaBP2 inhibits CaV1.3 Ca2+-channel inactivation, and thus sustains the availability of CaV1.3 Ca2+ channels for synaptic sound encoding. Therefore, we conclude that human deafness DFNB93 is an auditory synaptopathy.

Keywords: Ca2+ channel; hearing impairment; inner hair cell; ribbon synapse; synaptopathy.


Conflict of interest statement

The authors declare no conflict of interest.

Figures

Fig. 1.
Fig. 1.
A previously unidentified mutation in CABP2 causes moderate-to-severe hearing impairment. (A) Pedigree and segregation of the c.466G > T (p.E156X) mutation in a family with hearing-impaired children. Dates of birth (b.) of the common ancestors were ascertained from historical marriage registers and are reported under their symbols. (B) Genotyping of test subjects revealed a nonsense mutation in CABP2: results of sequencing CABP2 exon-5 c.460–474 in the proband (subject III:1; Top), his father (subject II:2; Middle), and one of his unaffected brothers (subject III:2; Bottom). Nomenclature is based on NM 016366.2 and NP 057450.2. The mutated nucleotide is highlighted in magenta. Codon 156 is the last one indicated. (C) Binaural mean air conduction thresholds of the proband (subject III:1; circles) and his sister (subject III:3; squares). Hearing loss is symmetrical and more pronounced in the middle frequencies. (D) Schematic description of CABP2, consisting of seven exons, with the c.466G > T mutation indicated by the black arrow. A mutation in exon 5 is predicted to lead to nonsense-mediated decay (NMD). (E) Shared haplotype (7.35 Mb) encompassing the c.466G > T transversion in the mutation-bearing paternal and maternal alleles inherited by the children.
Fig. 2.
Fig. 2.
Cabp2 is expressed in hair cells of the inner ear and in the retina. (A) Schematic of IRES:LacZ Cabp2 trapping cassette with loxP sites flanking the neomycin resistance and exons 3 and 4 of Cabp2. Exon 2 is not expressed in the short Cabp2 isoform. EIIa-cre recombination induces the removal of the neomycin cassette and critical exons, resulting in a LacZ-tagged null allele. RT-PCR primer (Table S1) annealing sequences are shown by gray arrows and are provided with the respective PCR number (Nr.) they were used for. (B) RT-PCR of the apical turn of the organ of Corti comparing Cabp2 mRNA expression in Cabp2+/+ and Cabp2LacZ/LacZ mice, respectively. Primer annealing regions are located in exon 1 and exon 5 (PCR1, positive in Cabp2+/+) or in the LacZ sequence and exon 5 (PCR2: negative upon Cabp2 deletion). In Cabp2+/+, one band at 418 base pairs (bp) was identified, confirming the expression of the long-CaBP2 isoform in the organ of Corti. The absence of a band in PCR1 and PCR2 of Cabp2LacZ/LacZ tissue confirms the truncation of Cabp2 (n = 3 animals). GAPDH was used as a positive control (PC; 572 bp) mut, Cabp2LacZ/LacZ; nc, negative control (water). (C) β-Galactosidase staining of the cochlea, utricle, and retina of Cabp2LacZ/LacZ mice is shown. IHCs, OHCs (C and C′) and vestibular hair cells (C′′) were LacZ-positive. (Scale bars: C′, 20 μm; C′′, 500 μm.) (C′′′) In retinal slices, the LacZ signal was detected in the inner nuclear layer. (Scale bar: 20 μm.)
Fig. S1.
Fig. S1.
Cabp2 mutagenesis, Cabp2 expression in the ear and eye, and normal retinal function. (A) Schematic of sequenced ranges of the IRES:LacZ trapping cassette in which the 5′ and 3′ target alleles were amplified by long-range PCR (black line). Sequencing primer alignment sites are illustrated by the gray arrows, and the sequenced regions are illustrated by the black double-ended arrows. (B) Electrophoresis results of the amplified 5′ and 3′ DNA bands for clones 1–4, indicating the presence of the sequenced DNA bands at the correct height. Negative control: PCR products in the absence of DNA. (C) Immunostaining of retinal slice labeling horizontal and amacrine cells with calbindin (magenta) and β-galactosidase (β-Galac., green) as a marker for Cabp2-expressing cells. Calbindin and β-galactosidase staining seems to overlap. OS, outer segment of rod and cone layer; ONL, outer nuclear layer; OPL, outer plexiform layer; INL, inner nuclear layer; IPL, inner plexiform layer; GCL, ganglion cell layer. (Scale bar: 10 μm.) (D) Comparable ABR thresholds between Cabp2+/+ and Cabp2+/LacZ mice at the age of P56–P63, indicating a recessive trait of the hearing loss in Cabp2-deficient mice: average ABR thresholds (lines and markers) ± SEM (shaded areas). n.s., no significant difference: P > 0.05; Holm–Sidak t test. (E) Grand averages (lines) ± SEM (shaded areas) of ERG traces of Cabp2LacZ/LacZ (n = 4) and Cabp2+/+ (n = 4) mice, showing comparable A- and B-wave amplitudes at a light flash intensity of 0.28 cd * s/m2 in mice that were dark-adapted overnight.
Fig. 3.
Fig. 3.
Synaptic hearing impairment in Cabp2LacZ/LacZ mice. (A) Grand averages (lines) and SEMs (shaded areas) of ABR waveform responses to 80-dB click stimuli at a stimulus rate of 20 Hz in Cabp2+/+ (n = 9) and Cabp2LacZ/LacZ (n = 7) mice at P49–P63. Roman numerals on top of the ABR graph denote the Jewett ABR waves. Note the decrease in amplitude and delay of wave I in Cabp2-deficient mice compared with Cabp2+/+ mice. (B) Elevated ABR thresholds in P49–P63 mice. Tone bursts are presented at a stimulus rate of 40 Hz and clicks at 20 or 100 Hz. Error bars represent SEM, and P values are indicated with asterisks (**P < 0.01, ***P < 0.001; Holm–Sidak t test) and 20- and 100-Hz click stimuli (***P < 0.001, Holm–Sidak t test). (C) DPOAE thresholds (defined as the interpolated f2 intensity required to elicit a DPOAE of 10-dB SPL) for Cabp2LacZ/LacZ (seven individual traces shown in purple, mean shown in magenta) and Cabp2+/+ (nine individuals shown in gray, mean shown in black) mice. The dashed line indicates the maximum loudspeaker output of 70 dB. DPOAE thresholds were comparable between genotypes (P > 0.05, two-way ANOVA). (D) Mean DPOAE growth functions for Cabp2LacZ/LacZ (n = 8) and Cabp2+/+ (n = 9) mice at f1 = 9.4 kHz and f2 = 11.3 kHz are shown. DPOAEs were comparable between both genotypes at the age of 8 wk, indicating intact active cochlear amplification in Cabp2-deficient mice (P > 0.05, two-way ANOVA). Error bars represent SEM. n.s., P > 0.05.
Fig. S2.
Fig. S2.
Normal number and gross molecular anatomy of IHCs and their ribbon synapses in Cabp2LacZ/LacZ mice. (A) Representative maximum projection of immunostaining for large-conductance Ca2+-activated K+ channels (BK, magenta) and parvalbumin-α (Pavalb., green) of mice at the age of P15. BK channels are clustered in the neck region of Cabp2LacZ/LacZ and Cabp2+/+ IHCs, indicating normal development. (Scale bars: 10 μm.) (B) Representative maximum projection of immunostaining for small-conductance Ca2+-activated K+ channels (SK2, magenta) and calretinin (Calret., green) of Cabp2LacZ/LacZ and Cabp2+/+ IHCs showing that SK2 puncta are restricted to OHCs and lacking in IHCs. The white arrowheads indicate SK2 channel puncta in OHCs. (Scale bars: 10 μm.) (C) Representative synapse immunostaining of Cabp2+/+ and Cabp2LacZ/LacZ IHCs of P21–P28 animals. Ribbon-occupied synapses were identified by colocalized presynaptic ribbon (RIBEYE/Ctbp2, magenta) and a postsynaptic bouton (GluA2/3, green). (Scale bars: 10 μm.) (D) Same experimental design as in C was also applied to organs of Corti of P56–P63 mice. (Scale bars: 10 μm.) (E, Left) Ribbon-occupied synapses are identified as juxtaposed spots of RIBEYE/Ctbp2 and GluA2/3 immunofluorescence (schematic with one exemplary synapse drawn). (E, Right) Quantification of ribbon-occupied synapses/IHC for Cabp2+/+ and Cabp2LacZ/LacZ IHCs of both age groups: No significant differences (n.s.) in synapse numbers were detected between genotypes of the respective age (3 wk: Wilcoxon rank sum test; 8 wk: Student’s t test). For all four conditions, organs of Corti of four animals were used. (F) Representative immunostaining of Ca2+ channels (CaV1.3, green) and the presynaptic ribbon (RIBEYE/Ctbp2, magenta) showing proper cluster formation of CaV1.3 at the active zone for Cabp2LacZ/LacZ and Cabp2+/+ IHCs. (Scale bars: 10 μm.)
Fig. S3.
Fig. S3.
CABP2 does not alter membrane expression of the long-splice variant of CaV1.3 (CaV1.342) but enhances the voltage sensitivity and inhibits inactivation of CaV1.3 in HEK 293/hSK3-1 cells. (A) Mean current–voltage relationship (lines) ± SEM (shaded areas) of HEK 293/hSK3-1 cells transfected with either CaV1.342 Ca2+ channel alone (magenta, n = 10) or in the presence of CABP2 (black/gray, n = 10) with comparable maximum current densities (Imax: P > 0.05, Wilcoxon rank sum test). Vm, membrane potential; current density: Ca2+-current normalized to the cell capacitance in pA/pF. (B) Mean fractional activation curve derived from A. Note the hyperpolarizing shift and steeper slope of the activation curve in the presence of CABP2 (V0.5: P < 0.001, Wilcoxon rank sum test; kact: P < 0.001, Wilcoxon rank sum test). (C) Peak-normalized mean Ca2+-current traces elicited by 500-ms depolarizations to VImax. Note that CABP2 prevents Ca2+-current inactivation. VImax, voltage of maximal Ca2+-current; Ipeak, peak current. (D) Box plot and single-value plot of residual Ca2+ currents after 500 ms (I500,Ca) shows elevated I500,Ca values under CABP2 coexpression (***P < 0.001, Wilcoxon rank sum test). (E) Ca2+-current inactivation was independent of current density in the presence of CABP2 [black line is a line fit with a slope of −0.00003 ± 0.00012 pA/pF and is not obviously correlated to the current density in control recordings of CaV1.342 alone (slope: 0.00082 ± 0.00096 pA/pF)].
Fig. 4.
Fig. 4.
Enhanced Ca2+-current inactivation in Cabp2-deficient IHCs of 5-wk-old mice recorded in near-physiological conditions. (A) Representative Ca2+-current traces of Cabp2+/+ (Top) and Cabp2LacZ/LacZ (Bottom) IHCs of P39 and P44 animals. (B) Comparable current–voltage (I-V) relationships of Cabp2+/+ (n = 8) and Cabp2LacZ/LacZ (n = 11) IHCs. Traces are depicted as mean ± SEM (shaded area). Vm, membrane potential. (C) Average activation curve derived from B shows comparable voltage dependence of activation between both genotypes (mean ± SEM). (D, Left) Experimental paradigm and representative Ca2+-current (ICa) traces of Cabp2+/+ (Top) and Cabp2LacZ/LacZ (Bottom) IHCs overlaid by exponential fit to determine activation kinetics. (D, Right) Quantification of activation time (Tactivation) constants showing comparable results for Cabp2LacZ/LacZ and Cabp2+/+ IHCs (Wilcoxon rank sum test). (E, Left) Experimental paradigm and representative Ca2+-current traces of Cabp2+/+ (Top) and Cabp2LacZ/LacZ (Bottom) IHCs overlaid by an exponential fit to determine deactivation kinetics. (E, Right) Quantification of deactivation time constants showing comparable results for Cabp2LacZ/LacZ and Cabp2+/+ IHCs (Student’s t test). n.s., no significant difference. (F) Experimental paradigm and Ca2+ currents recorded from Cabp2+/+ (n = 8) and Cabp2LacZ/LacZ (n = 11) IHCs at near-physiological conditions [35–37 °C, 1.3 mM Ca2+, holding potential (Vh) = −57 mV]. Ipeak, peak current. Traces are presented as mean ± SEM. (G) Quantification of residual Ca2+ currents at 500 ms (I500,Ca) shows enhanced inactivation in Cabp2-deficient compared with Cabp2+/+ IHCs (***P < 0.001, Student’s t test). (H) Progression of inactivation during train stimulation of Cabp2LacZ/LacZ (n = 14) and Cabp2+/+ (n = 14) IHCs. Note the increase of inactivation with ongoing stimulation in Cabp2LacZ/LacZ IHCs (P < 0.005, Student’s t test). I1st, current evoked by first depolarization; In, current evoked by n's depolarization. Throughout the article, box plots and overlaid individual data points are presented. Box plots show the median as a horizontal line flanked by quartiles, and whiskers are presented as the 1.5-interquartile range from box edges.
Fig. S4.
Fig. S4.
Characterization of 2- to 3-wk-old animals: Enhanced voltage-dependent inactivation in IHCs of Cabp2LacZ/LacZ mice. (A) Grand averages of ABR waveform responses to 80-dB click stimuli at a stimulus rate of 20 Hz in Cabp2+/+ (n = 10) and Cabp2LacZ/LacZ (n = 12) mice at P21–P28. Note the decrease and delay of the wave I amplitude in Cabp2LacZ/LacZ mice compared with Cabp2+/+ mice. ABR waves are indicated by the roman numerals I–V on top of the respective wave. (B) ABR thresholds derived from A. Tone bursts are presented at a stimulus rate of 40 Hz. Average ABR threshold (thick lines and markers) ± SEM (shaded areas) is shown. P values are indicated with asterisks for 12- and 16-kHz tones (*P < 0.05, Holm–Sidak t test). (C) Average Ca2+-current response (lines) ± SEM (shaded areas) to 500-ms step depolarization recorded from Cabp2+/+ (n = 15) and Cabp2LacZ/LacZ (n = 16) IHCs of P16–P21 mice. (D) Average Ba2+-current response (lines) ± SEM (shaded areas) to the same experimental stimulus as in C but with Ba2+ as the charge carrier (Cabp2+/+: n = 29 IHCs and Cabp2LacZ/LacZ: n = 18 IHCs). (E) Summary of voltage- and Ca2+-dependent Ca2+-channel inactivation in Cabp2+/+ (Left) and Cabp2LacZ/LacZ (Right) IHCs (mean ± SEM; Ca2+-current inactivation: P < 0.001, Student's t test; VDI: P < 0.001, Student's t test; CDI: n.s., P > 0.05, Wilcoxon rank sum test. ***P < 0.001; n.s., no significant difference). The I500,Ba values are significantly diminished in Cabp2LacZ/LacZ IHCs compared with Cabp2+/+, indicating enhanced VDI, whereas CDI is only mildly affected in Cabp2LacZ/LacZ IHCs, not reaching statistical significance. (F, Top) Experimental paradigm for train protocol. (F, Bottom) Progression of inactivation during train stimulation with 10-ms depolarization stimuli and an interstimulus interval of 5 ms in Cabp2+/+ (n = 14) and Cabp2LacZ/LacZ (n = 14) IHCs. Note the significant reduction of Ca2+-current amplitude within the first five pulses in Cabp2LacZ/LacZ IHCs (***P < 0.001, Student’s t test), with a further decrease with ongoing stimulation (***P < 0.001, Student’s t test). Respective traces are overlaid with mean double-exponential fits. Vh, holding potential. (G, Top) Experimental protocol to record recovery from inactivation. (G, Bottom) Ratio between current amplitudes of the post (P2) and pre (P1) pulses was used as an estimate for Ca2+-current recovery. Note that Ca2+ currents are still decreased in IHCs of Cabp2LacZ/LacZ mice after 1 s of recovery time. ***P < 0.001, Student's t test.
Fig. S5.
Fig. S5.
Enhanced sustained exocytosis in Cabp2-deficient IHCs. (A) Representative Ca2+-current traces of Cabp2+/+ and Cabp2LacZ/LacZ IHCs for 200-ms depolarizations (Top) and respective capacitance increments (ΔCm) of P35–P42 animals (Bottom). The ΔCm of Cabp2LacZ/LacZ exceeds control levels. fF, femtofarad; pC, picocoulomb. (B, Top) Mean traces of Cm recordings summarizing exocytosis in Cabp2+/+ (n = 18) and Cabp2LacZ/LacZ (n = 14) IHCs elicited by depolarizations to −14 mV at increasing depolarization durations. (B, Bottom) Respective mean Ca2+ charge (QCa2+) traces. Note the significant increase in ΔCm for long stimuli reporting enhanced sustained exocytosis in Cabp2-deficient compared with Cabp2+/+ IHCs (***P < 0.001, Student’s t test). (C) Summary of ΔCm to measure sustained exocytosis in presence of 0.5 mM EGTA and 0.5 mM BAPTA. Sustained exocytosis for long depolarizations was comparable between Cabp2+/+ (n = 20) and Cabp2LacZ/LacZ (n = 16) IHCs (P > 0.05, Wilcoxon rank sum test). n.s., no significant difference.
Fig. S6.
Fig. S6.
Low Ca2+-affinity binding of wild-type CaBP2. Isothermal titration calorimetry of CABP2-wt (Left) and CABP2-ΔEF3/4 (Right). (Top) Calorimetric titration of 5 mM Ca2+ into CABP2-wt. (Bottom) Fitted titration data using a sequential binding site model. The dissociation constant (Kd), change in enthalpy (ΔH), and change in entropy (ΔS) values are shown in Table S2.
Fig. 5.
Fig. 5.
Cabp2 is required for normal spontaneous and sound-evoked firing of SGNs. (A) Cumulative plot of spontaneous firing rates of SGNs recorded from Cabp2LacZ/LacZ (n = 36) and Cabp2+/+ SGNs (n = 161, pooling littermate controls and C57Bl6 controls). Note the higher fraction of low spontaneous rate fibers in Cabp2LacZ/LacZ mice (P < 0.001, Kolmogorov–Smirnov test). (B) Peak-aligned grand averages of poststimulus time histograms of SGNs (bin width = 0.5 ms) recorded in response to 200 50-ms tone bursts. The time course of adaptation of Cabp2LacZ/LacZ SGNs (n = 30) is comparable to Cabp2+/+ SGNs (n = 112, pooling littermates and C57Bl6 controls). *P < 0.05, ***P < 0.005. (C) Summary of first-spike latencies of SGNs (scattered against steady-state firing rate) showing delayed responses in Cabp2LacZ/LacZ compared with Cabp2+/+ animals (P < 0.001, Wilcoxon rank sum test). (D) Variance (б2) of the first-spike latency (scattered against steady-state firing rate). Variance is increased in SGNs of Cabp2-deficient compared with Cabp2+/+ animals (P < 0.05, Wilcoxon rank sum test).
Fig. S7.
Fig. S7.
Sound encoding in Cabp2LacZ/LacZ SGNs. (A) Representative examples of tuning curves, indicating preserved cochlear amplification in Cabp2LacZ/LacZ SGNs. (B) Thresholds at the characteristic frequencies of Cabp2LacZ/LacZ SGNs (n = 44) can be as low as in Cabp2+/+ mice (n = 160). (CE) Rate-level functions (average increase of spike rate with intensity) of SGNs in response to 50-ms tone bursts presented at the characteristic frequency of each fiber in Cabp2LacZ/LacZ (n = 16) and Cabp2+/+ (n = 63) mice. The maximal steepness of the rate-intensity function (D) and the dynamic range of sound encoding (the range of intensities over which the spike rate increases between 10% and 90% of the evoked spike rate) (E) were comparable (both P > 0.05, Wilcoxon rank sum test). (F) Grand averages of poststimulus time histograms recorded in response to 50 × 500-ms tone bursts presented at the characteristic frequency of SGNs 30 dB above threshold at a stimulus rate of 0.5 Hz (bin width = 5 ms) indicate a trend for enhanced adaptation in Cabp2LacZ/LacZ SGNs (n = 19) compared with Cabp2+/+ (n = 8) littermates.

Similar articles

Cited by

References

    1. Safieddine S, El-Amraoui A, Petit C. The auditory hair cell ribbon synapse: From assembly to function. Annu Rev Neurosci. 2012;35:509–528. - PubMed
    1. Wichmann C, Moser T. Relating structure and function of inner hair cell ribbon synapses. Cell Tissue Res. 2015;361(1):95–114. - PMC - PubMed
    1. Brandt A, Striessnig J, Moser T. CaV1.3 channels are essential for development and presynaptic activity of cochlear inner hair cells. J Neurosci. 2003;23(34):10832–10840. - PMC - PubMed
    1. Dou H, et al. Null mutation of alpha1D Ca2+ channel gene results in deafness but no vestibular defect in mice. J Assoc Res Otolaryngol. 2004;5(2):215–226. - PMC - PubMed
    1. Platzer J, et al. Congenital deafness and sinoatrial node dysfunction in mice lacking class D L-type Ca2+ channels. Cell. 2000;102(1):89–97. - PubMed

Publication types

MeSH terms