. 2017 Apr;173(4):2163-2179.
doi: 10.1104/pp.16.01767. Epub 2017 Feb 9.

Importance of Fluctuations in Light on Plant Photosynthetic Acclimation

Affiliations

Importance of Fluctuations in Light on Plant Photosynthetic Acclimation

Silvere Vialet-Chabrand et al. Plant Physiol. 2017 Apr.

Abstract

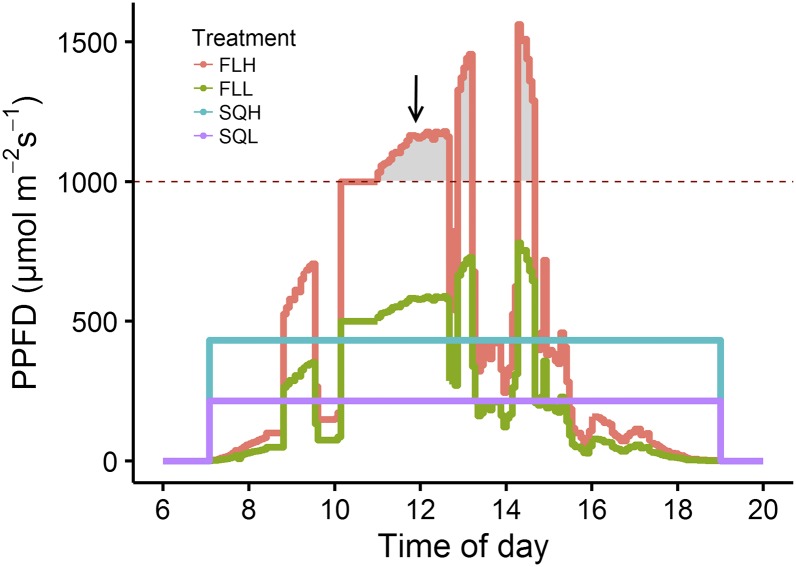
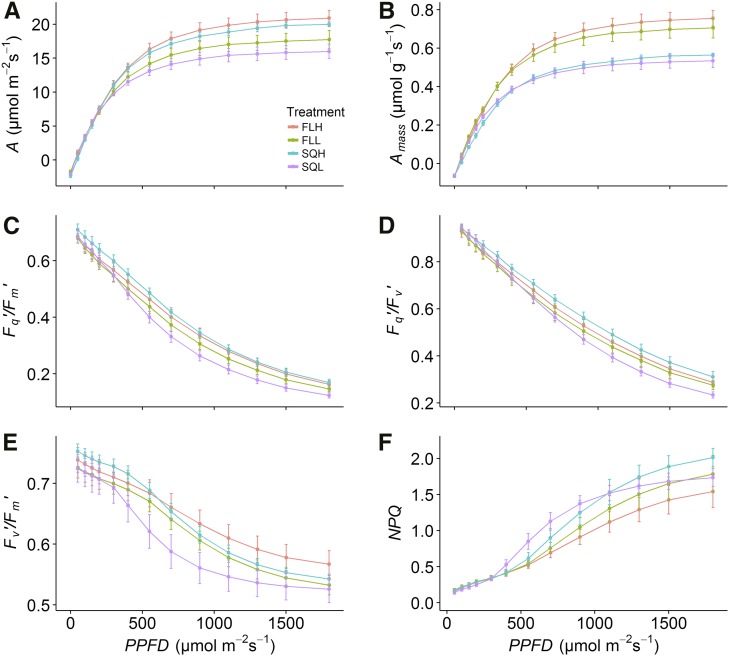
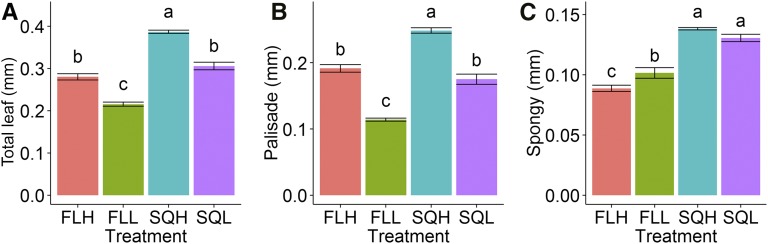
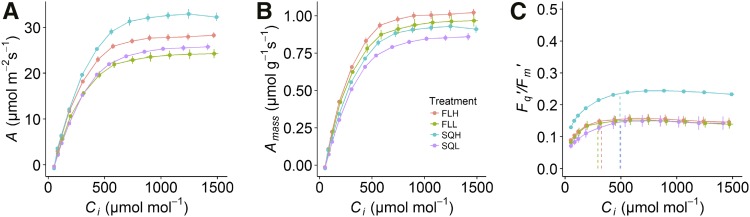
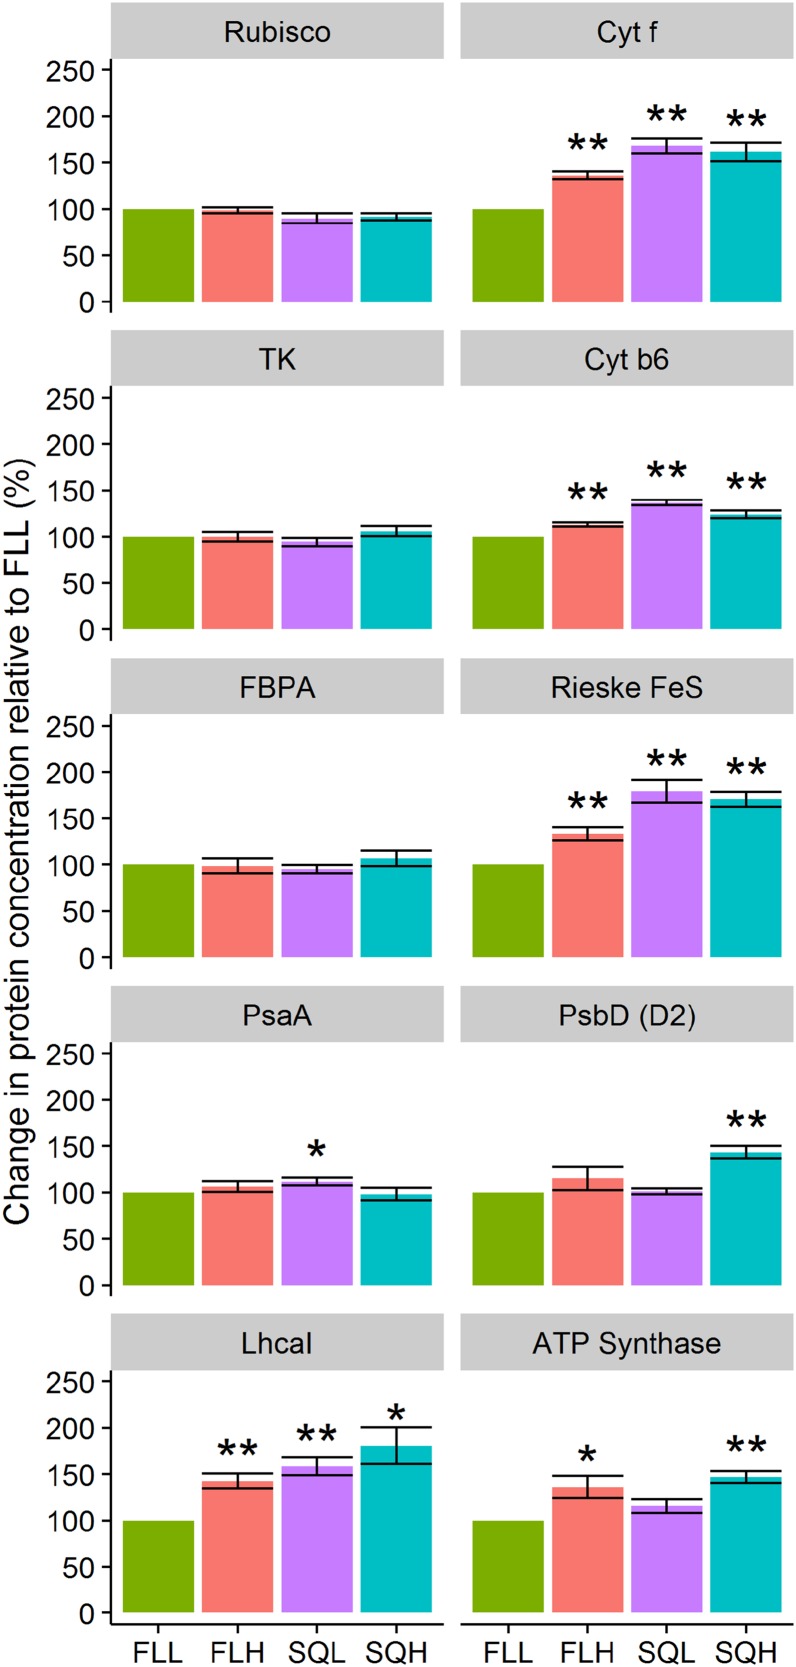
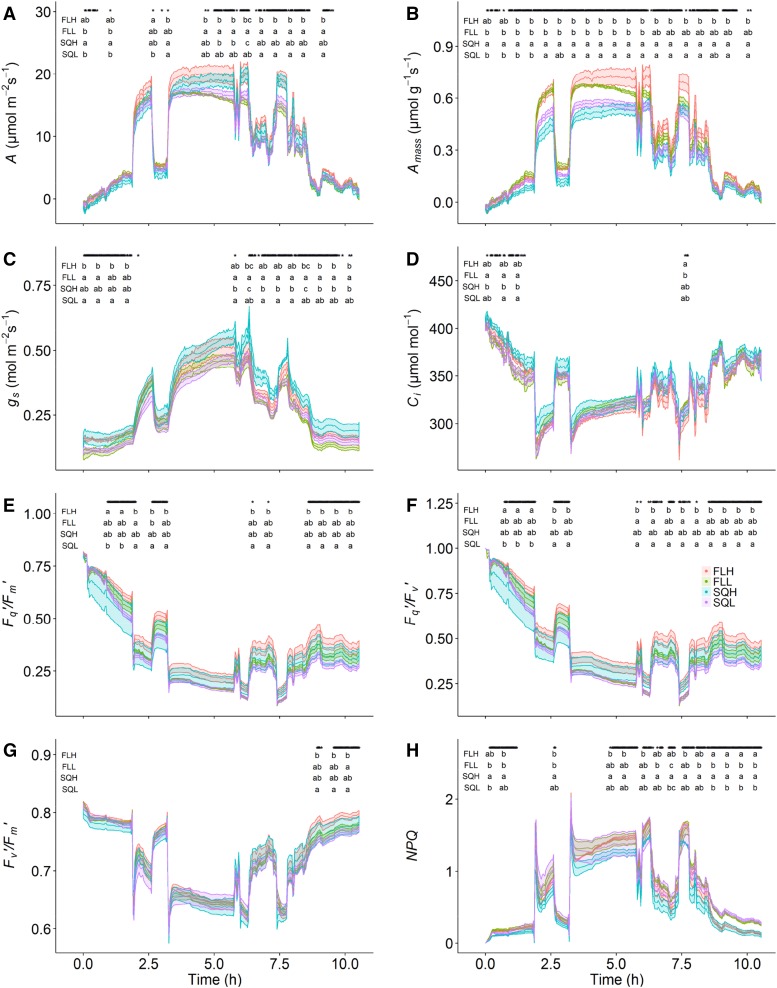
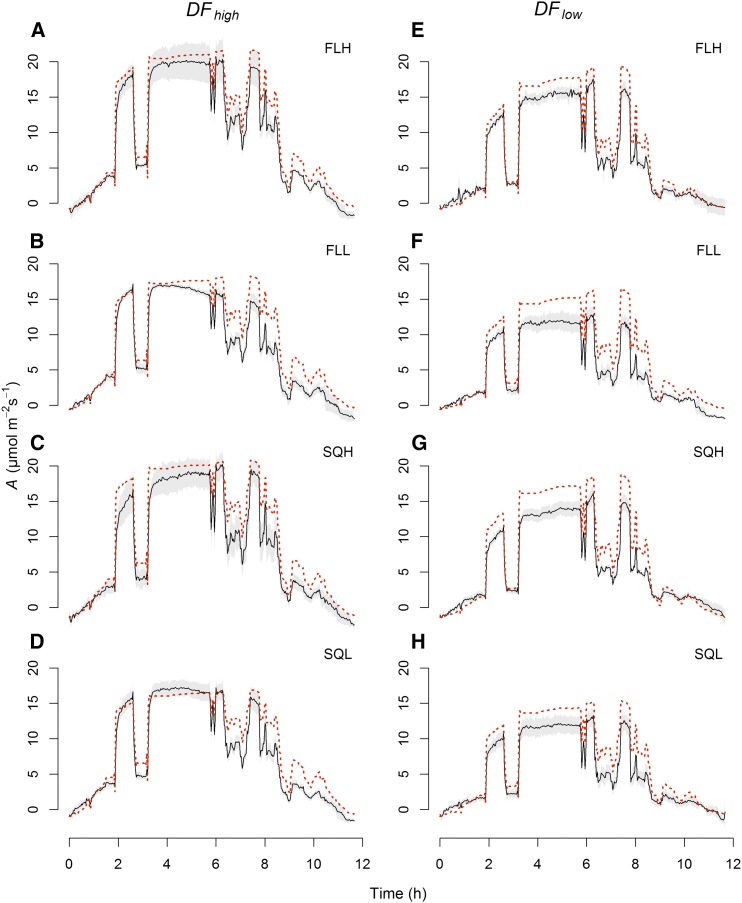
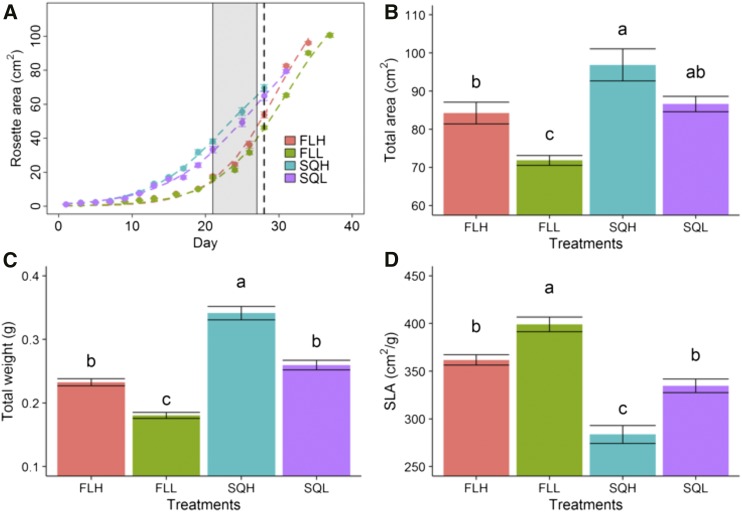
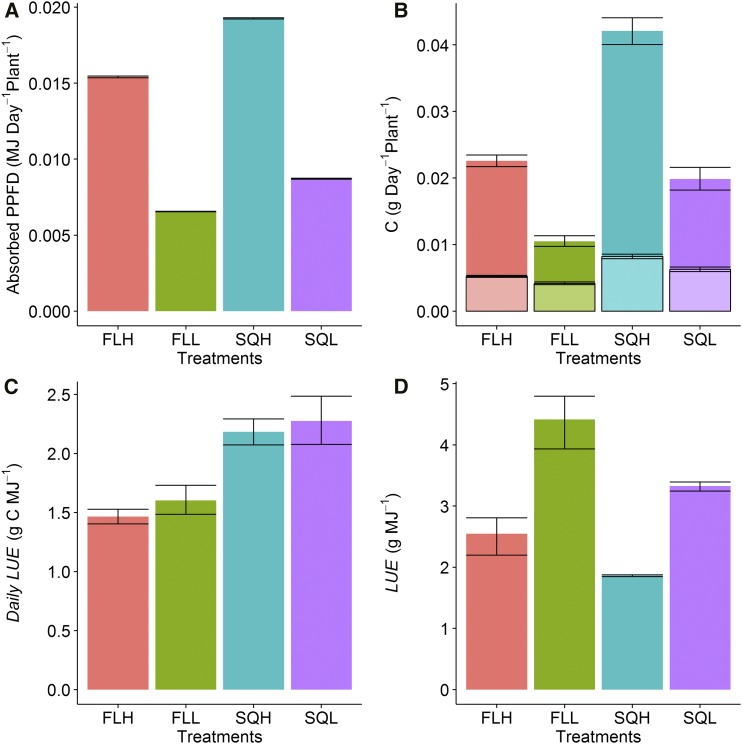
The acclimation of plants to light has been studied extensively, yet little is known about the effect of dynamic fluctuations in light on plant phenotype and acclimatory responses. We mimicked natural fluctuations in light over a diurnal period to examine the effect on the photosynthetic processes and growth of Arabidopsis (Arabidopsis thaliana). High and low light intensities, delivered via a realistic dynamic fluctuating or square wave pattern, were used to grow and assess plants. Plants subjected to square wave light had thicker leaves and greater photosynthetic capacity compared with fluctuating light-grown plants. This, together with elevated levels of proteins associated with electron transport, indicates greater investment in leaf structural components and photosynthetic processes. In contrast, plants grown under fluctuating light had thinner leaves, lower leaf light absorption, but maintained similar photosynthetic rates per unit leaf area to square wave-grown plants. Despite high light use efficiency, plants grown under fluctuating light had a slow growth rate early in development, likely due to the fact that plants grown under fluctuating conditions were not able to fully utilize the light energy absorbed for carbon fixation. Diurnal leaf-level measurements revealed a negative feedback control of photosynthesis, resulting in a decrease in total diurnal carbon assimilated of at least 20%. These findings highlight that growing plants under square wave growth conditions ultimately fails to predict plant performance under realistic light regimes and stress the importance of considering fluctuations in incident light in future experiments that aim to infer plant productivity under natural conditions in the field.


Figures

Figure 1.
Figure 1.
Diurnal light regimes used for plant growth and leaf-level measurements of gas exchange. Areas under the curve represent the same average amount of light energy over the 12-h light regime for square wave and fluctuating treatments depending on the light intensity: SQH, FLH (mean = 460 µmol m−2 s−1), SQL, and FLL (mean = 230 µmol m−2 s−1). The arrow indicates the time point (12 pm) at which leaf discs were collected for protein and chlorophyll extraction. PPFD, Photosynthetic photon flux density.
Figure 2.
Figure 2.
Photosynthesis as a function of light intensity (PPFD) of plants grown under the four light regimes SQH, FLH, SQL, and FLL. Parameters examined are A (A) Amass (B), Fq/Fm′ (C), Fq/Fv′ (D), Fv/Fm′ (E), and NPQ (F). Error bars represent confidence intervals at 95% (n = 5).
Figure 3.
Figure 3.
Leaf anatomical properties including total leaf thickness (A), palisade layer thickness (B), and spongy layer thickness (C) of plants grown under the four light treatments SQH, FLH, SQL, and FLL. Data represent means ± se (n = 6). Letters represent the results of Tukey’s posthoc comparisons of group means.
Figure 4.
Figure 4.
Photosynthesis as a function of Ci of plants grown under the four light treatments SQH, FLH, SQL, and FLL. Parameters examined are A (A), Amass (B), and Fq/Fm′ (C). Data represent means ± se (n = 6).
Figure 5.
Figure 5.
Percentage change in protein concentration relative to FLL treatment determined from four replicate immunoblot analyses of leaves grown under the four light treatments SQH, FLH, SQL, and FLL. Rubisco and the Calvin-Benson cycle proteins TK and FBPA were probed along with the electron transport cytochrome b6f complex proteins Cyt f, Cyt b6, and Rieske FeS, the PSI Lhca1 and PsaA proteins, the PSII PsbD/D2 proteins, and the ATP synthase δ-subunit. Treatments were statistically analyzed against FLL-grown plants using a one-sample Student’s t test (*, P < 0.05 and **, P < 0.01).
Figure 6.
Figure 6.
Diurnal measurements of gas exchange of A (A), Amass (B), gs (C), Ci (D), and the chlorophyll fluorescence parameters Fq/Fm′ (E), Fq/Fv′ (F), Fv/Fm′ (G), and NPQ (H) estimated under DFhigh in the four light regimes SQH, FLH, SQL, and FLL. Data represent means ± se. Stars above the curves denote significant differences between the light regimes using a one-way ANOVA with unequal variance (n = 5). Letters represent the results of Tukey’s posthoc comparisons of group means.
Figure 7.
Figure 7.
Diurnal measurements of observed A (black lines) and predicted net CO2 assimilation modeled from the A/Q responses (see Eq. 3; red dashed lines) of the four light regimes SQH, FLH, SQL, and FLL over diurnal periods of DFhigh (A–D) and DFlow (E–H; n = 5). Gray shading represents confidence intervals at 95%.
Figure 8.
Figure 8.
Growth analysis of plants grown under the four light regimes SQH, FLH, SQL, and FLL. A, Kinetics of the increase in rosette area, with each point representing a mean of 10 plants. The gray area represents the period during which gas-exchange measurements were taken. The dotted line indicates the time of harvest for all treatments. The last point of each curve was measured upon the appearance of the first inflorescence. B to D, Total leaf area of each plant (B), total aboveground dry mass (C), and specific leaf area (SLA; D). Data represent means ± se (n = 8–10). Letters represent the results of Tukey’s posthoc comparisons of group means.
Figure 9.
Figure 9.
Total daily absorbed light (A), net carbon (“C”) gain (darker colors) and carbon loss by dark respiration (lighter colors; B), modeled daily LUE (C), and overall long-term LUE (D) of plants grown under the four light treatments SQH, FLH, SQL, and FLL. Error bars represent 95% confidence intervals (n = 8).

References

    1. Alter P, Dreissen A, Luo FL, Matsubara S (2012) Acclimatory responses of Arabidopsis to fluctuating light environment: comparison of different sunfleck regimes and accessions. Photosynth Res 113: 221–237 - PMC - PubMed
    1. Athanasiou K, Dyson BC, Webster RE, Johnson GN (2010) Dynamic acclimation of photosynthesis increases plant fitness in changing environments. Plant Physiol 152: 366–373 - PMC - PubMed
    1. Bailey S, Horton P, Walters RG (2004) Acclimation of Arabidopsis thaliana to the light environment: the relationship between photosynthetic function and chloroplast composition. Planta 218: 793–802 - PubMed
    1. Bailey S, Walters RG, Jansson S, Horton P (2001) Acclimation of Arabidopsis thaliana to the light environment: the existence of separate low light and high light responses. Planta 213: 794–801 - PubMed
    1. Baker NR. (2008) Chlorophyll fluorescence: a probe of photosynthesis in vivo. Annu Rev Plant Biol 59: 89–113 - PubMed

Publication types

MeSH terms