. 2017 Feb 1;27(2):981-997.
doi: 10.1093/cercor/bhx030.

A Systematic Relationship Between Functional Connectivity and Intracortical Myelin in the Human Cerebral Cortex

Affiliations

A Systematic Relationship Between Functional Connectivity and Intracortical Myelin in the Human Cerebral Cortex

Julia M Huntenburg et al. Cereb Cortex. .

Abstract

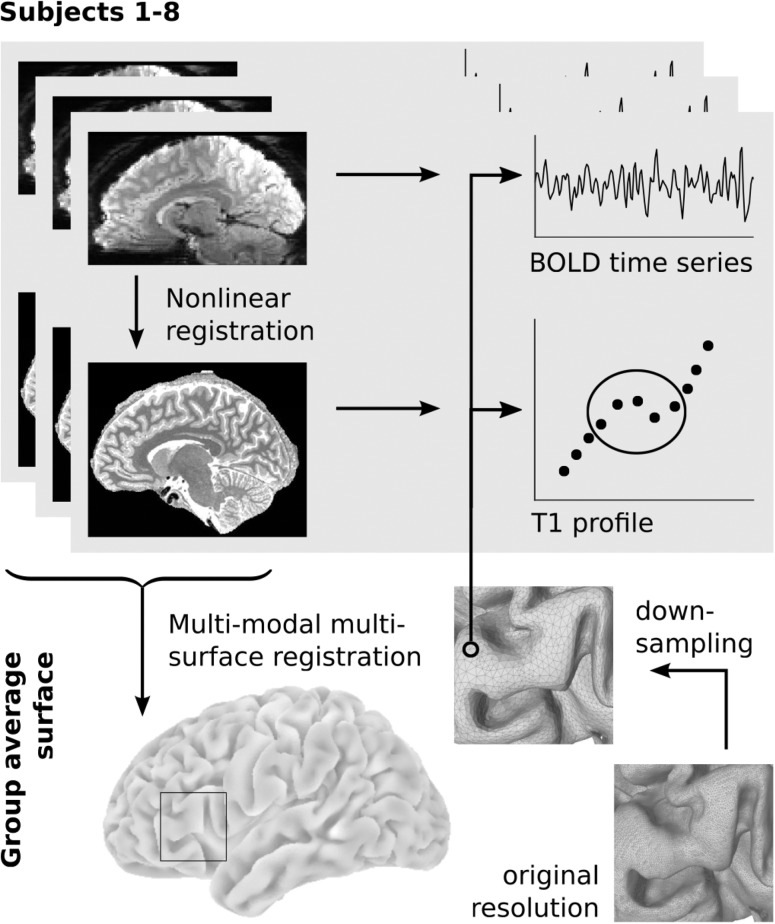
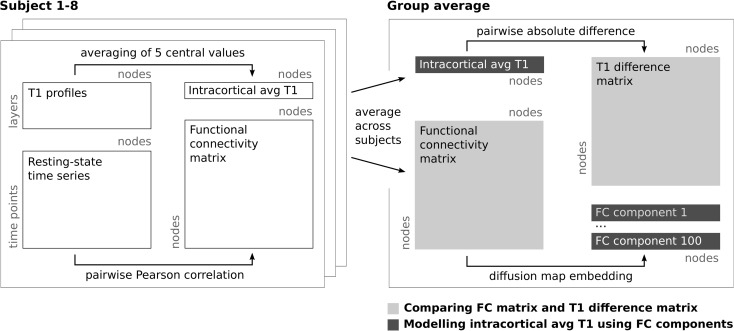
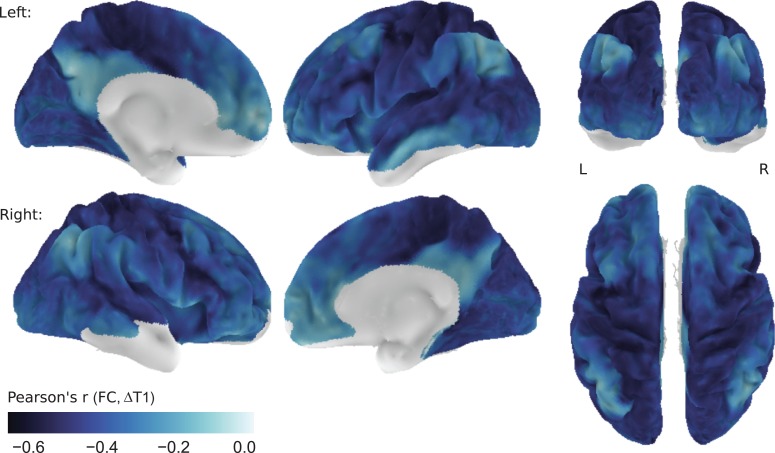
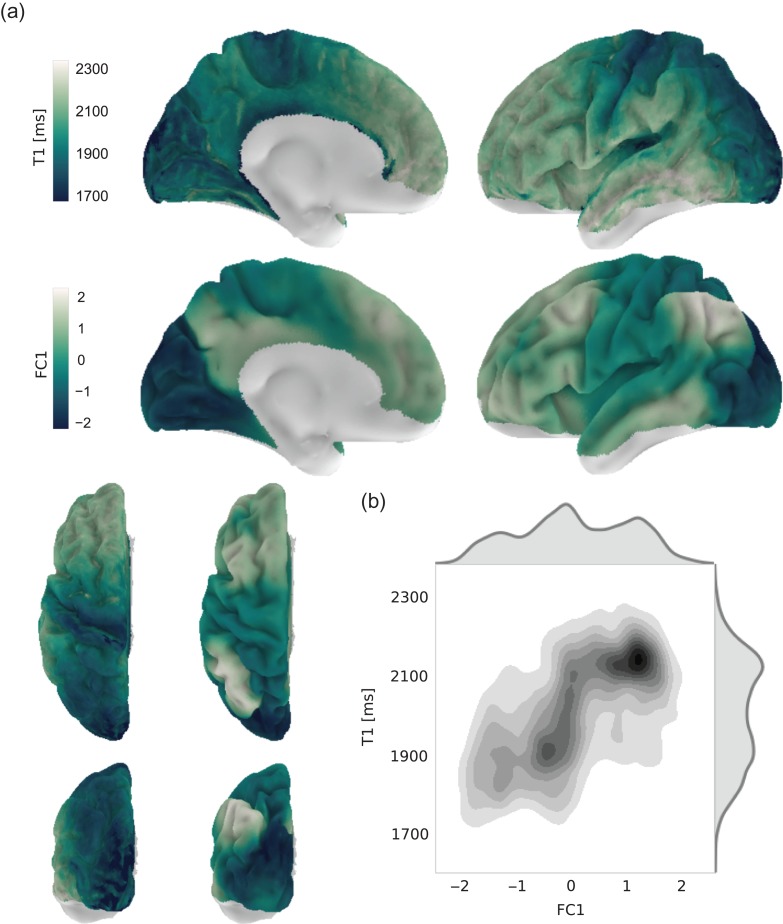
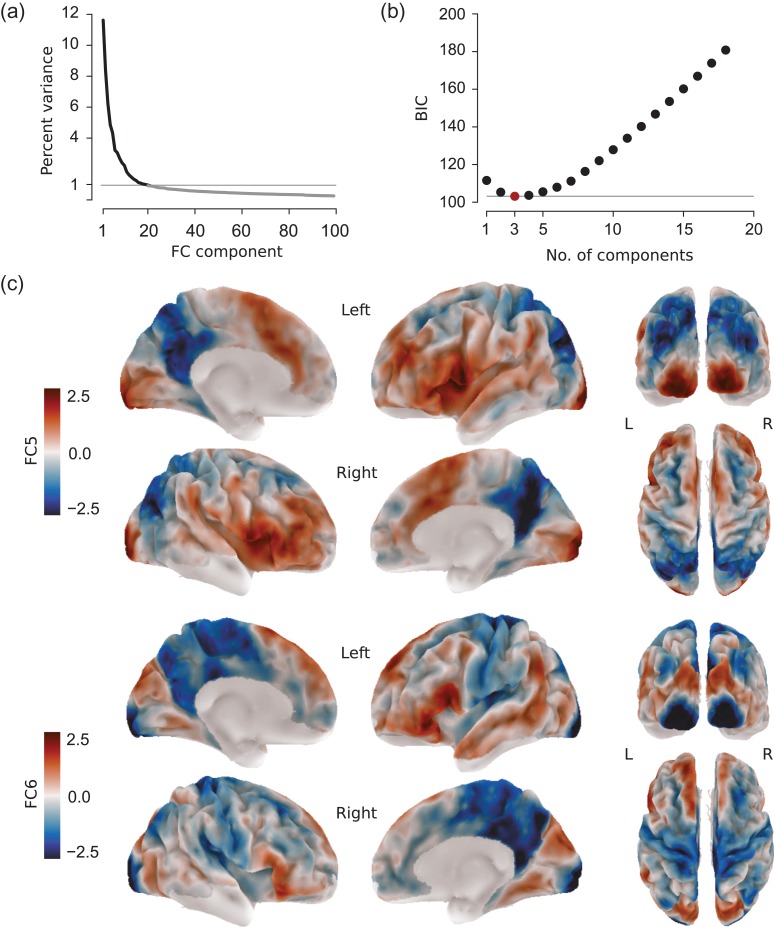
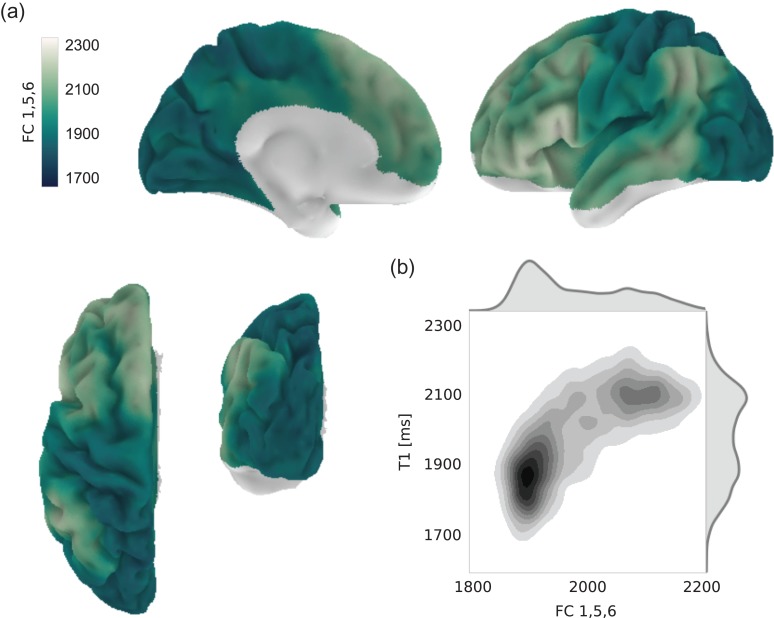
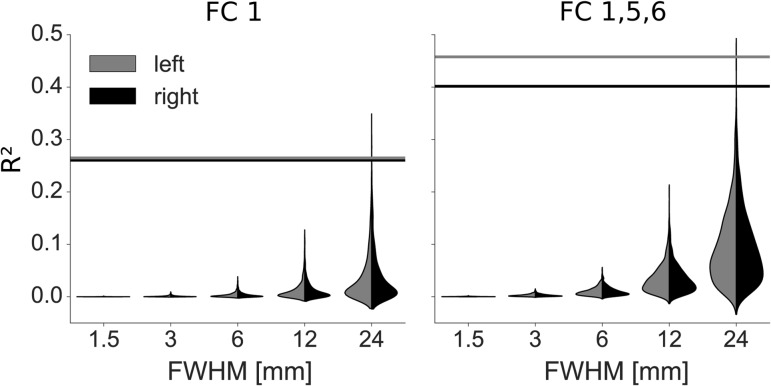
Research in the macaque monkey suggests that cortical areas with similar microstructure are more likely to be connected. Here, we examine this link in the human cerebral cortex using 2 magnetic resonance imaging (MRI) measures: quantitative T1 maps, which are sensitive to intracortical myelin content and provide an in vivo proxy for cortical microstructure, and resting-state functional connectivity. Using ultrahigh-resolution MRI at 7 T and dedicated image processing tools, we demonstrate a systematic relationship between T1-based intracortical myelin content and functional connectivity. This effect is independent of the proximity of areas. We employ nonlinear dimensionality reduction to characterize connectivity components and identify specific aspects of functional connectivity that are linked to myelin content. Our results reveal a consistent spatial pattern throughout different analytic approaches. While functional connectivity and myelin content are closely linked in unimodal areas, the correspondence is lower in transmodal areas, especially in posteromedial cortex and the angular gyrus. Our findings are in agreement with comprehensive reports linking histologically assessed microstructure and connectivity in different mammalian species and extend them to the human cerebral cortex in vivo.

Keywords: cortical microstructure; functional connectivity; high-resolution MRI; myelin imaging.


Figures

Figure 1.
Figure 1.
Data extraction workflow. Resting-state images were nonlinearly coregistered to the structural space of the same subject. A group-specific surface template was created using midcortical surfaces and intracortical T1 contrasts of all subjects in a multimodal multisurface registration approach. The group-average surface was downsampled and projected into the space of each subject for sampling of BOLD time series and T1 profiles. Cortical depth profiles were sampled according to an equi-volumetric principle; only the central values were averaged to minimize partial volume effects.
Figure 2.
Figure 2.
Data analysis workflow. Schematic describing the processing steps from the single subject T1 profiles and resting-state time series to the comparison of group-level intracortical average (avg) T1 and functional connectivity (FC). In the first analysis (light gray), the high-dimensional functional connectivity and T1 difference matrices are correlated. In the second analysis (dark gray), intracortical T1 maps and a linear combination of functional connectivity components are compared in a single dimension.
Figure 3.
Figure 3.
Node-wise correlation of functional connectivity and T1 difference. For each surface node, the correlation between its functional connectivity to all other nodes and its T1 difference to all other nodes is shown. Values closer to zero (white) indicate a weaker linear relationship between connectivity strengths and T1 differences. Correlation values are shown on the left (L) and right (R) hemisphere of the group average surface. Nodes with low signal quality in either imaging modality (predominantly in orbitofrontal and ventral temporal areas) were excluded from the analysis.
Figure 4.
Figure 4.
Relationship between intracortical T1 and the principal component of functional connectivity. (a) Intracortical T1 (top row and left column of bottom row) and the principal component of functional connectivity decomposition (FC1, middle row and right column of bottom row) are shown on the surface of the left hemisphere. Nodes with low signal quality in either imaging modality were excluded from the analysis. The surface plots for the right hemisphere are highly comparable and are shown in Supplementary Figure 5. (b) Bivariate distribution of FC1 and T1 values across both hemispheres.
Figure 5.
Figure 5.
Using multiple connectivity components to fit intracortical T1. (a) Variance in the connectivity transition matrix Mexplained by the different embedding components. (b) BIC values of the best performing model by number of components employed. The best model (FC1, 5, 6) is highlighted in red. (c) Connectivity components FC5 (top row) and FC6 (bottom row), together with FC1 constituting the best performing model, are shown on the left (L) and right (R) hemisphere of the group average surface. Values indicate the relative position of a given surface node along the respective component and have no unit. Nodes with low signal quality in either imaging modality were excluded from the analysis.
Figure 6.
Figure 6.
Combination of connectivity components providing the best fit to intracortical T1. (a) Result of modeling T1 as a linear combination of connectivity components FC 1, 5, and 6, shown on the left hemisphere. Nodes with low signal quality in either imaging modality were excluded from the analysis. The surface plots for the right hemisphere are highly comparable and are shown in Supplementary Figure 5. (b) Bivariate distribution of modeled and original T1 values across both hemispheres.
Figure 7.
Figure 7.
Validation of model fit. Random, smoothed data sets were fitted using linear models containing only FC1 (left) or FC1, 5, and 6 (right). The distributions of resulting R2 values for the left (grey) and right (black) hemisphere are shown as split violin plots. Horizontal lines indicate the values obtained when fitting respective models to the actual map of myelin content (FWHM = 1.5 mm).

References

    1. Abraham A, Pedregosa F, Eickenberg M, Gervais P, Mueller A, Kossaifi J, Gramfort A, Thirion B, Varoquaux G. 2014. Machine learning for neuroimaging with scikit-learn. Front Neuroinform. 8:14. - PMC - PubMed
    1. Adachi Y, Osada T, Sporns O, Watanabe T, Matsui T, Miyamoto K, Miyashita Y. 2012. Functional connectivity between anatomically unconnected areas is shaped by collective network-level effects in the macaque cortex. Cereb Cortex. 22(7):1586–1592. - PubMed
    1. Annese J, Pitiot A, Dinov ID, Toga AW. 2004. A myelo-architectonic method for the structural classification of cortical areas. Neuroimage. 21(1):15–26. - PubMed
    1. Avants BB, Epstein CL, Grossman M, Gee JC. 2008. Symmetric diffeomorphic image registration with cross-correlation: evaluating automated labeling of elderly and neurodegenerative brain. Med Image Anal. 12(1):26–41. - PMC - PubMed
    1. Avants BB, Tustison NJ, Song G, Cook PA, Klein A, Gee JC. 2011. A reproducible evaluation of ANTs similarity metric performance in brain image registration. Neuroimage. 54(3):2033–2044. - PMC - PubMed

Publication types