. 2017 Apr;66(4):523-535.
doi: 10.1007/s00262-017-1955-5. Epub 2017 Feb 9.

Regulation of PD-L1 expression on murine tumor-associated monocytes and macrophages by locally produced TNF-α

Affiliations

Regulation of PD-L1 expression on murine tumor-associated monocytes and macrophages by locally produced TNF-α

Genevieve Hartley et al. Cancer Immunol Immunother. 2017 Apr.

Abstract

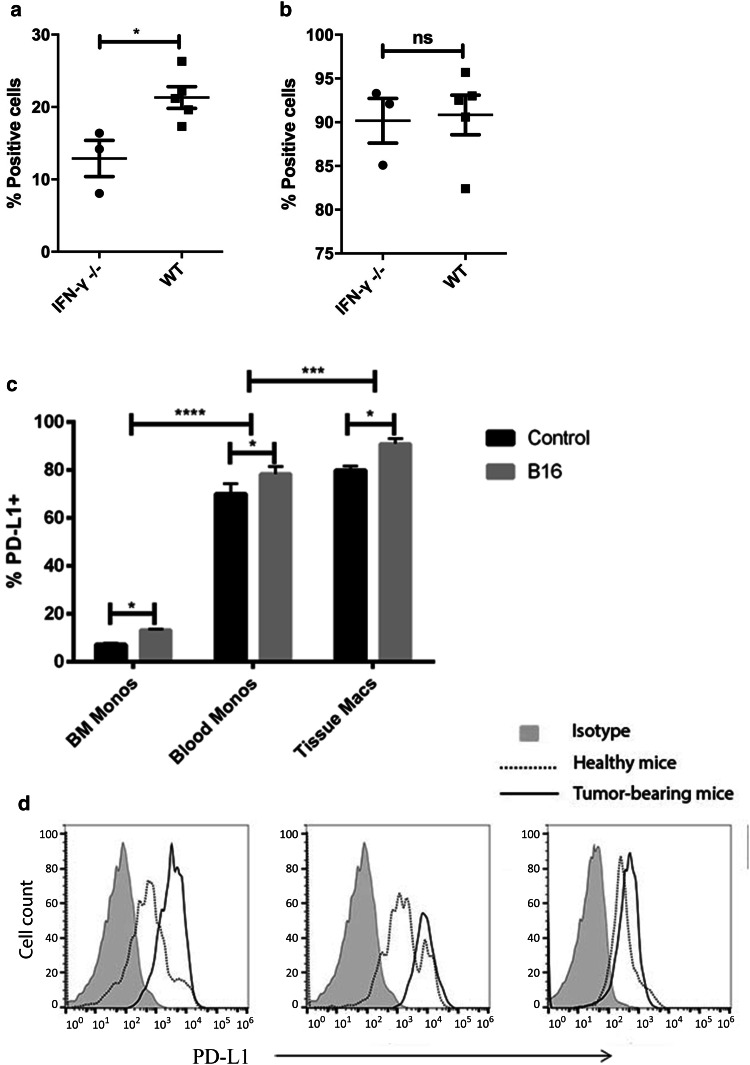
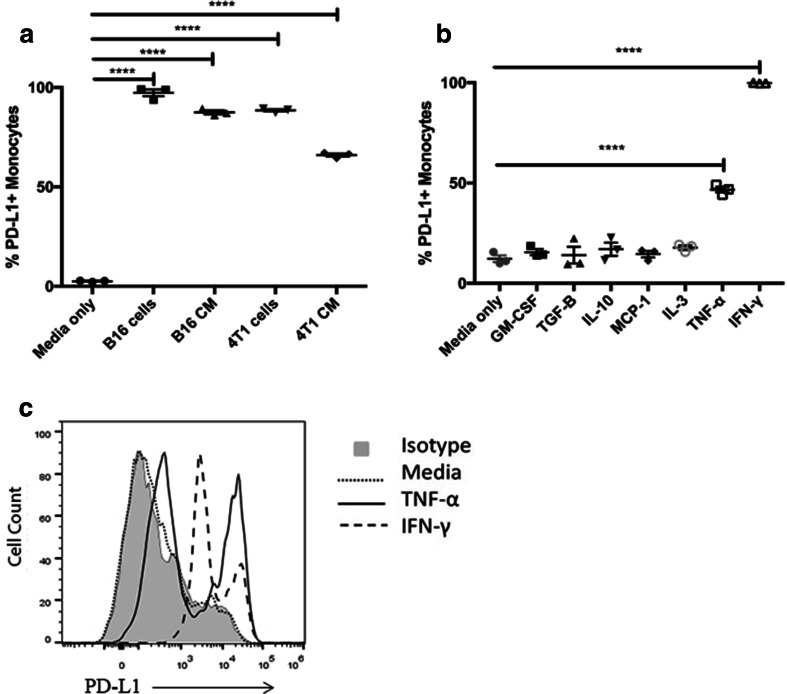
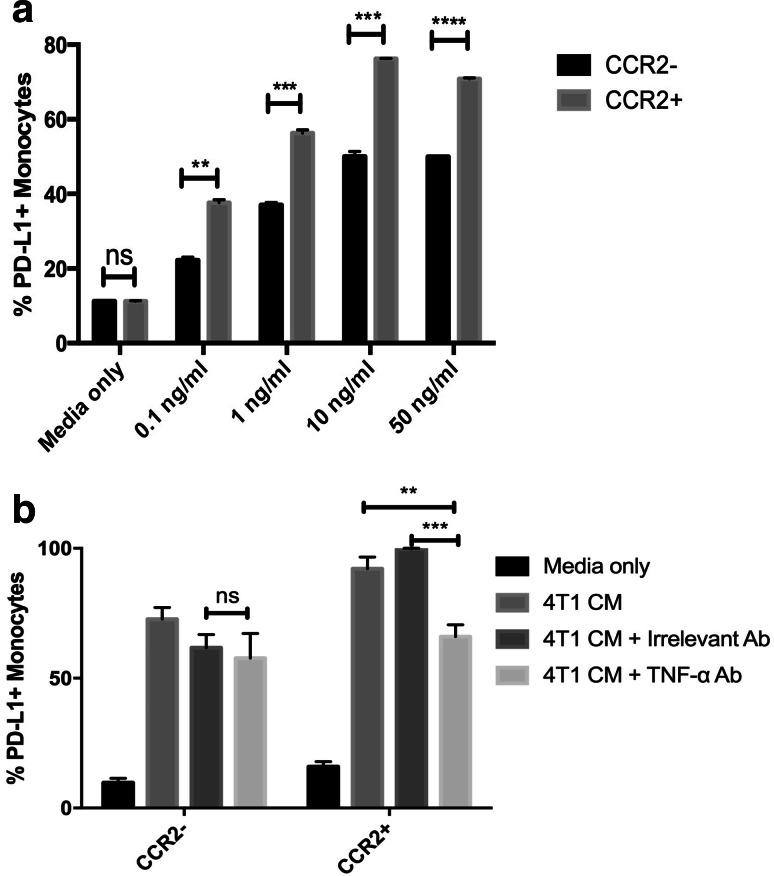
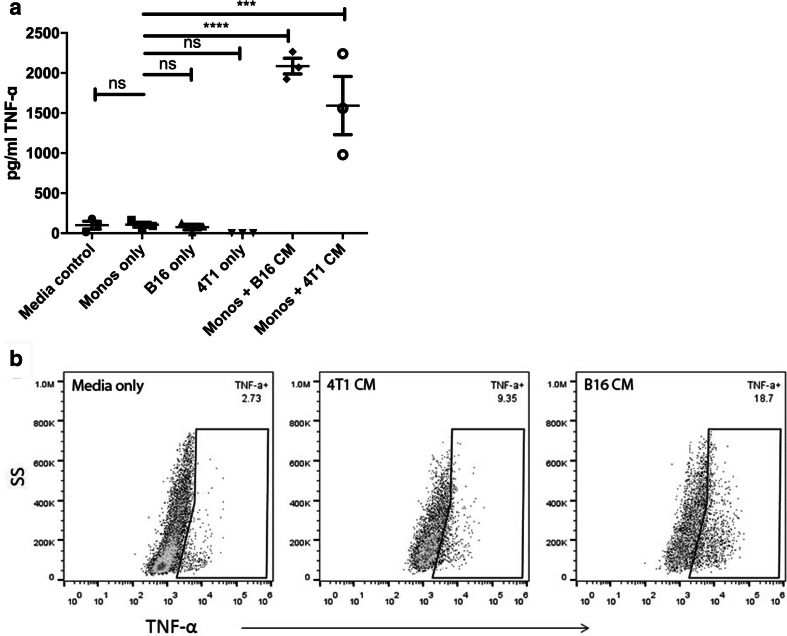
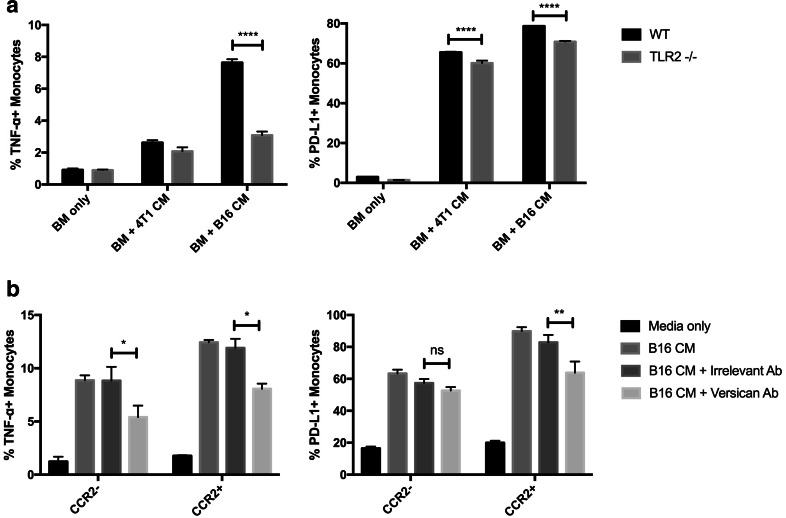
PD-L1 is an immune checkpoint protein that has emerged as a major signaling molecule involved with tumor escape from T cell immune responses. Studies have shown that intra-tumoral expression of PD-L1 can inhibit antitumor immune responses. However, it has recently been shown that expression of PD-L1 on myeloid cells from the tumor is a stronger indicator of prognosis than tumor cell PD-L1 expression. Therefore, it is important to understand the factors that govern the regulation of PD-L1 expression on tumor-infiltrating myeloid cells. We found that immature bone marrow monocytes in tumor-bearing mice had low levels of PD-L1 expression, while higher levels of expression were observed on monocytes in circulation. In contrast, macrophages found in tumor tissues expressed much higher levels of PD-L1 than circulating monocytes, implying upregulation by the tumor microenvironment. We demonstrated that tumor-conditioned media strongly induced increased PD-L1 expression by bone marrow-derived monocytes and TNF-α to be a cytokine that causes an upregulation of PD-L1 expression by the monocytes. Furthermore, we found production of TNF-α by the monocytes themselves to be a TLR2-dependent response to versican secreted by tumor cells. Thus, PD-L1 expression by tumor macrophages appears to be regulated in a different manner than by tumor cells themselves.

Keywords: Cytokine; Immune checkpoint; Myeloid; Tumor.


Conflict of interest statement

The authors declare no conflict of interest.

Figures

Fig. 1
Fig. 1
PD-L1 expression by tumor cells, monocytes, and macrophages in vivo. B16 tumors cells were established s.c. in WT and IFN-γ−/− mice (n = 3–5 animals per group), as noted in Methods. Single cell suspensions were prepared from excised tumor tissues and flow cytometry was used to compare PD-L1 expression by CD45 tumor cells in (a) and by tumor-associated macrophages (CD45+/CD11b+/F4-80+) in (b) obtained from the two groups of mice. The mean percentage of PD-L1+ cells present in tumor tissues from WT and IFN-γ−/− are depicted and the mean percentages were compared statistically using a non-parametric t-test. In (c), bone marrow monocytes (CD11b+/Ly6C+/Ly6G-), circulating monocytes (CD11b+/Ly6C+/Ly6G), and tissue macrophages (CD45+/ CD11b+) were harvested from the spleens of healthy mice and from tumors of mice with established s.c. B16 tumors (n = 4–5 mice per group) and PD-L1 expression was quantitated by flow cytometry. The level of expression of PD-L1 on the cells is shown as histograms of geometric MFI in (d) where gray filled = isotype stain, dotted line = cells from healthy mice, and solid line = cells from tumor-bearing mice from bone marrow, blood, and tissues. The mean percentages of PD-L1+ cells in healthy mice and mice with tumors were compared statistically using a non-parametric t-test, and mean percentages of PD-L1+ cells in different tissues from healthy and tumor-bearing mice were compared using two-tailed ANOVA, with Tukey post-test. Groups means with statistically significant differences were denoted as * = p < 0.05, *** = p < 0.0005, and **** = p < 0.0001. Similar results were obtained in two additional, independent experiments
Fig. 2
Fig. 2
Effects of tumor cells, tumor CM, and cytokines on monocyte PD-L1 expression. a B16 and 4T1 tumor cells were grown as monolayers, then co-cultured with bone marrow-derived monocytes for 24 h, as described in Methods. In other studies, bone marrow-derived monocytes were cultured with CM from tumor cells. The effects of co-culture with live tumor cells or with tumor CM on monocyte PD-L1 expression was determined by flow cytometry. b Bone marrow-derived monocytes were prepared as described in Methods and incubated with the following murine recombinant cytokines (TNF-α, TGF-β, IL-10, MCP-1, IFN-γ, GM-CSF, and IL-3) at a concentration of 10 ng/ml. After overnight culture, the monocytes were collected and immunostained for flow cytometric analysis of PD-L1 expression. c Histograms of monocyte PD-L1 expression following exposure to TNF-α or IFN-γ. The percentage of PD-L1+ cells was compared between monocytes cultured in medium only and monocytes exposed to tumor cells, tumor CM, or cytokines using one-tailed ANOVA, followed by Dunnet’s multiple means comparison. Statistically significant differences were denoted as ** = p < 0.005, *** = p < 0.0005, and **** = p < 0.0001. These data are representative of 4 repeated experiments with similar results
Fig. 3
Fig. 3
Neutralization of TNF-α significantly blocks upregulation of monocyte PD-L1 expression by tumors. a Bone marrow-derived monocytes were treated with increasing concentrations of recombinant TNF-α (0.1–50 ng/ml), and PD-L1 expression was compared between inflammatory monocytes (CD11b+/Ly6C+/Ly6G/CCR2+) and non-inflammatory monocytes (CD11b+/Ly6C+/Ly6G/CCR2). b Conditioned medium from 4T1 cells was treated with a TNF-α neutralizing antibody (or isotype control antibody), then incubated with triplicate wells of bone marrow-derived monocytes for 24 h. Effects of tumor CM on monocyte PD-L1 expression was assessed on both inflammatory monocytes (CD11b+/Ly6C+/Ly6G/CCR2+) and non-inflammatory monocytes (CD11b+/Ly6C+/Ly6G/CCR2). Similar results were obtained in three additional independent experiments. Statistical comparison of TNF-α concentrations was done by two-tailed ANOVA, followed by Tukey’s multiple means comparison. Statistically significant differences were denoted as * = p < 0.05 and ** = p < 0.005
Fig. 4
Fig. 4
Tumor cells and tumor-secreted factors stimulate TNF-α production by monocytes. a Bone marrow monocytes were cultured overnight with B16 cells or 4T1 cells, or with tumor CM derived from these cells. Medium from monocyte cultures was collected 24 h after co-culture with live tumor cells or with tumor CM, and IFN-γ and TNF-α concentrations were determined by ELISA. b Bone marrow-derived monocytes were cultured overnight with tumor CM then incubated with Brefeldin A for 4 h and immunostained for detection of intracellular TNF-α expression by flow cytometry. Appropriate isotype control antibodies were used to assess the specificity of TNF-α staining. Similar results were obtained in three additional independent experiments. Statistical comparison of TNF-α concentrations was done by one-tailed ANOVA, with Dunnet’s post-test. Statistically significant differences were denoted as *** = p < 0.0005 and **** = p < 0.0001
Fig. 5
Fig. 5
Versican secreted by tumor cells induce monocyte TNF-α production via TLR2 signaling pathway. a Bone marrow monocytes were cultured overnight with B16 cells or 4T1 cells, or with tumor CM derived from these cells. Medium from monocyte cultures was collected 24 h after co-culture with live tumor cells or with tumor CM, and IFN-γ and TNF-α concentrations were determined by ELISA. b Bone marrow-derived monocytes were cultured overnight with tumor CM then incubated with Brefeldin A for 4 h and immunostained for detection of intracellular TNF-α expression by flow cytometry. Appropriate isotype control antibodies were used to assess the specificity of TNF-α staining. Similar results were obtained in three additional independent experiments. Statistical comparison of TNF-α concentrations was done by one-tailed ANOVA, with Dunnet’s post-test. Statistically significant differences were denoted as *** = p < 0.0005 and **** = p < 0.0001
Fig. 6
Fig. 6
In vivo TNF-α production within tumor tissues and effects on tumor-associated macrophage PD-L1 expression. a B16 tumors were collected from the s.c. tissues of mice, cryosectioned, and immunostained for detection of F4/80 (green) and PD-L1 expression (red and counterstained with DAPI (blue). b Tumor tissues were immunostained for co-localization of F4/80 (green) and TNF-α (red), and counterstained with DAPI (blue) for nuclear detection as noted in Methods. Depicted are representative images obtained from 6 separate tumors processed and immunostained for PD-L1, TNF-α, and F4/80. c Tumor tissues from WT and TNFR−/− mice were processed into single cell suspension for flow cytometric analysis of PD-L1 expression by macrophages (CD45+/CD11b+/Ly6G/F4-80+) and dendritic cells (CD11b+/CD11c+). Mean percentages of PD-L1+ cells were compared using non-parametric t-tests, with * = p < 0.05

References

    1. Tarin D, Price JE. Influence of microenvironment and vascular anatomy on “metastatic” colonization potential of mammary tumors. Cancer Res. 1981;41(9 Pt 1):3604–3609. - PubMed
    1. Schiavoni G, Gabriele L, Mattei F. The tumor microenvironment: a pitch for multiple players. Front oncol. 2013;3:90. doi: 10.3389/fonc.2013.00090. - DOI - PMC - PubMed
    1. Keskinov AA, Shurin MR. Myeloid regulatory cells in tumor spreading and metastasis. Immunobiology. 2015;220(2):236–242. doi: 10.1016/j.imbio.2014.07.017. - DOI - PubMed
    1. Quatromoni JG, Eruslanov E. Tumor-associated macrophages: function, phenotype, and link to prognosis in human lung cancer. Am J Transl Res. 2012;4(4):376–389. - PMC - PubMed
    1. Ostrand-Rosenberg S, Sinha P, Beury DW, Clements VK. Cross-talk between myeloid-derived suppressor cells (MDSC), macrophages, and dendritic cells enhances tumor-induced immune suppression. Semin Cancer Biol. 2012;22(4):275–281. doi: 10.1016/j.semcancer.2012.01.011. - DOI - PMC - PubMed