. 2016 Nov 11;17(Suppl 10):862.
doi: 10.1186/s12864-016-3105-4.

Reconstruction of ancestral RNA sequences under multiple structural constraints

Affiliations

Reconstruction of ancestral RNA sequences under multiple structural constraints

Olivier Tremblay-Savard et al. BMC Genomics. .

Abstract

Background: Secondary structures form the scaffold of multiple sequence alignment of non-coding RNA (ncRNA) families. An accurate reconstruction of ancestral ncRNAs must use this structural signal. However, the inference of ancestors of a single ncRNA family with a single consensus structure may bias the results towards sequences with high affinity to this structure, which are far from the true ancestors.

Methods: In this paper, we introduce achARNement, a maximum parsimony approach that, given two alignments of homologous ncRNA families with consensus secondary structures and a phylogenetic tree, simultaneously calculates ancestral RNA sequences for these two families.

Results: We test our methodology on simulated data sets, and show that achARNement outperforms classical maximum parsimony approaches in terms of accuracy, but also reduces by several orders of magnitude the number of candidate sequences. To conclude this study, we apply our algorithms on the Glm clan and the FinP-traJ clan from the Rfam database.

Conclusions: Our results show that our methods reconstruct small sets of high-quality candidate ancestors with better agreement to the two target structures than with classical approaches. Our program is freely available at: http://csb.cs.mcgill.ca/acharnement .

Keywords: Algorithm; Ancestor reconstruction; Evolution; Phylogeny; RNA; Secondary structure.


Figures

Fig. 1
Fig. 1
Our approach. Left: The red and blue areas represent regions of the sequence landscape of sequences with “good” affinity (i.e. sufficient to carry the associated function) to the target structures S (red) and S (blue). Here, α and α are paralogous sequences, as well as β and β , γ and γ and δ and δ . Using classical reconstruction approaches, A would be the inferred ancestor of the orthologous sequences α, β, γ and δ, and A would be the inferred ancestor of the orthologous sequences α , β , γ and δ . Shaded trees represent the classical ancestral reconstructions performed separately, while the main tree rooted at AA represents the simultaneous ancestral reconstruction approach introduced in this contribution. The rationale of this work is that ancestors inferred from a single family and structure may have a tendency to be located in the core of the affinity regions, and might end up with ancestral sequences that would be hard to reconcile. By contrast, a simultaneous reconstruction of orthologous families ensures the coherency of the process and a better inference of the ancestors (which are not necessarily located in the core of the affinity regions). Right: An example of a species tree T (dashed lines) of four species A, B, Γ and Δ corresponding to the neutral networks shown on the left. A duplication event is shown at the root, creating the two ncRNA families (represented by colored lines). Each node of the species tree contains a copy of each ncRNA family (one red, one blue). At the leaves of the species tree T, we find the two extant ncRNAs for which we have the sequence and the structure information. The linear gradient G is also shown: it represents the weight that is given to each structure when calculating the costs (G for one structure and 100 %-G for the other)
Fig. 2
Fig. 2
Graphical representation of the algorithm CalculateScores-2structs. In this example, we have four species (A, B, C and D) and for each species, we have two extant RNAs (for family 1, in red, and family 2, in blue). The three major steps of the algorithm are presented. 1) The bottom-up step, where minimum scores are calculated at every node of the tree for each family. The scores take into account the substitutions, but also the basepair cost for the current family, and for the other family. 2) The middle step. Here we link the minimum score matrices for families 1 and 2 by doing a simple Fitch on the two matrices. This allows us to reconstruct the original ancestral sequences (before the duplication), taking into account both families. 3) The top-down step, where we start from the root and select the nucleotides of minimum cost at every position and construct the optimal sequences
Fig. 3
Fig. 3
Three examples of the positions that need to be considered when using information from both structures. Note that in those examples, we consider that we are working on the sequence of family 1, and fam1 and fam2 represent the 2D structures of family 1 and 2 respectively. a The easier case when the position (8 here) is not paired in fam1, and we only have to consider the position paired with it in fam2. b The case where only one of the two paired positions of fam1 is paired in fam2. c The case where both paired positions of fam1 are paired in fam2
Fig. 4
Fig. 4
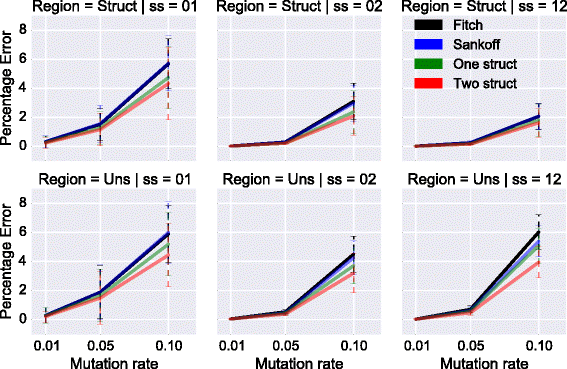
The average error percentage of all optimal sequences for both families in a tree. Each column represents a pair of secondary structures. The first row is for positions in structured regions, and the second row for unstructured regions. For three mutation rates: 1 %, 5 % and 10 %
Fig. 5
Fig. 5
Average number of optimal sequences in the tree, y-axis logscale. Each column represents a different pair of secondary structures. For three mutation rates: 1 %, 5 % and 10 %
Fig. 6
Fig. 6
Average number of optimal sequences in the root, y-axis logscale. Each column represents a different pair of secondary structures. For three mutation rates: 1 %, 5 % and 10 %

Similar articles

Cited by

  • Median and small parsimony problems on RNA trees.
    Marchand B, Anselmetti Y, Lafond M, Ouangraoua A. Marchand B, et al. Bioinformatics. 2024 Jun 28;40(Suppl 1):i237-i246. doi: 10.1093/bioinformatics/btae229. Bioinformatics. 2024. PMID: 38940169 Free PMC article.

References

    1. Pauling L, Zuckerkandl E. Chemical paleogenetics, molecular restoration studies of extinct forms of life. Acta Chem Scand. 1963;17(9-16):S9–16. doi: 10.3891/acta.chem.scand.17s-0009. - DOI
    1. Blanchette M, Green ED, Miller W, Haussler D. Reconstructing large regions of an ancestral mammalian genome in silico. Genome Res. 2004;14(12):2412–3. doi: 10.1101/gr.2800104. - DOI - PMC - PubMed
    1. Snir S, Pachter L. Phylogenetic profiling of insertions and deletions in vertebrate genomes. In: Research in Computational Molecular Biology, 10th Annual International Conference, RECOMB 2006, Venice, Italy, April 2-5, 2006, Proceedings: 2006. p. 265–80, doi:10.1007/11732990_23. - DOI
    1. Paten B, Herrero J, Fitzgerald S, Beal K, Flicek P, Holmes I, Birney E. Genome-wide nucleotide-level mammalian ancestor reconstruction. Genome Res. 2008;18(11):1829–43. doi: 10.1101/gr.076521.108. - DOI - PMC - PubMed
    1. Higgs PG, Lehman N. The rna world: molecular cooperation at the origins of life. Nat Rev Genet. 2015;16(1):7–17. doi: 10.1038/nrg3841. - DOI - PubMed

Publication types

Substances

LinkOut - more resources