. 2017 Jun 9;26(6):967-982.
doi: 10.3727/096368917X694994. Epub 2017 Feb 9.

Olfactory Ensheathing Cells Inhibit Gliosis in Retinal Degeneration by Downregulation of the Müller Cell Notch Signaling Pathway

Olfactory Ensheathing Cells Inhibit Gliosis in Retinal Degeneration by Downregulation of the Müller Cell Notch Signaling Pathway

Jing Xie et al. Cell Transplant. .

Abstract

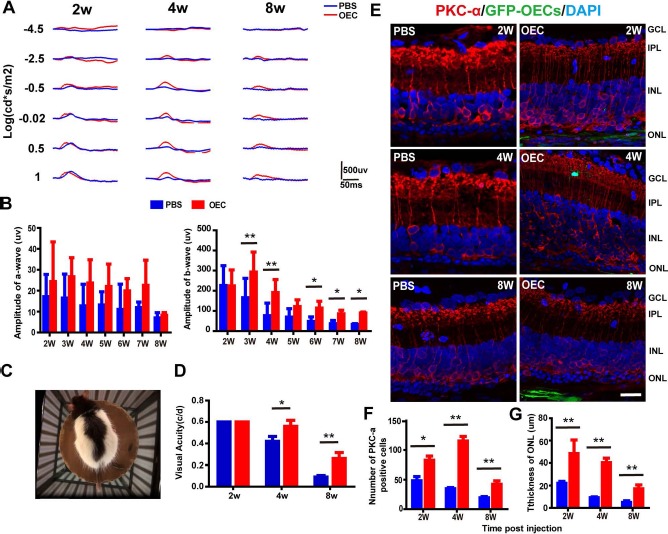
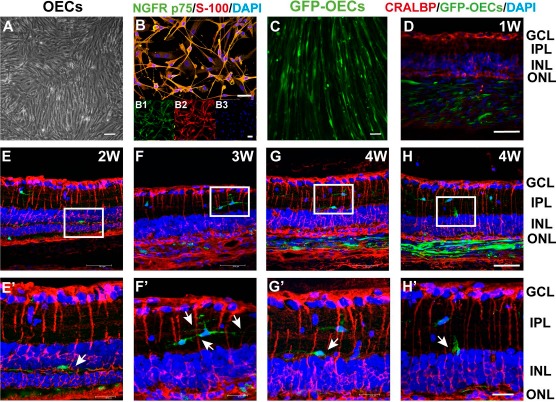
Retinal regeneration and self-repair, whether in response to injury or degenerative disease, are severely impeded by glial scar formation by Müller cells (specialized retinal macroglia). We have previously demonstrated that the activation of Müller cells and gliosis in the degenerative retina are significantly suppressed by the subretinal transplantation of a mixture of olfactory ensheathing cells (OECs) and olfactory nerve fibroblasts. However, the underlying molecular mechanism has remained elusive. Here we transplanted purified rat OECs into the subretinal space of pigmented Royal College of Surgeons (RCS) rats, a classic rodent model of retinal degeneration. Using behavioral testing and electroretinography, we confirmed that the grafted OECs preserved the visual function of rats for 8 weeks, relative to vehicle controls (phosphate-buffered saline). Histological evaluation of outer nuclear layer thickness and composition demonstrated that more photoreceptors and ON-bipolar cells were preserved in the retinas of OEC-treated RCS rats than in controls. The grafted OECs migrated into the outer plexiform layer, inner nuclear layer, and inner plexiform layer. They interacted directly with Müller cells in the retina of RCS rats, in three distinct patterns, and secreted matrix metalloproteinases 2 and 3. Previous studies have demonstrated that rat OECs express delta-like ligand (DLL), while Müller cells express Notch3, the receptor for DLL. Here we found that the grafted OECs significantly decreased the expression, by retinal cells, of Notch signaling pathway components (including Notch3, Notch4, DLL1, DLL4, Jagged1, Hes1, and Hes5) 2 weeks after the cell transplantation and that this effect persisted for a further 2 weeks. Based on these findings, we suggest that transplanted OECs inhibit the activation of Müller cells and the associated gliosis, at least partly through suppression of the Notch pathway.


Figures

Figure 1.
Figure 1.
Subretinal olfactory ensheathing cell (OEC) transplantation improved visual function and protected photoreceptors and metabotropic bipolar (ON-bipolar) cells in Royal College of Surgeons (RCS) rats. (A) Representative electroretinography (ERG) waveforms of one rat at different time points after OEC/phosphate-buffered saline (PBS) transplantation (2, 4, and 8 weeks). Red trace, OEC transplantation; blue trace, subretinal injection of PBS (control). (B, left) A-wave amplitude following OEC (red) and PBS (blue) injection at 2 to 8 weeks. No significant differences were observed between groups. (B, right) Same as the left, but showing data for b-wave amplitude. After 2 weeks, the b-wave amplitude in the OEC-treated eyes was significantly higher than that in the PBS-treated (control) eyes. Data are shown as mean±standard deviation. (C, D) Changes in visual acuity with time. (C) Top-down photograph of the behavioral apparatus and the rat being tested. (D) Visual acuity of the OEC-treated (red) and PBS-treated (blue) eyes at 2, 4, and 8 weeks after transplantation (n = 8); cyc/deg, cycles/degree. (E) Double immunolabeling with protein kinase Cα (PKCα, red) and green fluorescent protein (GFP)-OECs (green) in the retinas of the PBS and OEC groups at 2, 4, and 8 weeks after transplantation. Background staining with 4′,6-diamidino-2-phenylindole (DAPI; blue). (F) Number of PKCα+ cells and (G) mean thickness of the outer nuclear layer (ONL) in OEC-treated and PBS-treated retinas. *p < 0.05, **p < 0.01. INL, inner nuclear layer; IPL, inner plexiform layer; GCL, ganglion cell layer. Scale bar: 50 μm.
Figure 2.
Figure 2.
Interaction patterns between grafted OECs and recipient Müller cells. (A) The morphology of OECs after primary culture for 14 days. (B) Merged image showing immunostaining to identify OECs. Insets show separate color channels; (B1) Nerve growth factor receptor p75-positive (NGFRp75+) (green); (B2) S-100β+ (red); (B3) DAPI+ (blue). (C) OECs labeled by lentiviruses carrying the enhanced GFP (LV-GFP) (green). (D–H′) Example patterns of the interaction between OECs and Müller cells. (E′–H′) Higher magnification images of the areas shown in white boxes in (E–H). White arrows indicate the phenotype of a migrated OEC in the retina of RCS rats. GFP-OECs, green; cellular retinaldehyde-binding protein (CRALBP) (Müller cell marker), red; DAPI, blue. Scale bars: 100 μm (A–C), 50 μm (D–H), 20 μm (E′–H′).
Figure 3.
Figure 3.
OECs expressed and secreted MMP-2 and MMP-3 in vitro and in vivo. (A, B) Double immunostaining (merge and separate channels) showing the expression of matrix metalloproteinase 2 (MMP-2) and MMP-3 on the OECs after culture for 14 days [NGFRp75, green; MMP-2 and MMP-3, red; DAPI, blue]. (C, D) Results of enzyme-linked immunosorbent assay (ELISA) for MMP on retinal lysates, showing the concentration of MMP-2 and MMP-3 in the OEC culture medium and control medium after culture for 5, 8, 11, and 14 days. (n = 9). (E, F) Concentration of MMP-2 and MMP-3 in the blank group, OEC group, and PBS group at 1, 2, 3, and 4 weeks after transplantation, as measured by ELISA of retinal lysates (n = 9). (G) Examples of Transwell assay images. (H) Quantified group Transwell assay results showing significant migration of OECs when cocultured with Müller cells and significantly inhibited migration after tissue inhibitor of metalloproteinase 2 (TIMP-2) was added (n = 3). *p < 0.05, **p < 0.01. Scale bars: 50 μm (A, C), 100 μm (G).
Figure 4.
Figure 4.
Transplanted OECs suppressed the gliotic reaction of Müller cells. (A) OEC- and PBS-treated retinas at 2, 4, and 8 weeks [Müller cells, as stained by glial fibrillary acidic protein (GFAP), red; DAPI, blue]. (B) Quantitative group analysis of the relative fluorescence intensity of GFAP. (C) Example Western blot of GFAP in both groups (b-actin, loading control). (D) Group comparison of the levels of GFAP protein expression in OEC-treated and PBS-treated retinas at 2, 4, and 8 weeks. *p < 0.05, **p < 0.01. Scale bar: 50 μm.
Figure 5.
Figure 5.
Components of the Notch pathway decreased after OEC transplantation in RCS rat retinas. (A) Müller cells, left five panels: The primary cultured Müller cells appeared flattened and spindle-like after three passages of purification. Immunocytochemical analysis showed that the cells were CRALBP+. Double immunostaining indicated that Notch3 was expressed on Müller cells [Müller cells, CRALBP, red; Notch3, green; DAPI, blue]. (A) OECs, right two panels: delta-like ligand 1 (DLL1) and DLL4 were expressed on OECs (DLL1 and DLL4, green; DAPI, blue). (B) The mRNA expression of CRALBP and Notch3 in purified Müller cells by RT-PCR after one and three passages. Left: Bar chart of expression levels; right: plot of Notch3 mRNA expression versus CRALBP mRNA expression, with regression line (r2 = 0.998, p < 0.01). (C) Double-labeled immunofluorescence staining against CRALBP (red) and Notch3 (green) in PBS-treated eyes and OEC-treated eyes (D) Quantitative group analysis of the relative fluorescence intensity of the Notch3. (E, F) Changes in mRNA levels of components of the Notch pathway at 2 and 4 weeks after treatment. (G) Example of Western blot for Notch3 and DLL4 protein levels at 2 and 4 weeks after OEC or PBS treatment. (H) Quantified group analysis of protein levels (by Western blot) of Notch3 levels at 2 and 4 weeks after OEC or PBS treatment. β-Actin is a loading control. (I) Same as panel (H), but for DLL4. Bars and error bars represent mean±standard deviation (n = 3). *p < 0.05, **p < 0.01. Scale bars: 50 μm.

References

    1. Zhao T.T., Tian C.Y., Yin Z.Q. Activation of Muller cells occurs during retinal degeneration in RCS rats. Adv Exp Med Biol. 2010; 664: 575–83. - PubMed
    1. Thomas B.B., Zhu D., Zhang L., Thomas P.B., Hu Y., Nazari H., Stefanini F., Falabella P., Clegg D.O., Hinton D.R., Humayun M.S. Survival and functionality of hESC-derived retinal pigment epithelium cells cultured as a monolayer on polymer substrates transplanted in RCS rats. Invest Ophthalmol Vis Sci. 2016; 57(6): 2877–87. - PubMed
    1. Lassiale S., Valamanesh F., Klein C., Hicks D., Abitbol M., Versaux-Botteri C. Changes in aquaporin-4 and Kir4.1 expression in rats with inherited retinal dystrophy. Exp Eye Res. 2016; 148: 33–44. - PubMed
    1. Tzameret A., Sher I., Belkin M., Treves A.J., Meir A., Nagler A., Levkovitch-Verbin H., Barshack I., Rosner M., Rotenstreich Y. Transplantation of human bone marrow mesenchymal stem cells as a thin subretinal layer ameliorates retinal degeneration in a rat model of retinal dystrophy. Exp Eye Res. 2014; 118: 135–44. - PubMed
    1. Doucette R. Glial influences on axonal growth in the primary olfactory system. Glia 1990; 3(6): 433–49. - PubMed

Publication types

MeSH terms

LinkOut - more resources