

Ultrasoft microwire neural electrodes improve chronic tissue integration
- PMID: 28185910
- PMCID: PMC5512864
- DOI: 10.1016/j.actbio.2017.02.010
Ultrasoft microwire neural electrodes improve chronic tissue integration
Abstract
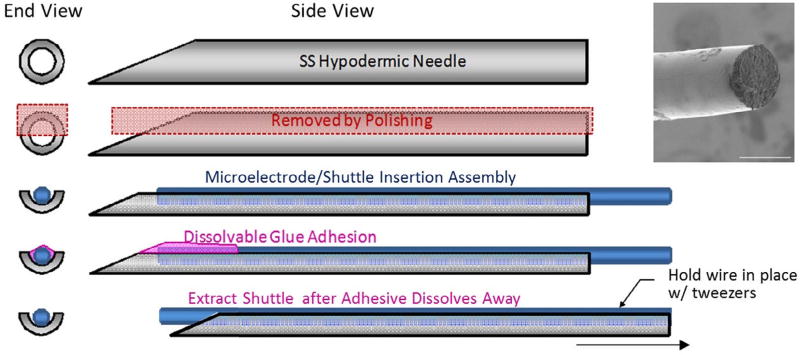
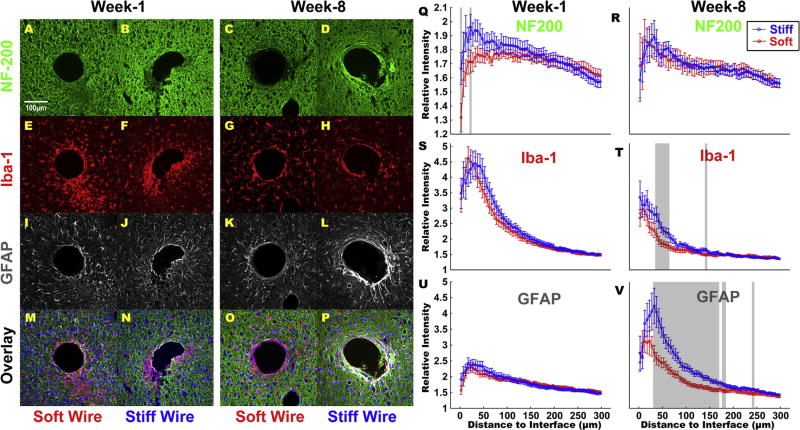
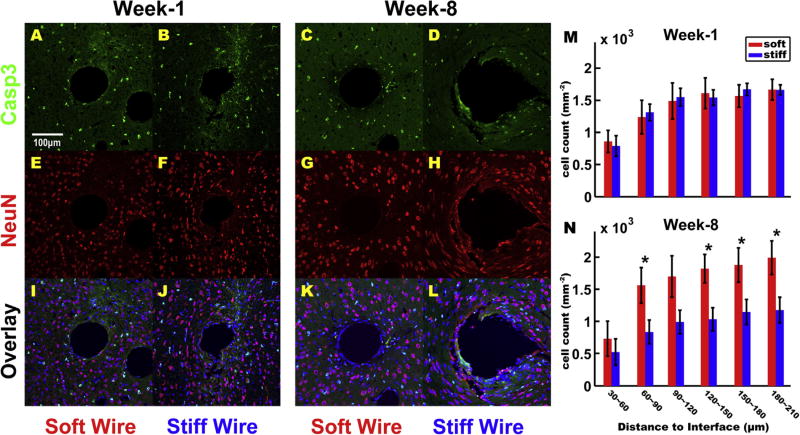
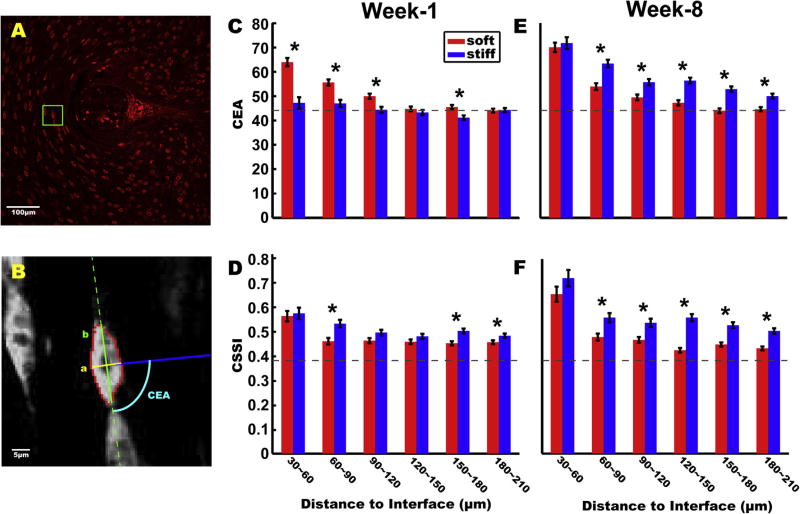
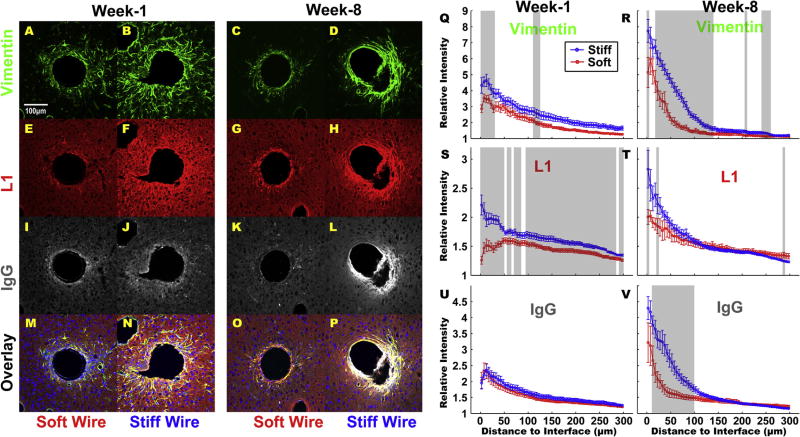
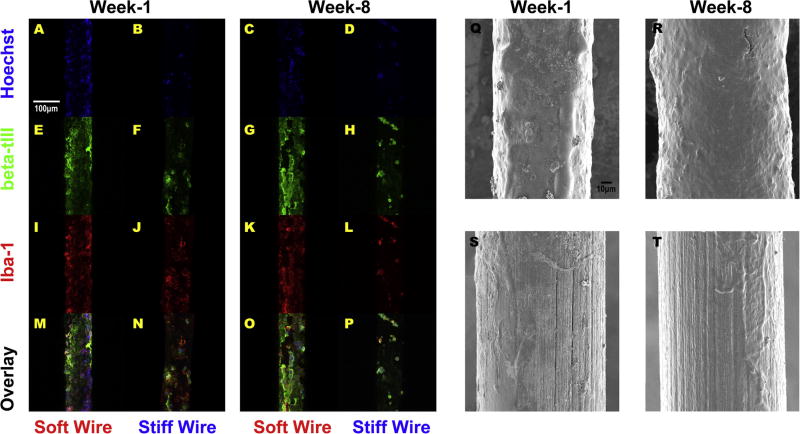
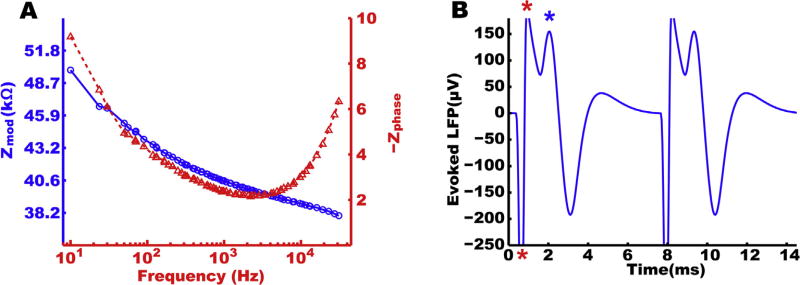
Chronically implanted neural multi-electrode arrays (MEA) are an essential technology for recording electrical signals from neurons and/or modulating neural activity through stimulation. However, current MEAs, regardless of the type, elicit an inflammatory response that ultimately leads to device failure. Traditionally, rigid materials like tungsten and silicon have been employed to interface with the relatively soft neural tissue. The large stiffness mismatch is thought to exacerbate the inflammatory response. In order to minimize the disparity between the device and the brain, we fabricated novel ultrasoft electrodes consisting of elastomers and conducting polymers with mechanical properties much more similar to those of brain tissue than previous neural implants. In this study, these ultrasoft microelectrodes were inserted and released using a stainless steel shuttle with polyethyleneglycol (PEG) glue. The implanted microwires showed functionality in acute neural stimulation. When implanted for 1 or 8weeks, the novel soft implants demonstrated significantly reduced inflammatory tissue response at week 8 compared to tungsten wires of similar dimension and surface chemistry. Furthermore, a higher degree of cell body distortion was found next to the tungsten implants compared to the polymer implants. Our results support the use of these novel ultrasoft electrodes for long term neural implants.
Statement of significance: One critical challenge to the translation of neural recording/stimulation electrode technology to clinically viable devices for brain computer interface (BCI) or deep brain stimulation (DBS) applications is the chronic degradation of device performance due to the inflammatory tissue reaction. While many hypothesize that soft and flexible devices elicit reduced inflammatory tissue responses, there has yet to be a rigorous comparison between soft and stiff implants. We have developed an ultra-soft microelectrode with Young's modulus lower than 1MPa, closely mimicking the brain tissue modulus. Here, we present a rigorous histological comparison of this novel ultrasoft electrode and conventional stiff electrode with the same size, shape and surface chemistry, implanted in rat brains for 1-week and 8-weeks. Significant improvement was observed for ultrasoft electrodes, including inflammatory tissue reaction, electrode-tissue integration as well as mechanical disturbance to nearby neurons. A full spectrum of new techniques were developed in this study, from insertion shuttle to in situ sectioning of the microelectrode to automated cell shape analysis, all of which should contribute new methods to the field. Finally, we showed the electrical functionality of the ultrasoft electrode, demonstrating the potential of flexible neural implant devices for future research and clinical use.
Keywords: Composite bio-electrodes; Conducting elastomer; Deep brain stimulation; Neural electrode.
Copyright © 2017. Published by Elsevier Ltd.
Figures
Similar articles
-
Elastomeric and soft conducting microwires for implantable neural interfaces.Soft Matter. 2015 Jun 28;11(24):4847-61. doi: 10.1039/c5sm00174a. Epub 2015 May 20. Soft Matter. 2015. PMID: 25993261 Free PMC article.
-
Evaluation of a conducting elastomeric composite material for intramuscular electrode application.Acta Biomater. 2020 Feb;103:81-91. doi: 10.1016/j.actbio.2019.12.021. Epub 2019 Dec 18. Acta Biomater. 2020. PMID: 31863910 Free PMC article.
-
Comprehensive characterization and failure modes of tungsten microwire arrays in chronic neural implants.J Neural Eng. 2012 Oct;9(5):056015. doi: 10.1088/1741-2560/9/5/056015. Epub 2012 Sep 25. J Neural Eng. 2012. PMID: 23010756
-
A review on mechanical considerations for chronically-implanted neural probes.J Neural Eng. 2018 Jun;15(3):031001. doi: 10.1088/1741-2552/aa8b4f. Epub 2017 Sep 8. J Neural Eng. 2018. PMID: 28885187 Review.
-
Conducting polymers for neural interfaces: challenges in developing an effective long-term implant.Biomaterials. 2008 Aug-Sep;29(24-25):3393-9. doi: 10.1016/j.biomaterials.2008.04.047. Epub 2008 May 23. Biomaterials. 2008. PMID: 18501423 Review.
Cited by
-
Flexible Multiplexed In2O3 Nanoribbon Aptamer-Field-Effect Transistors for Biosensing.iScience. 2020 Aug 18;23(9):101469. doi: 10.1016/j.isci.2020.101469. eCollection 2020 Sep 25. iScience. 2020. PMID: 33083757 Free PMC article.
-
Design Choices for Next-Generation Neurotechnology Can Impact Motion Artifact in Electrophysiological and Fast-Scan Cyclic Voltammetry Measurements.Micromachines (Basel). 2018 Sep 27;9(10):494. doi: 10.3390/mi9100494. Micromachines (Basel). 2018. PMID: 30424427 Free PMC article.
-
Telemetric intracranial pressure monitoring in children.Childs Nerv Syst. 2020 Jan;36(1):49-58. doi: 10.1007/s00381-019-04271-4. Epub 2019 Jul 15. Childs Nerv Syst. 2020. PMID: 31309286
-
Classifying Intracortical Brain-Machine Interface Signal Disruptions Based on System Performance and Applicable Compensatory Strategies: A Review.Front Neurorobot. 2020 Oct 9;14:558987. doi: 10.3389/fnbot.2020.558987. eCollection 2020. Front Neurorobot. 2020. PMID: 33162885 Free PMC article. Review.
-
Advanced neuroprosthetic electrode design optimized by electromagnetic finite element simulation: innovations and applications.Front Bioeng Biotechnol. 2024 Nov 6;12:1476447. doi: 10.3389/fbioe.2024.1476447. eCollection 2024. Front Bioeng Biotechnol. 2024. PMID: 39574462 Free PMC article. Review.
References
-
- Schwartz AB, Cui XT, Weber DJ, Moran DW. Brain-controlled interfaces: movement restoration with neural prosthetics. Neuron. 2006;52(1):205–220. - PubMed
-
- Wolpaw JR, Birbaumer N, McFarland DJ, Pfurtscheller G, Vaughan TM. Brain-computer interfaces for communication and control. Clin. Neurophysiol. 2002;113(6):767–791. - PubMed
-
- Schwartz AB. Cortical neural prosthetics. Annu. Rev. Neurosci. 2004;27:487–507. - PubMed
Publication types
MeSH terms
Substances
Grants and funding
LinkOut - more resources
Full Text Sources
Other Literature Sources
Research Materials
