. 2017 Feb 10:8:14345.
doi: 10.1038/ncomms14345.

Topical tacrolimus for the treatment of secondary lymphedema

Affiliations

Topical tacrolimus for the treatment of secondary lymphedema

Jason C Gardenier et al. Nat Commun. .

Abstract

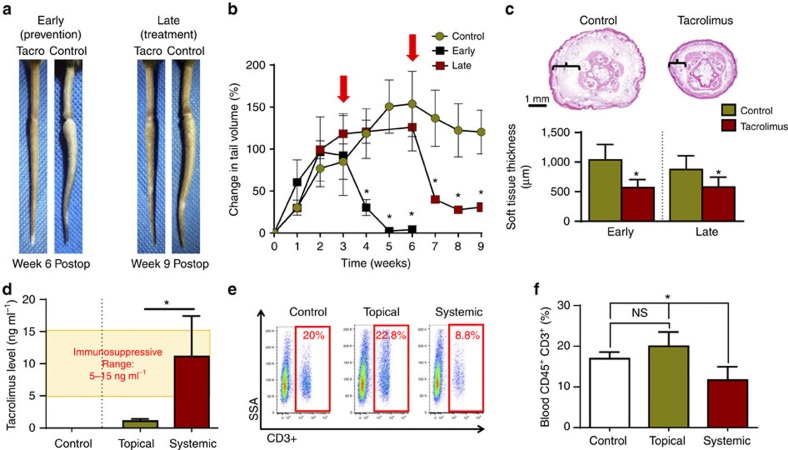
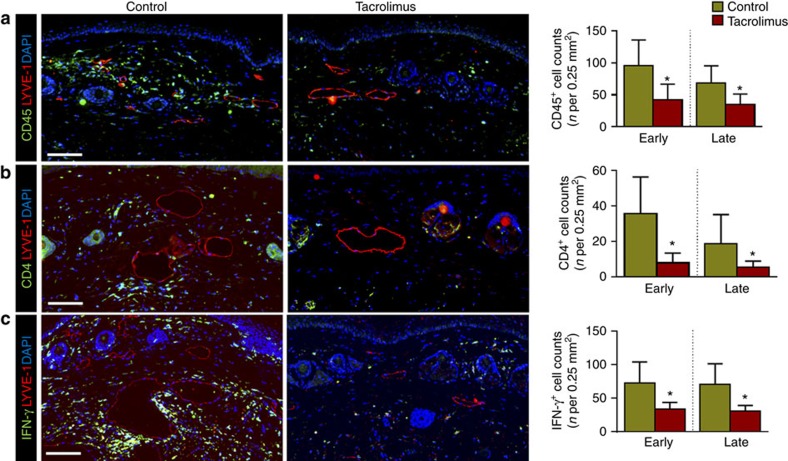
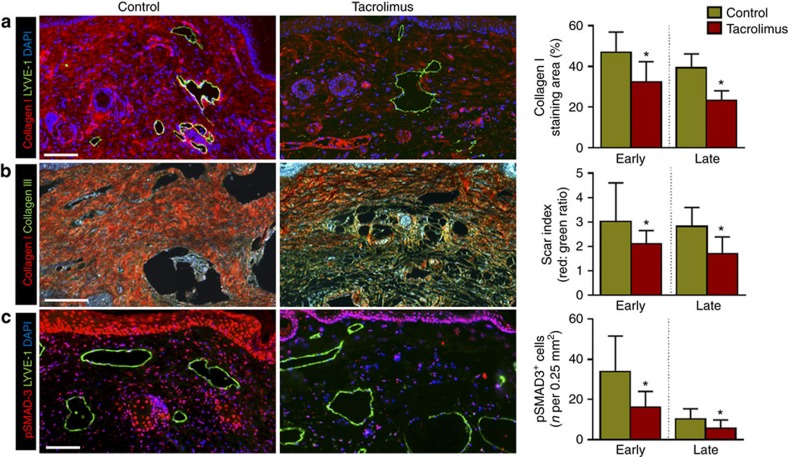
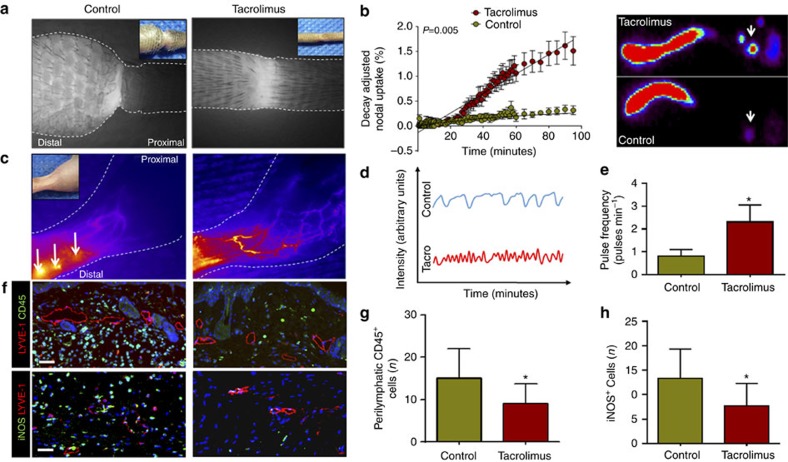
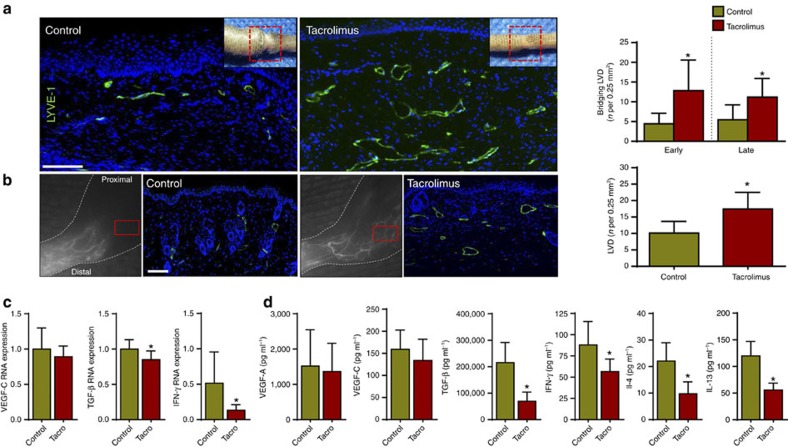
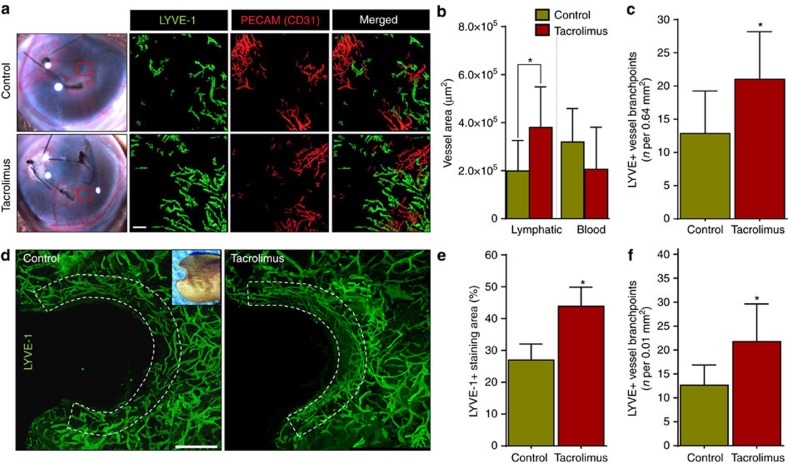
Secondary lymphedema, a life-long complication of cancer treatment, currently has no cure. Lymphedema patients have decreased quality of life and recurrent infections with treatments limited to palliative measures. Accumulating evidence indicates that T cells play a key role in the pathology of lymphedema by promoting tissue fibrosis and inhibiting lymphangiogenesis. Here using mouse models, we show that topical therapy with tacrolimus, an anti-T-cell immunosuppressive drug, is highly effective in preventing lymphedema development and treating established lymphedema. This intervention markedly decreases swelling, T-cell infiltration and tissue fibrosis while significantly increasing formation of lymphatic collaterals with minimal systemic absorption. Animals treated with tacrolimus have markedly improved lymphatic function with increased collecting vessel contraction frequency and decreased dermal backflow. These results have profound implications for lymphedema treatment as topical tacrolimus is FDA-approved for other chronic skin conditions and has an established record of safety and tolerability.


Conflict of interest statement

The authors declare no competing financial interests.

Figures

Figure 1
Figure 1. Topical tacrolimus decreases tail lymphedema.
(a) Representative photographs of mouse tails after surgical excision of superficial/deep collecting lymphatics and treatment with or without topical tacrolimus beginning either 2 weeks (early treatment) or 6 weeks (late treatment) after surgery. Images represent 4 weeks of treatment in the early group and 3 weeks of treatment in the late group. (b) Graphical representation of tail volume changes after early (*P=0.021) or late (*P=0.018) treatment with tacrolimus, as compared with controls (red arrows indicate timing of treatment) (n=8/group). (c) Representative cross-sectional histological images (upper panel) of control and early tacrolimus-treated mouse tails harvested 6 weeks after lymphatic ablation. Brackets show soft tissue thickness. Quantification of soft tissue changes (lower panel) after early or late treatment with tacrolimus (*P≤0.001) (n=8/group). (d) Quantification of whole-blood tacrolimus levels demonstrating immunosuppressive concentrations in systemically treated animals (4 mg kg−1 intraperitoneally daily) and non-immunosuppressive levels in the topically treated group (*P=0.007; n=6/group). (e) Representative flow cytometry plots displaying side scatter area (SSA) on the y axis and CD3+ cells (T cells) on the x axis for animals retreated with vehicle control, topical tacrolimus or systemic tacrolimus. (f) Quantification of blood T cells for each group. Note significant reduction in T cells only in systemically treated animals (*P=0.012; n=6/group). Experiments were repeated two to three times. All data represent mean±s.d. with P≤0.05 considered as significant. Two-tailed Student's t-test (c,d) and analysis of variance (ANOVA) with post hoc tests (b,f).
Figure 2
Figure 2. Topical tacrolimus decreases inflammation after lymphatic injury.
(ac) Representative × 40 images of tail tissue sections from control and topical tacrolimus-treated animals 6 weeks after surgery with immunofluorescent localization of CD45+(a), CD4+ cells (b) and IFN-γ+ cells (c). Lymphatic vessels are stained for LYVE-1+ (red) in each figure. Quantifications of positive cell per 0.25 mm2 area (four random areas per mouse) for both early and late treatments are shown to the right of each figure (P<0.001 for all; n=8/group). Experiments were repeated two to three times. All data represent mean±s.d. with P≤0.05 considered as significant. Data analysed by two-tailed Student's t-test. Scale bars, 100 μm.
Figure 3
Figure 3. Topical tacrolimus decreases fibrosis in lymphedema.
(a) Representative × 40 images of tail tissues from control or early tacrolimus-treated mice 6 weeks after surgery with immunofluorescent localization of type I collagen (red) and lymphatic vessels (green). Quantifications of the percent area of collagen I staining in both early and late treatment are shown to the right (P<0.001 for both; n=8/group). (b) Representative × 40 images of picrosirius red staining of tail tissues harvested from control or early tacrolimus-treated animals (red-orange birefringence represents collagen I deposition; green-yellow birefringence represents collagen III deposition). Quantification of Scar Index (red: green ratio) is shown to the right (P=0.036 early; P<0.001 late; n=8/group). (c) Representative × 40 immunofluorescent co-localization of pSMAD-3 (red) with lymphatic vessel (green) in tail tissues harvested from animals treated with control or early treatment with tacrolimus 6 weeks after surgery. Quantification of the number of positive cells per 0.25 mm2 area (four random areas per mouse) for both is shown to the right of (P=0.002 early, P=0.026 late; n=8/group). Experiments were repeated two to three times. All data represent mean±s.d. with P≤0.05 considered as significant. Data analysed by two-tailed Student's t-test. Scale bars, 100 μm.
Figure 4
Figure 4. Tacrolimus improves lymphatic function after surgical lymphatic injury.
(a) Representative ICG images of mouse tails are shown 6 weeks after surgery following early treatment with or without tacrolimus. Note the flow of ICG proximally across the wound in tacrolimus-treated animals (n=6/group). Inset shows photograph of same mice for orientation. (b) Decay-adjusted uptake of 99mTc by sacral lymph nodes 6 weeks after surgical ligation of superficial/deep lymphatics in control and early tacrolimus (beginning 2 weeks after surgery)-treated animals (left panel; *P=0.005; n=6/group). Representative heat maps are shown in the right panel with the white arrow pointing towards the sacral lymph nodes (n=6/group). (c) Representative ICG images of hindlimbs obtained 50 min after distal foot injection in mice treated with or without tacrolimus 4 weeks after PLND (n=6/group). White arrows show dermal backflow (increased red colour) of ICG. Inset photograph is for orientation. (d,e) Graphical representation of lymphatic vessel pulsations in hindlimb collecting vessels of mice treated with or without tacrolimus 4 weeks after PLND. Quantification of pulsation frequency is shown to the right (*P=0.001; n=6/group). (f) Representative × 40 fluorescent co-localization images of inflammatory cells (CD45+, green; upper panel), iNOS+ cells (green; lower panel) and lymphatic vessels (LYVE-1+, red) in tissues harvested from the distal hindlimbs of animals treated with control or tacrolimus 4 weeks after PLND. Note perilymphatic accumulation of CD45+ and iNOS+ cells. (g) Quantification of perilymphatic CD45+ (h) and iNOS+ cells in 0.25 mm2 area (four random areas per mouse) of distal hindlimb tissues of control or tacrolimus-treated animals harvested 4 weeks after PLND (*P=0.0001 (g) and *P=0.0007 (h); n=6). Experiments were repeated two to three times. All data represent mean±s.d. with P≤0.05 considered as significant. Data analysed by two-tailed Student's t-test. Scale bars, 50 μm.
Figure 5
Figure 5. Topical tacrolimus increases formation of collateral lymphatic vessels.
(a) Left panel: representative longitudinal immunofluorescent × 40 images of LYVE-1 vessels (green) bridging the surgically created tail wounds of control and early-treated tacrolimus mice harvested 6 weeks after lymphatic injury; inset shows area where longitudinal sections were obtained. Right panel: quantification of bridging lymphatic vessel density (LVD) in the wounded portion of the tail in control versus early or late-treated tacrolimus mice (P<0.001 for both; n=6/group). (b) Left panel: representative ICG (left panels) and × 40 immunofluorescent images of LYVE-1+ vessels (right panel showing area in red box) in control and tacrolimus-treated animals 4 weeks following PLND. Right panel: quantification of collateral lymphatic LVD in the anterolateral thigh region of animals treated with control or tacrolimus (P<0.001; n=6/group). (c) qPCR of RNA harvested from control and early-treated tacrolimus mouse tail tissues harvested 6 weeks after lymphatic injury, demonstrating relative expression of VEGF-C (P=0.264), TGF-β1 (P=0.006) and IFN-γ (P=0.022; n=6/group). (d) Protein concentrations from hindlimb tissues for each group using enzyme-linked immunosorbant assay for VEGF-A (P=0.711), VEGF-C (P=0.233), TGF- β1 (P<0.001), IFN-γ (P=0.022), IL-4 (P=0.034) and IL-13 (P=0.009; n=6/group). Experiments were repeated two to three times. All data represent mean±s.d. with P≤0.05 considered as significant. Data analysed by two-tailed student's t-test. Scale bars, 100 μm.
Figure 6
Figure 6. Tacrolimus increases inflammatory lymphangiogenesis.
(a) Representative gross (left panels) and whole-mount × 5 images (right panels) of mouse corneas stained for lymphatic vessels (High LYVE-1+/low CD31+, green) and blood vessels (CD31+/LYVE-1, red) harvested 2 weeks after suture placement and treatment either with vehicle control or systemic tacrolimus. Red box denotes area shown in whole-mount images. Scale bar, 100 μm. (b) Quantification of corneal lymphatic (LYVE-1+) and blood (CD31+/LYVE-1 ) vessels (*P=0.032, n=6/group). (c) Quantification of lymphatic vessel branch points per 0.64 mm2 area (four random areas/mouse) in suture placed cornea treated with or without tacrolimus demonstrating increased branching in tacrolimus-treated animals (P=0.033; n=6/group). (d) Representative immunofluorescent whole-mount × 5 images of ear wounds localizing LYVE-1+ in control or topical tacrolimus-treated animals harvested 4 weeks after wounding. Inset photograph shows area where sections were obtained. Scale bar, 800 μm. (e) Quantification of the LYVE-1+ staining area in ear skin (within 400 μm of the wound) demonstrating an increase in lymphangiogenesis in tacrolimus-treated animals (P<0.001) (n=6/group). (f) Quantification of lymphatic vessel branch points per unit area in ear wounds treated with or without tacrolimus, demonstrating increased branching in tacrolimus-treated animals (P<0.001; n=6/group). Experiments were repeated two to three times. All data represent mean±s.d. with P≤0.05 considered as significant. Data analysed by two-tailed Student's t-test.

References

    1. DiSipio T., Rye S., Newman B. & Hayes S. Incidence of unilateral arm lymphoedema after breast cancer: a systematic review and meta-analysis. Lancet Oncol. 14, 500–515 (2013). - PubMed
    1. Petrek J. A. & Heelan M. C. Incidence of breast carcinoma-related lymphedema. Cancer 83, 2776–2781 (1998). - PubMed
    1. Rockson S. G. & Rivera K. K. Estimating the population burden of lymphedema. Ann. N. Y. Acad. Sci. 1131, 147–154 (2008). - PubMed
    1. Erickson V. S., Pearson M. L., Ganz P. A., Adams J. & Kahn K. L. Arm edema in breast cancer patients. J. Natl Cancer Inst. 93, 96–111 (2001). - PubMed
    1. Hayes S. C. et al.. Upper-body morbidity after breast cancer: incidence and evidence for evaluation, prevention, and management within a prospective surveillance model of care. Cancer 118, 2237–2249 (2012). - PubMed

Publication types

MeSH terms